Interactive Display Market Research Report - Forecast till 2032

Interactive Display Market Research Report Information By Product (Kiosk, Whiteboard, Table, Video Wall, and Monitor), By Panel Size (17” to 32”, 32” to 65”, and 65” & Above), By End User (Education, BFSI, Retail, Sports & Events, Entertainment, Healthcare, and Others) And By Region (North America, Europe, Asia-Pacific, And Rest Of The World) – Industry Size, Share and Forecast Till 2032

ID: MRFR/SEM/6570-HCR | 111 Pages | Author: Shubham Munde | March 2024         

Interactive Display Market Speak to Analyst Request a Free Sample

Global Interactive Display Market Overview:


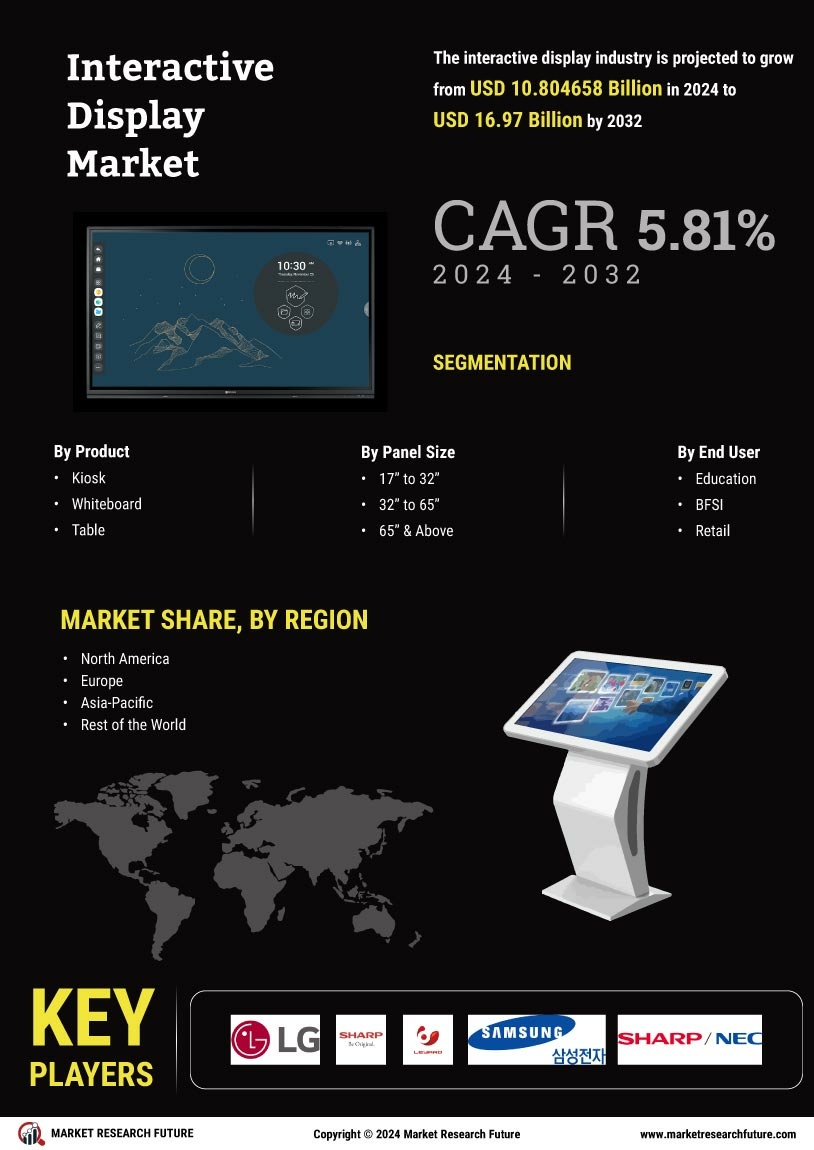
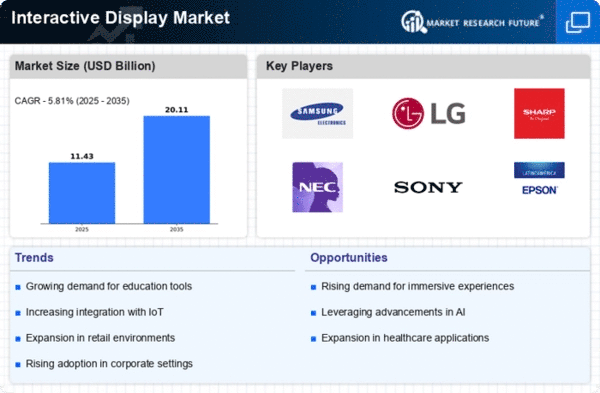
The interactive display market size was valued at USD 9.5 Billion in 2022. The interactive display industry is projected to grow from USD 10.13 Billion in 2023 to USD 16.97 Billion by 2032, exhibiting a compound annual growth rate (CAGR) of 6.66% during the forecast period (2023 - 2032). The increasing adoption of interactive learning solutions, the rise in the adoption of interactive displays, and the introduction of new and advanced technology are the key market drivers enhancing market growth.


Global Interactive Display Market Overview


Source: Secondary Research, Primary Research, MRFR Database, and Analyst Review


Interactive Display Market Trends


  • The growing demand for interactive display panels in healthcare is driving the market growth.


Market CAGR for interactive display is driven by the growing healthcare and entertainment industries, providing growth opportunities for key players in the interactive display market. There is an increasing potential for healthcare and entertainment industries for applications, including science observatories, museums, movie halls, and game zones in the interactive display market. Nintendo Co., Ltd. (Japan), Active Gaming Co. (US), and others are developing advanced games and consoles to provide consumers with the best experience in terms of better displays and engagement. Similarly, in 2020, AT&T Healthcare, a leader in advanced healthcare technologies, selected LifeMedID, a major player in digital identity assurance and authentication software, and Elo, a provider of interactive solutions, to design a frictionless patient experience and Streamline Patient Registration.


Furthermore, expanding use of intelligent displays in residential and public facilities, including retail stores, an increase in infrastructural improvements such as smart homes, and a surge in demand for smart cars are contributing to market revenue growth. The growing utilization of smart displays in the healthcare industry to show hospital maps and instructions to assist patients or visitors in getting to their preferred location drives market revenue growth. In addition, rising internet penetration, digitalization, consumer preference for smart home appliances such as smart TVs, smart speakers, and smart home devices, and huge demand for smart mirrors in retail sectors and automotive drive interactive display market revenue growth.


Moreover, technological developments and rising acceptance across several applications, including tablets, smartphones, laptops, and smart TVs, are expected to grow market revenue. Increased Over-The-Top (OTT) content availability propels the wireless display sector for consumer applications. Another important factor driving the market growth for interactive displays in corporate applications is price savings, which can be realized via easy setup and decreased time spent setting up meeting rooms. In addition, compatibility of wireless displays with 4K technology enables higher quality content and drives up usage in consumer electronics devices.


Increasing the adoption of interactive displays in the retail sector to provide information regarding the availability of products based on categories is expected to fuel the growth of the interactive display market. In addition, interactive displays are used in the retail sector in various ways, such as Point of Sale (POS) systems, kiosks, ATMs, and digital signage, to attract consumers for expanding businesses. It also offers enhanced user engagement and better shopping experiences, which in turn is expected to boost the growth of the interactive display market.


Interactive Display Market Segment Insights:


Interactive Display Product Insights


The interactive display market segmentation, based on product, includes a kiosk, whiteboard, table, video wall, and monitor. The kiosk segment dominated the market, accounting for 35% of market revenue (3.54 Billion). In developing economies, category growth is driven by increasing demand for interactive kiosks as they deliver several advantages to service providers and optimize the overall price of business by reducing labor and infrastructure. However, video wall is the fastest-growing category due to the growing demand for video wall interactive displays in the healthcare sector.


Interactive Display Panel Size Insights


The interactive display market segmentation, based on panel size, includes 17” to 32”, 32” to 65”, and 65” & above. The 32” to 65”category generated the most income due to the growing adoption of interactive displays in advertising, digital signage, training, and boardroom presentations. However, 65" & above is the fastest-growing category due to growing demand from educational institutes and government & corporate offices.


Figure 1: Interactive Display Market, by Panel Size, 2022 & 2032 (USD Billion)


Interactive Display Market, by Panel Size, 2022 & 2032


Source: Secondary Research, Primary Research, MRFR Database, and Analyst Review


Interactive Display End User Insights


The interactive display market segmentation, based on end users, includes education, BFSI, retail, sports & events, entertainment, healthcare, and others. The retail category generated the most income (70.4%). Demand for touch-enabled displays in the retail industry is expected to surge due to the popularization of interactive devices and increased use of self-service kiosks and tables. However, education is the fastest-growing category due to the growing use of digital classrooms for active learning in colleges and schools.


Interactive Display Regional Insights


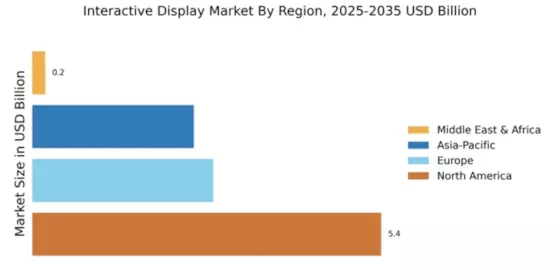
By region, the study provides market insights into North America, Europe, Asia-Pacific, and the Rest of the World. The North American interactive display market will dominate, owing to growing innovations and research in technological developments. Market players in the region are investing in new materials to make more flexible and durable display panels will boost the market growth in this region. Further, the US interactive display market held the largest market share, and the Canadian interactive display market was the fastest-growing market in the North American region.


Further, the significant countries studied in the market report are The US, Canada, German, France, the UK, Italy, Spain, China, Japan, India, Australia, South Korea, and Brazil.


Figure 2: INTERACTIVE DISPLAY MARKET SHARE BY REGION 2022 (USD Billion)


INTERACTIVE DISPLAY MARKET SHARE BY REGION 2022


Source: Secondary Research, Primary Research, MRFR Database, and Analyst Review


Europe's interactive display market accounts for the second-largest market share due to technological advancements, increasing educational investments, and growing demand for interactive communication tools. Further, the German interactive display market held the largest market share, and the UK interactive display market was the fastest-growing market in the European region.


The Asia-Pacific interactive display market is expected to grow at the fastest CAGR from 2023 to 2032. This is due to increasing high disposable income, which allows consumers to invest in cutting-edge technology with advanced features, contributing to market revenue growth in this region. Moreover, China’s interactive display market held the largest market share, and the Indian interactive display market was the fastest-growing market in the Asia-Pacific region.


Interactive Display Key Market Players & Competitive Insights


Leading market players are investing heavily in research and development to expand their product lines, which will help the interactive display market grow even more. Market participants are also undertaking various strategic activities to expand their footprint, with significant market developments including new product launches, contractual agreements, mergers and acquisitions, higher investments, and collaboration with other organizations. To expand and survive in a more competitive and rising market climate, the interactive display industry must offer cost-effective items.


Manufacturing locally to minimize operational costs is one of the key business tactics manufacturers use in the interactive display industry to benefit clients and increase the market sector. Major players in the interactive display market include LG Electronics. (South Korea), Sharp Business Systems (India) Private Limited. (India), Leyard (China), SAMSUNG (South Korea), NEC Display Solutions (Japan), and others are attempting to increase market demand by investing in research and development operations.


Amazon.com Inc (Amazon) is an online retailer and web service provider. The company provides apparel, auto and industrial items, beauty and health products, electronics, grocery, games, jewelry, kids and baby products, music, sports goods, toys, and tools. It also offers related support services, including home delivery and shipping, cloud web hosting, and other web-related services. Amazon merchandises these products through company-owned online and physical platforms. It also manufactures and commercializes various electric devices such as Kindle e-readers, fire tablets, fire TVs, Echo, Alexa, and other devices. In September 2021, Amazon unveiled Amazon Glow, a new interactive device geared for families that allow kids to convey with distant relatives and other loved ones via video calls. Amazon Glow contests with Facebook's series of Portal gadgets, primarily designed to bring families together over video. To give the appearance of an in-person experience, it also utilizes technology to develop an interaction that delivers a surface for virtual activities like games, painting, puzzles, and more.


ViewSonic Corporation is a Taiwanese-American privately held multinational electronics company headquartered in Brea, California, US, and a research & development center in New Taipei City, Taiwan. The firm was founded in 1987 as Keypoint Technology Corporation and was renamed its current name in 1993 after a brand name for monitors was launched in 1990. Today, ViewSonic specializes in visual display hardware, including liquid-crystal displays, projectors, interactive whiteboards, and digital whiteboarding software. In July 2022, ViewSonic Corporation, an American-Taiwanese multinational electronics firm, announced the launch of its new interactive displays in India for the tech industry. ViewBoard 52 Series is available in 65-inch, 75-inch, and 86-inch size configurations, all of which come with an embedded multimedia soundbar.


Key Companies in the Interactive Display market include


  • LG Electronics. (South Korea)


  • Sharp Business Systems (India) Private Limited. (India)


  • Leyard (China)


  • SAMSUNG (South Korea)


  • NEC Display Solutions (Japan)


  • Panasonic Corporation of North America (US)


  • Elo Touch Solutions, Inc. (US)


  • Crystal Display Systems Ltd (UK)


  • HORIZON DISPLAY INC. (US)


  • ViewSonic Corporation (US)


  • GestureTek technologies (US)


Interactive Display Industry Developments


June 2022: Boxlight Corporation, a top supplier of digital signage, interactive technology, and classroom audio, declared the release of its recent type of interactive display, the MimioPro 4. With features and tools to enhance learning, increase communication & collaboration, and assist hybrid and distant learning, the MimioPro 4 interactive display is made to help educators in making the most of their educational technology ecosystem.


March 2020: NEC Corporation and Sharp Corporation agreed to a joint venture by combining NEC Display Solutions, Ltd., a subsidiary of NEC, with Sharp. This joint venture will permit both firms to build upon their strengths and address the visualization requirements of their customers.


Interactive Display Market Segmentation:


Interactive Display Product Outlook


  • Kiosk


  • Whiteboard


  • Table


  • Video Wall


  • Monitor


Interactive Display Panel Size Outlook


  • 17” to 32”


  • 32” to 65”


  • 65” & Above


Interactive Display End User Outlook


  • Education


  • BFSI


  • Retail


  • Sports & Events


  • Entertainment


  • Healthcare


  • Others


Interactive Display Regional Outlook


  • North America


    • US


    • Canada


  • Europe


    • Germany


    • France


    • UK


    • Italy


    • Spain


    • Rest of Europe


  • Asia-Pacific


    • China


    • Japan


    • India


    • Australia


    • South Korea


    • Australia


    • Rest of Asia-Pacific


  • Rest of the World


    • Middle East


    • Africa


    • Latin America


Report Scope:

Report Attribute/Metric Details
Market Size 2022 USD 9.5 Billion
Market Size 2023 USD 10.13 Billion
Market Size 2032 USD 16.97 Billion
Compound Annual Growth Rate (CAGR) 6.66% (2023-2032)
Base Year 2022
Market Forecast Period 2023-2032
Historical Data 2018- 2022
Market Forecast Units Value (USD Billion)
Report Coverage Revenue Forecast, Market Competitive Landscape, Growth Factors, and Trends
Segments Covered Product, Panel Size, End User, and Region
Geographies Covered North America, Europe, Asia Pacific, and the Rest of the World
Countries Covered The US, Canada, German, France, UK, Italy, Spain, China, Japan, India, Australia, South Korea, and Brazil
Key Companies Profiled LG Electronics. (South Korea), Sharp Business Systems (India) Private Limited. (India), Leyard (China), SAMSUNG (South Korea), NEC Display Solutions (Japan), Panasonic Corporation of North America (US), Elo Touch Solutions, Inc. (US), and Crystal Display Systems Ltd (UK)
Key Market Opportunities Increasing adoption of interactive learning solutions
Key Market Dynamics Rise in the adoption of interactive displays


Frequently Asked Questions (FAQ) :

The interactive display market size was valued at USD 9.5 Billion in 2022.

The market is projected to grow at a CAGR of 6.66% during the forecast period, 2023-2032.

The key players in the market are LG Electronics. (South Korea), Sharp Business Systems (India) Private Limited. (India), Leyard (China), SAMSUNG (South Korea), NEC Display Solutions (Japan), Panasonic Corporation of North America (US), Elo Touch Solutions, Inc. (US), and Crystal Display Systems Ltd (UK).

The kiosk category dominated the market in 2022.

The 32” to 65” had the largest share in the market.

Key Questions Answered

  • Global Market Outlook
  • In-depth analysis of global and regional trends
  • Analyze and identify the major players in the market, their market share, key developments, etc.
  • To understand the capability of the major players based on products offered, financials, and strategies.
  • Identify disrupting products, companies, and trends.
  • To identify opportunities in the market.
  • Analyze the key challenges in the market.
  • Analyze the regional penetration of players, products, and services in the market.
  • Comparison of major players’ financial performance.
  • Evaluate strategies adopted by major players.
  • Recommendations
Request Free Sample

Why Choose Market Research Future?

  • Vigorous research methodologies for specific market.
  • Knowledge partners across the globe
  • Large network of partner consultants.
  • Ever-increasing/ Escalating data base with quarterly monitoring of various markets
  • Trusted by fortune 500 companies/startups/universities/organizations
  • Large database of 5000+ markets reports.
  • Effective and prompt pre- and post-sales support.
Speak to Analyst
Leading companies partner with us for data-driven Insights.
Client logo Client logo Client logo Client logo Client logo Client logo Client logo Client logo Client logo Client logo

Kindly complete the form below to receive a free sample of this Report

Please fill in Business Email for Quick Response
Invalid