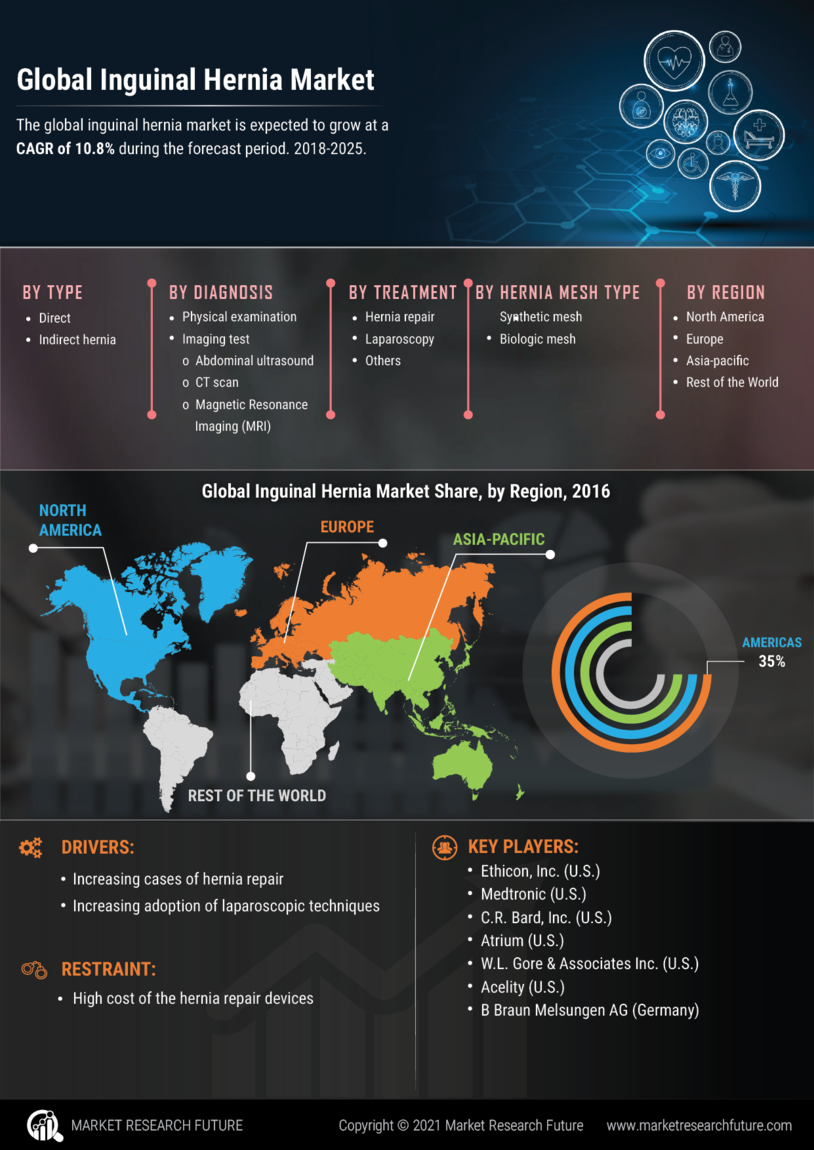
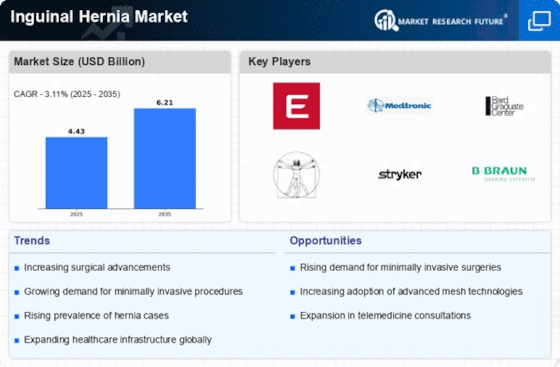
Market Synopsis of the Global Inguinal Hernia Market Inguinal hernia results when a part of small intestine bulges out through a weak area in the lower abdominal wall. Two types of inguinal hernia are known- direct and indirect inguinal hernia. Direct inguinal hernia occurs in males resulting into the weakening of the abdominal muscles around the inguinal canal. Whereas, indirect inguinal hernia is caused by the defects in the abdominal wall present at the birth. The prevalence of inguinal hernia is found to high in males, which is attributed to stress and increasing age.
The market for inguinal hernia is expected to show a healthy growth owing to increasing cases of hernia repair and increasing adoption of laparoscopic techniques across the globe. Furthermore, increasing number of hernia repair surgeries also contributes to the progress of the market. Therefore, demand for hernia repair devices is found to be increasing. On the other hand, High cost of the hernia repair devices may act as a restrain for the market growth.
The global inguinal hernia market is expected to grow at a CAGR of 10.8% during the forecast period.
Source: World Health Organization, Centers for Disease Control and Prevention, European Society of Clinical Microbiology and Infectious Diseases, U.S. National Library of Medicine, National Organization for Rare Disorders, The American Autoimmune Related Diseases Association, The International Society for Human and Animal Mycology, Expert Interview Market Research Future Analysis, Annual report, White paper, Company Presentation
Segments The global inguinal hernia market is segmented on the basis of type, diagnosis, treatment, and hernia mesh type.
On the basis of types, the market is segmented into direct and indirect hernia.
On the basis of diagnosis, the market is segmented into physical examination and imaging test. Imaging tests is further segmented into abdominal ultrasound, CT scan, and Magnetic Resonance Imaging (MRI).
On the basis of treatment, the market is segmented into open hernia repair, laparoscopy, and others.
On the basis of hernia mesh type, the market is segmented into synthetic mesh, and biologic mesh.
Research Methodology
Source: World Health Organization, Centers for Disease Control and Prevention, European Society of Clinical Microbiology and Infectious Diseases, U.S. National Library of Medicine, National Organization for Rare Disorders, The American Autoimmune Related Diseases Association, The International Society for Human and Animal Mycology, Expert Interview Market Research Future Analysis, Annual report, White paper, Company Presentation
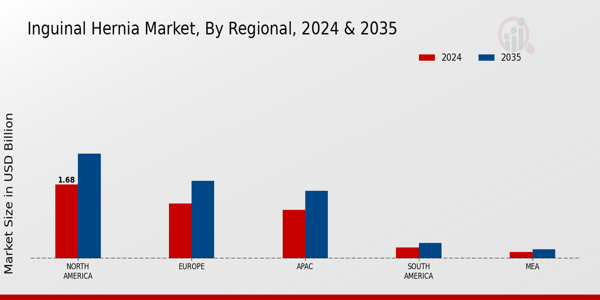
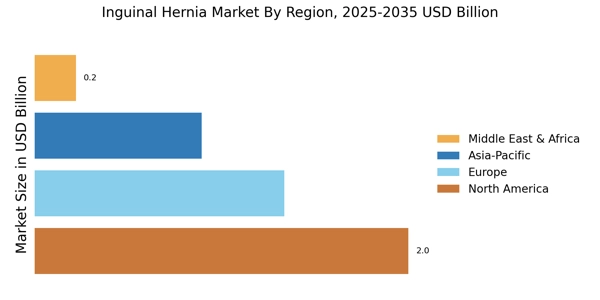
Regional Analysis of the Global Inguinal Hernia Market America is the largest market for inguinal hernia owing to rising prevalence of inguinal hernia in the U.S. and increasing number of surgical procedures such as groin hernia repair. According to the article published in PLOS, in the U.S., groin hernia repair is commonly performed in both adults and children with inguinal hernias constituting more than 95% of all groin hernia repairs.
Europe is the second largest market owing an increase in the prevalence of inguinal hernia and extensive demand for hernia repair devices. The U.K is expected to be the largest market in Europe. According to the New England Journal of Medicine, more than 90,000 surgical intervention for inguinal hernia were performed in Europe.
In Asia Pacific, the demand for laparoscopic procedures for inguinal hernia is increasing and China is expected to be the largest market in Asia Pacific followed by Japan and India. According to the Asia Pacific hernia society, extrapolated incidence of hernia in India is 1,957,850.
The Middle East & Africa also shows a steady rise in the market owing to extensive use of hernia mesh devices for surgeries in the Middle East. In the Middle East, Iran is expected to be the largest market followed by Saudi Arabia. In Africa, high cost of hernia repair restrained the market growth. In the past, laparoscopy was rarely performed for hernia repair in Africa.
Intended Audience
Frequently Asked Questions (FAQ) :
The Inguinal Hernia Market CAGR would be 10.8% during the forecast period of 2017 to 2023.
Inguinal Hernia Market players are Medtronic (U.S.), Ethicon, Inc. (U.S.), Atrium (U.S.), C.R. Bard, Inc. (U.S.), Acelity (U.S.), W.L. Gore & Associates Inc. (U.S.), and B Braun Melsungen AG (Germany).
The hernia mesh types included in the report are synthetic mesh and biologic mesh.
The types are open hernia repair, laparoscopy, and others.
The types included in the report physical examination and imaging test.
Table Of Contents
1 Report Prologue
2 Market Introduction
2.1 Definition
2.2 Scope Of The Study
2.2.1 Research Objective
2.2.2 Assumptions
2.2.3 Limitations
2.3 Market Structure
3 Research Methodology
3.1 Research Process
3.2 Primary Research
3.3 Secondary Research
3.4 Market Size Estimation
3.5 Forecast Model
4 Market Dynamics
4.1 Drivers
4.2 Restraints
4.3 Opportunities
4.4 Mega Trends
4.5 Macroeconomic Indicators
5 Market Factor Analysis
5.1 Value/Supply Chain Analysis
5.2 Porter's 5 Forces Analysis
5.3 Pricing Analysis
5.4 Investment Opportunity Analysis
6 Global Inguinal Hernia Market, By Type (USD Million)
6.1 Introduction
6.2 Market Size By Type
6.2.1 Direct
6.2.2 Indirect
7 Global Inguinal Hernia Market, By Diagnosis (USD Million)
7.1 Introduction
7.2 Market Size By Diagnosis
7.2.1 Physical Examination
7.2.2 Imaging Tests
7.2.3 Abdominal Ultrasound
7.2.4 CT Scan
7.2.5 Magnetic Resonance Imaging (MRI)
8 Global Inguinal Hernia Market, By Treatment (USD Million)
8.1 Introduction
8.2 Market Size By Treatment
8.2.1 Open Hernia Repair
8.2.2 Laparoscopy
8.2.3 Others
9 Global Inguinal Hernia Market, By Hernia Mesh Type (USD Million)
9.1 Introduction
9.2 Market Size By Hernia Mesh Type
9.2.1 Synthetic Mesh
9.2.2 Biological Mesh
10 Global Inguinal Hernia Market, By Region (USD Million)
10.1 Introduction
10.2 Market Size By Region
10.3 Market Size By Region
10.3.1 Americas
10.3.1.1 North America
10.3.1.1.1 U.S.
10.3.1.1.2 Canada
10.3.1.2 South America
10.3.2 Europe
10.3.2.1 Western Europe
10.3.2.1.1 Germany
10.3.2.1.2 France
10.3.2.1.3 Italy
10.3.2.1.4 Spain
10.3.2.1.5 UK
10.3.2.2 Rest Of Europe
10.3.3 Asia Pacific
10.3.3.1 Asia
10.3.3.1.1 Japan
10.3.3.1.2 China
10.3.3.1.3 India
10.3.3.1.4 Australia
10.3.3.1.5 Republic Of Korea
10.3.3.2 Rest Of Asia Pacific
10.3.4 Middle East & Africa
11 Company Landscape
11.1 Introduction: Key Players
11.2 Market Share Analysis
11.3 Key Development & Strategies
12 Company Profiles
12.1 Ethicon, Inc.
12.1.1 Company Overview
12.1.2 Product/Business Segment Overview
12.1.3 Financials
12.1.4 Key Developments
12.1.5 SWOT Analysis
12.2 Medtronic
12.2.1 Overview
12.2.2 Product/Business Segment Overview
12.2.3 Financials
12.2.4 Key Developments
12.2.5 SWOT Analysis
12.3 C.R. Bard, Inc.
12.3.1 Overview
12.3.2 Product/Business Segment Overview
12.3.3 Financials
12.3.4 Key Developments
12.3.5 SWOT Analysis
12.4 Atrium
12.4.1 Overview
12.4.2 Product/Business Segment Overview
12.4.3 Financials
12.4.4 Key Developments
12.4.5 SWOT Analysis
12.5 W.L. Gore & Associates Inc.
12.5.1 Overview
12.5.2 Product/Business Segment Overview
12.5.3 Financials
12.5.4 Key Developments
12.5.5 SWOT Analysis
12.6 B Braun Melsungen AG
12.6.1 Overview
12.6.2 Product/Business Segment Overview
12.6.3 Financials
12.6.4 Key Developments
12.6.5 SWOT Analysis
12.7 Others
13 MRFR Conclusion
13.1 Key Findings
13.1.1 From CEO’s Viewpoint
13.1.2 Unmet Needs Of The Market
13.2 Key Companies To Watch
13.3 Prediction Of Inguinal Hernia Industry
14 Appendix
List Of Tables
TABLE 1 GLOBAL INGUINAL HERNIA MARKET, BY TYPE, 2020-2027 (USD MILLION)
TABLE 2 DIRECT FOR INGUINAL HERNIA MARKET, BY REGION, 2020-2027 (USD MILLION)
TABLE 3 INDIRECT FOR INGUINAL HERNIA MARKET, BY REGION 2020-2027 (USD MILLION)
TABLE 4 GLOBAL INGUINAL HERNIA MARKET, BY DIAGNOSIS, 2020-2027 (USD MILLION)
TABLE 5 PHYSICAL EXAMINATION DIAGNOSIS FOR INGUINAL HERNIA MARKET, BY REGION 2020-2027 (USD MILLION)
TABLE 6 IMAGING TESTS DIAGNOSIS FOR INGUINAL HERNIA MARKET, BY REGION 2020-2027 (USD MILLION)
TABLE 7 GLOBAL INGUINAL HERNIA MARKET, BY TREATMENT, 2020-2027 (USD MILLION) TABLE
TABLE 8 OPEN HERNAI REPAIR FOR INGUINAL HERNIA MARKET, BY REGION 2020-2027 (USD MILLION)
TABLE 9 LAPROSCOPY FOR INGUINAL HERNIA MARKET, BY REGION 2020-2027 (USD MILLION)
TABLE 10 GLOBAL INGUINAL HERNIA MARKET, BY HERNIA MESH TYPE, 2020-2027 (USD MILLION)
TABLE 11 SYNTHETIC MESH FOR INGUINAL HERNIA MARKET, BY REGION 2020-2027 (USD MILLION)
TABLE 12 BIOLOGICAL MESH FOR INGUINAL HERNIA MARKET, BY REGION 2020-2027 (USD MILLION)
TABLE 13 GLOBAL INGUINAL HERNIA MARKET, BY REGION 2020-2027 (USD MILLION)
TABLE 14 NORTH AMERICA INGUINAL HERNIA MARKET, BY COUNTRY 2020-2027 (USD MILLION)
TABLE 15 NORTH AMERICA INGUINAL HERNIA MARKET, BY TYPE 2020-2027 (USD MILLION)
TABLE 16 NORTH AMERICA INGUINAL HERNIA MARKET, BY DIAGNOSIS 2020-2027 (USD MILLION)
TABLE 17 NORTH AMERICA INGUINAL HERNIA MARKET, BY TREATMENT, 2020-2027 (USD MILLION) TABLE
TABLE 18 NORTH AMERICA INGUINAL HERNIA MARKET, BY HERNIA MESH TYPE, 2020-2027 (USD MILLION)
TABLE 19 NORTH AMERICA INGUINAL HERNIA MARKET, BY DIAGNOSIS, 2020-2027 (USD MILLION)
TABLE 20 NORTH AMERICA INGUINAL HERNIA MARKET BY REGION 2020-2027 (USD MILLION
TABLE 21 EUROPE INGUINAL HERNIA MARKET BY COUNTRY 2020-2027 (USD MILLION)
TABLE 22 EUROPE INGUINAL HERNIA MARKET, BYTYPE 2020-2027 (USD MILLION)
TABLE 23 EUROPE BIOLOGICAL THERAPY MARKET, BY DIAGNOSIS 2020-2027 (USD MILLION)
TABLE 24 EUROPE INGUINAL HERNIA MARKET, BY TREATMENT, 2020-2027 (USD MILLION) TABLE
TABLE 25 EUROPE INGUINAL HERNIA MARKET, BY HERNIA MESH TYPE, 2020-2027 (USD MILLION)
TABLE 26 EUROPE INGUINAL HERNIA MARKET, BY DIAGNOSIS, 2020-2027 (USD MILLION)
TABLE 27 EUROPE INGUINAL HERNIA MARKET, BY REGION 2020-2027 (USD MILLION)
TABLE 28 ASIA PACIFIC INGUINAL HERNIA MARKET, BY COUNTRY 2020-2027 (USD MILLION)
TABLE 29 ASIA PACIFIC INGUINAL HERNIA MARKET, BYTYPE 2020-2027 (USD MILLION)
TABLE 30 ASIA PACIFIC INGUINAL HERNIA MARKET, BY DIAGNOSIS 2020-2027 (USD MILLION)
TABLE 31 ASIA PACIFIC INGUINAL HERNIA MARKET, BY TREATMENT, 2020-2027 (USD MILLION) TABLE
TABLE 32 ASIA PACIFIC INGUINAL HERNIA MARKET, BY HERNIA MESH TYPE, 2020-2027 (USD MILLION)
TABLE 33 ASIA PACIFIC INGUINAL HERNIA MARKET, BY DIAGNOSIS, 2020-2027 (USD MILLION)
TABLE 34 ASIA PACIFIC INGUINAL HERNIA MARKET, BY REGION 2020-2027 (USD MILLION)
TABLE 35 MIDDLE EAST & AFRICA INGUINAL HERNIA MARKET, BY REGION 2020-2027 (USD MILLION)
TABLE 36 MIDDLE EAST & AFRICA INGUINAL HERNIA MARKET, BYTYPE 2020-2027 (USD MILLION)
TABLE 37 MIDDLE EAST & AFRICA INGUINAL HERNIA MARKET, BY DIAGNOSIS 2020-2027 (USD MILLION)
TABLE 38 MIDDLE EAST & AFRICA INGUINAL HERNIA MARKET, BY TREATMENT, 2020-2027 (USD MILLION) TABLE
TABLE 39 MIDDLE EAST & AFRICA INGUINAL HERNIA MARKET, BY HERNIA MESH TYPE, 2020-2027 (USD MILLION)
TABLE 40 MIDDLE EAST & AFRICA INGUINAL HERNIA MARKET, BY DIAGNOSIS, 2020-2027 (USD MILLION)
TABLE 41 MIDDLE EAST & AFRICA INGUINAL HERNIA MARKET, BY REGION 2020-2027 (USD MILLION)
List Of Figures
FIGURE 1 RESEARCH PROCESS
FIGURE 2 MARKET DYNAMICS FOR GLOBAL INGUINAL HERNIA MARKET
FIGURE 3 GLOBAL ENEME BASED PRODUCTS MAKRET, BY SEGMENT, 2020
FIGURE 4 GLOBAL INGUINAL HERNIA SUCCESS MARKET, BY REGION
FIGURE 5 GLOBAL INGUINAL HERNIA MARKET SHARE, BYTYPE 2020
FIGURE 6 GLOBAL INGUINAL HERNIA MARKET SHARE, BY DIAGNOSIS, 2020
FIGURE 7 GLOBAL INGUINAL HERNIA MARKET SHARE, BY TREATMENT, 2020
FIGURE 8 GLOBAL INGUINAL HERNIA MARKET SHARE, BY HERNIA MESH TYPE, 2020
FIGURE 9 GLOBAL INGUINAL HERNIA MARKET SHARE, 2020
FIGURE 10 GLOBAL INGUINAL HERNIA MARKET SHARE, BY REGION, 2020
FIGURE 11 NORTH AMERICA INGUINAL HERNIA MARKET SHARE, BY COUNTRY, 2020
FIGURE 12 EUROPE INGUINAL HERNIA MARKET SHARE, BY COUNTRY, 2020
FIGURE 13 ASIA PACIFIC INGUINAL HERNIA MARKET SHARE, BY COUNTRY, 2020
FIGURE 14 MIDDLE EAST & AFRICA INGUINAL HERNIA MARKET, BY REGION, 2020
FIGURE 15 GLOBAL INGUINAL HERNIA MARKET: COMPANY SHARE ANALYSIS, 2020 (%)
FIGURE 16 ETHICON, INC. KEY FINANCIALS
FIGURE 17 ETHICON, INC.: SEGMENTAL REVENUE
FIGURE 18 ETHICON, INC.: GEOGRAPHICAL REVENUE
FIGURE 19 MEDTRONIC: KEY FINANCIALS
FIGURE 20 MEDTRONIC: SEGMENTAL REVENUE
FIGURE 21 MEDTRONIC: GEOGRAPHICAL REVENUE
FIGURE 22 C.R. BARD, INC.: KEY FINANCIALS
FIGURE 23 C.R. BARD, INC.: SEGMENTAL REVENUE
FIGURE 24 C.R. BARD, INC.: GEOGRAPHICAL REVENUE
FIGURE 25 COLOPLAST GROUP: KEY FINANCIALS
FIGURE 26 COLOPLAST GROUP: SEGMENTAL REVENUE
FIGURE 27 COLOPLAST GROUP: GEOGRAPHICAL REVENUE
FIGURE 28 W.L. GORE & ASSOCIATES INC.: FINANCIAL REVENUE
FIGURE 29 W.L. GORE & ASSOCIATES INC.: SEGMENTAL REVENUE
FIGURE 30 W.L. GORE & ASSOCIATES INC.: GEOGRPAHICAL REVENUE
FIGURE 31 B BRAUN MELSUNGEN AG: FINANCIAL REVENUE
FIGURE 32 B BRAUN MELSUNGEN AG: SEGMENTAL REVENUE
FIGURE 33 B BRAUN MELSUNGEN AG: GEOGRPAHICAL REVENUE