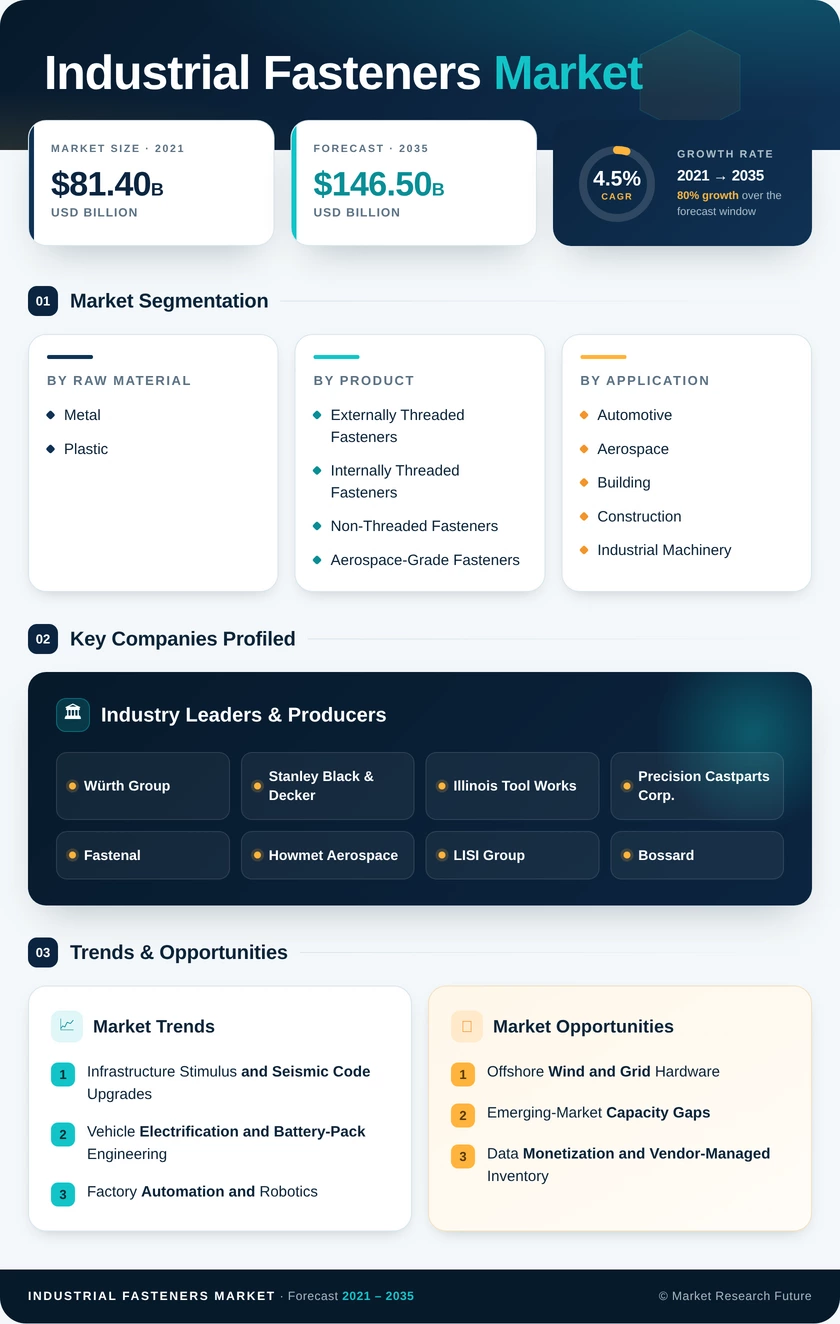
Industrial Fasteners Market (2026 - 2035)

ID: MRFR/PCM/10435-HCR 128 Pages Priya Nagrale Last Updated: October 27, 2026
Industrial Fasteners Market Research Report Information By Raw Material (Metal and Plastic), By Product (Externally Threaded Fasteners, Internally Threaded Fasteners, Non-Threaded Fasteners, and Aerospace-Grade Fasteners), By Application (Automotive, Aerospace, Building and Construction, Industrial Machinery and Robotics, Home Appliances, Plumbing and HVAC, and Other Applications), By Sales Channel (OEM and Aftermarket/MRO), And By Region (North America, Europe, Asia-Pacific, and Rest of the World) – Market Forecast Till 2035.
Industrial Fasteners Market
Market Size
Forecast Period2026-2035
CAGR (2026-2035)4.5%
2025 Market SizeUSD 94.6 Billion
2035 Market SizeUSD 146.5 Billion
Key Players
Würth Group
Stanley Black & Decker
Illinois Tool Works
Precision Castparts Corp.
Fastenal
Howmet Aerospace
Opportunities
  • Offshore Wind and Grid Hardware
  • Emerging-Market Capacity Gaps
  • Data Monetization and Vendor-Managed Inventory
  1. 1 Market Summary | |
  2. 2 Key Report Takeaways | |
    1. 2.1 By Raw Material | |
    2. 2.2 By Product | |
    3. 2.3 By Application | |
    4. 2.4 By Sales Channel | |
    5. 2.5 By Region | |
  3. 3 Market Size and Forecast (2021–2035) | |
  4. 4 Driver Impact Analysis | |
    1. 4.1 Infrastructure Stimulus and Seismic Code Upgrades | |
    2. 4.2 Vehicle Electrification and Battery-Pack Engineering | |
    3. 4.3 Factory Automation and Robotics | |
    4. 4.4 Wind and Grid Buildout | |
    5. 4.5 Commercial Aerospace Backlog | |
    6. 4.6 Manufacturing Reshoring and Nearshoring | |
  5. 5 Restraints Impact Analysis | |
    1. 5.1 Raw-Material Price Volatility | |
    2. 5.2 Part-Count Reduction Through Lightweighting and Large Castings | |
    3. 5.3 Trade Barriers and Carbon Border Measures | |
    4. 5.4 Certification Overhead and Specialty-Alloy Supply | |
    5. 5.5 Counterfeit and Substandard Imports | |
  6. 6 Opportunities | |
    1. 6.1 Offshore Wind and Grid Hardware | |
    2. 6.2 Emerging-Market Capacity Gaps | |
    3. 6.3 Data Monetization and Vendor-Managed Inventory | |
    4. 6.4 Micro-Fasteners for Medical and Electronics | |
    5. 6.5 Low-Carbon Steel Products | |
  7. 7 Regional Market Share and Country-Level Analysis | |
    1. 7.1 North America | | |
      1. 7.1.1 United States | | |
      2. 7.1.2 Canada | | |
      3. 7.1.3 Mexico | |
    2. 7.2 Europe | | |
      1. 7.2.1 Germany | | |
      2. 7.2.2 UK | | |
      3. 7.2.3 France | | |
      4. 7.2.4 Italy | | |
      5. 7.2.5 Spain | | |
      6. 7.2.6 Nordic Countries | | |
      7. 7.2.7 Russia | | |
      8. 7.2.8 Rest of Europe | |
    3. 7.3 Asia-Pacific | | |
      1. 7.3.1 China | | |
      2. 7.3.2 India | | |
      3. 7.3.3 Japan | | |
      4. 7.3.4 South Korea | | |
      5. 7.3.5 ASEAN | | |
      6. 7.3.6 Rest of Asia-Pacific | |
    4. 7.4 South America | | |
      1. 7.4.1 Brazil | | |
      2. 7.4.2 Argentina | | |
      3. 7.4.3 Rest of South America | |
    5. 7.5 Middle East & Africa | | |
      1. 7.5.1 Saudi Arabia | | |
      2. 7.5.2 UAE | | |
      3. 7.5.3 South Africa | | |
      4. 7.5.4 Egypt | | |
      5. 7.5.5 Rest of MEA | |
  8. 8 Future Outlook (2026–2035) | |
    1. 8.1 Sensor-Enabled Joints and Automated Assembly | |
    2. 8.2 Platform Economics in Distribution | |
    3. 8.3 Electrification Supercycle | |
    4. 8.4 Decarbonization and Product Carbon Footprints | |
  9. 9 Segmentation Analysis | |
    1. 9.1 By Raw Material | | |
      1. 9.1.1 Metal | | |
      2. 9.1.2 Plastic | |
    2. 9.2 By Product | | |
      1. 9.2.1 Externally Threaded Fasteners | | |
      2. 9.2.2 Internally Threaded Fasteners | | |
      3. 9.2.3 Non-Threaded Fasteners | | |
      4. 9.2.4 Aerospace-Grade Fasteners | |
    3. 9.3 By Application | | |
      1. 9.3.1 Automotive | | |
      2. 9.3.2 Aerospace | | |
      3. 9.3.3 Building and Construction | | |
      4. 9.3.4 Industrial Machinery and Robotics | | |
      5. 9.3.5 Home Appliances | | |
      6. 9.3.6 Plumbing and HVAC | | |
      7. 9.3.7 Other Applications | |
    4. 9.4 By Sales Channel | | |
      1. 9.4.1 OEM | | |
      2. 9.4.2 Aftermarket/MRO | |
  10. 10 Competitive Landscape | |
    1. 10.1 Market Concentration Analysis | |
    2. 10.2 Competitive Benchmarking Matrix | |
    3. 10.3 Company Profiles | | |
      1. 10.3.1 Würth Group | | |
      2. 10.3.2 Stanley Black & Decker | | |
      3. 10.3.3 Illinois Tool Works | | |
      4. 10.3.4 Precision Castparts Corp. | | |
      5. 10.3.5 Fastenal | | |
      6. 10.3.6 Howmet Aerospace | | |
      7. 10.3.7 LISI Group | | |
      8. 10.3.8 Bossard | | |
      9. 10.3.9 Sundram Fasteners | | |
      10. 10.3.10 ATI | | |
      11. 10.3.11 Layana | |
  11. 11 Recent News & Developments | |
  12. 12 Report Scope and Methodology | |
  13. 13 Detailed Sources and Citations | |
  14. 14 Frequently Asked Questions (FAQs) | | LIST OF TABLES | |
  15. TABLE 1 Global Market Snapshot, 2025–2035 | |
  16. TABLE 2 Global Market Size & Forecast, by Revenue (USD Billion), 2021–2035 | |
  17. TABLE 3 Driver Impact Analysis | |
  18. TABLE 4 Restraints Impact Analysis | |
  19. TABLE 5 Regional Summary, 2025 | |
  20. TABLE 6 North America Market, by Country, 2025 | |
  21. TABLE 7 Europe Market, by Country, 2025 | |
  22. TABLE 8 Asia-Pacific Market, by Country, 2025 | |
  23. TABLE 9 South America Market, by Country, 2025 | |
  24. TABLE 10 Middle East & Africa Market, by Country, 2025 | |
  25. TABLE 11 Global Market, by Raw Material | |
  26. TABLE 12 Global Market, by Product | |
  27. TABLE 13 Global Market, by Application | |
  28. TABLE 14 Global Market, by Sales Channel | |
  29. TABLE 15 Competitive Benchmarking Matrix | |
  30. TABLE 16 Report Scope and Methodology | |
  31. TABLE 17 Detailed Sources and Citations | | LIST OF FIGURES | |
  32. FIGURE 1 Market Dynamics Overview (Drivers, Restraints, Opportunities) | |
  33. FIGURE 2 Industry Value Chain Analysis | |
  34. FIGURE 3 Porter's Five Forces Analysis | |
  35. FIGURE 4 Global Market Size Trend, 2021–2035 (USD Billion) | |
  36. FIGURE 5 Market Share, by Raw Material, 2025 | |
  37. FIGURE 6 Market Share, by Product, 2025 | |
  38. FIGURE 7 Market Share, by Application, 2025 | |
  39. FIGURE 8 Market Share, by Sales Channel, 2025 | |
  40. FIGURE 9 Regional Market Share, 2025 | |
  41. FIGURE 10 Country-Level Share within Each Region, 2025 | |
  42. FIGURE 11 Competitive Positioning Matrix | |
  43. FIGURE 12 Estimated Revenue Share of Leading Players, 2025

Segmentation Quick Reference

DimensionSub-SegmentsDominant SegmentFastest Growing Segment
By Raw MaterialMetal; PlasticMetal (4.9% CAGR)Metal (4.9% CAGR)
By ProductExternally Threaded Fasteners; Internally Threaded Fasteners; Non-Threaded Fasteners; Aerospace-Grade FastenersExternally Threaded Fasteners (50.6% share)Aerospace-Grade Fasteners (5.4% CAGR)
By ApplicationAutomotive; Aerospace; Building and Construction; Industrial Machinery and Robotics; Home Appliances; Plumbing and HVAC; Other ApplicationsAutomotive (35.8% share)Industrial Machinery and Robotics (6.0% CAGR)
By Sales ChannelOEM; Aftermarket/MROOEM (74.1% share)Aftermarket/MRO (5.1% CAGR)
By RegionNorth America; Europe; Asia-Pacific; South America; Middle East & AfricaAsia-Pacific (44.8% share)Middle East & Africa (5.4% CAGR)

Market Segmentation Overview

By Raw Material

Sub-SegmentKey Trend
MetalAlloy and stainless grades gain in seismic, offshore and EV applications
PlasticReinforced nylon and polycarbonate replace metal in low-load clips and snap-fits

Metal leads and also grows fastest at a 4.9% CAGR, because pretensioned structural joints, offshore monopiles and battery enclosures all require steel or titanium strength that polymers cannot match. Plastic holds a 10.2% share, confined to appliance housings, interior trim and cable routing where WEEE disassembly rules and weight savings outweigh load capacity.

By Product

Sub-SegmentKey Trend
Externally Threaded FastenersHigher-grade structural assemblies under updated seismic codes
Internally Threaded FastenersPrevailing-torque locking designs for vibration-prone joints
Non-Threaded FastenersBlind rivets and pins for one-sided assembly
Aerospace-Grade FastenersTitanium and super-alloy demand tied to aircraft build rates

Externally Threaded Fasteners dominate with a 50.6% share, carried by structural steel, chassis and machine-frame demand specified under ASTM F3125. Aerospace-Grade Fasteners grow fastest at a 5.4% CAGR, since airframe backlogs and AS9100 qualification barriers give certified titanium and super-alloy producers both volume and pricing power. Internally Threaded Fasteners and Non-Threaded Fasteners remain steady, serving vibration-critical and blind-access joints.

By Application

Sub-SegmentKey Trend
AutomotiveShift from engine hardware to battery-pack and thermal-management parts
AerospaceDelivery ramp-ups lift titanium and super-alloy demand
Building and ConstructionSeismic and wind-load codes raise strength requirements
Industrial Machinery and RoboticsMicro-scale, traceable parts for automation
Home AppliancesSnap-fit and thread-forming designs for tool-free disassembly
Plumbing and HVACHeat-pump growth and dezincification-resistant brass
Other ApplicationsCoated alloy-steel parts for mining, rail and agriculture

Automotive leads with a 35.8% share, though its purchases are moving from engine and transmission hardware toward battery enclosures and power electronics. Industrial Machinery and Robotics grows fastest at a 6.0% CAGR as collaborative robots and medical device lines demand sub-2 mm, fully traceable parts. Building and Construction stays the second pillar, supported by seismic code upgrades and public infrastructure funding.

By Sales Channel

Sub-SegmentKey Trend
OEMMulti-year contracts bundling kitting and consignment stock
Aftermarket/MROReplacement and re-tensioning across ageing assets

OEM supply dominates with a 74.1% share because automakers, airframers and machinery builders lock in supply through long contracts that include engineering and inventory services. Aftermarket/MRO grows faster at a 5.1% CAGR as bridges, plants and wind fleets age, and distributors with vending and bin-stock programs capture most of that higher-margin maintenance spend.


Download PDF ×

We do not share your information with anyone. However, we may send you emails based on your report interest from time to time. You may contact us at any time to opt-out.