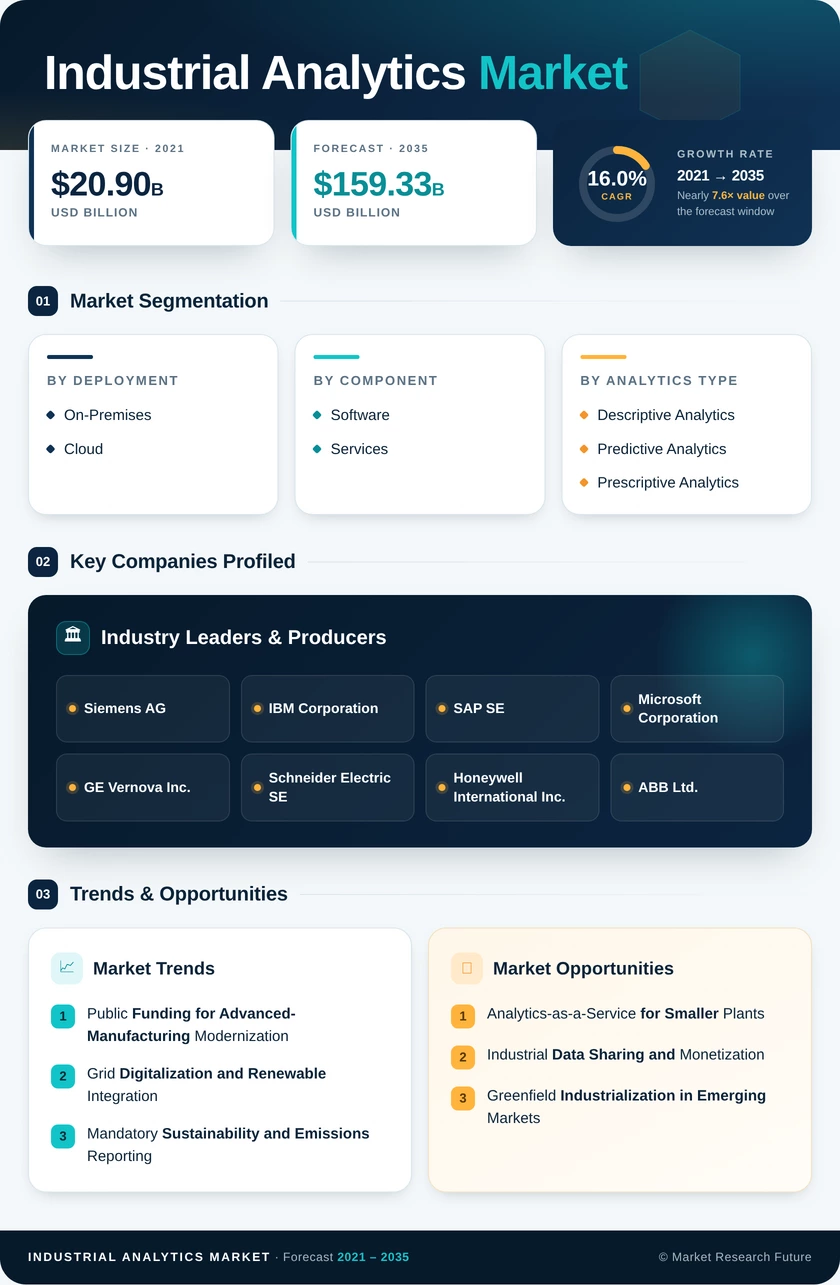
Industrial Analytics Market (2026 - 2035)

ID: MRFR/ICT/3114-HCR 100 Pages Apoorva Priyadarshi Last Updated: October 23, 2026
Industrial Analytics Market Size, Share and Trends Analysis Report By Deployment Type (On-Premises, Cloud-Based, Hybrid), By Application (Predictive Maintenance, Supply Chain Management, Quality Control, Production Optimization), By Component (Software, Hardware, Services), By End Use Industry (Manufacturing, Energy and Utilities, Healthcare, Transportation, Retail) and By Regional (North America, Europe, South America, Asia Pacific, Middle East and Africa) - Forecast to 2035.
Industrial Analytics Market
Market Size
Forecast Period2026-2035
CAGR (2026-2035)16.0%
2025 Market SizeUSD 36.00 Billion
2035 Market SizeUSD 159.33 Billion
Key Players
Siemens AG
IBM Corporation
SAP SE
Microsoft Corporation
GE Vernova Inc.
Schneider Electric SE
Opportunities
  • Analytics-as-a-Service for Smaller Plants
  • Industrial Data Sharing and Monetization
  • Greenfield Industrialization in Emerging Markets
  1. 1 Market Summary | |
  2. 2 Key Report Takeaways | |
    1. 2.1 By Deployment | |
    2. 2.2 By Component | |
    3. 2.3 By Analytics Type | |
    4. 2.4 By End-User Industry | |
    5. 2.5 By Organization Size | |
    6. 2.6 By Application | |
    7. 2.7 By Region | |
  3. 3 Market Size and Forecast (2021–2035) | |
    1. 3.1 Historical Market Size (2021–2024) | |
    2. 3.2 Base Year Market Size (2025) | |
    3. 3.3 Forecast Market Size (2026–2035) | |
    4. 3.4 Year-over-Year Growth Analysis | |
  4. 4 Driver Impact Analysis | |
    1. 4.1 Public Funding for Advanced-Manufacturing Modernization | |
    2. 4.2 Grid Digitalization and Renewable Integration | |
    3. 4.3 Mandatory Sustainability and Emissions Reporting | |
    4. 4.4 Generative AI Copilots Embedded in Industrial Software | |
    5. 4.5 Hyperscaler Consumption Pricing for Industrial Data | |
    6. 4.6 Manufacturing Workforce Gaps and Expertise Capture | |
    7. 4.7 Asia-Pacific Production-Linked Industrial Policy | |
  5. 5 Restraints Impact Analysis | |
    1. 5.1 OT Cybersecurity Exposure and Breach Costs | |
    2. 5.2 Brownfield Equipment and Data Interoperability Gaps | |
    3. 5.3 Shortage of Industrial Data Science Talent | |
    4. 5.4 Integration Costs for Smaller Manufacturers | |
    5. 5.5 Data Sovereignty and AI Compliance Obligations | |
  6. 6 Opportunities | |
    1. 6.1 Analytics-as-a-Service for Smaller Plants | |
    2. 6.2 Industrial Data Sharing and Monetization | |
    3. 6.3 Greenfield Industrialization in Emerging Markets | |
    4. 6.4 Carbon Intelligence for Border-Adjustment Exposure | |
    5. 6.5 Closed-Loop Prescriptive Control | |
  7. 7 Regional Market Share and Country-Level Analysis | |
    1. 7.1 North America | | |
      1. 7.1.1 United States | | |
      2. 7.1.2 Canada | | |
      3. 7.1.3 Mexico | |
    2. 7.2 Europe | | |
      1. 7.2.1 Germany | | |
      2. 7.2.2 United Kingdom | | |
      3. 7.2.3 France | | |
      4. 7.2.4 Russia | | |
      5. 7.2.5 Rest of Europe | |
    3. 7.3 Asia-Pacific | | |
      1. 7.3.1 China | | |
      2. 7.3.2 Japan | | |
      3. 7.3.3 India | | |
      4. 7.3.4 South Korea | | |
      5. 7.3.5 Australia | | |
      6. 7.3.6 Rest of Asia-Pacific | |
    4. 7.4 Middle East and Africa | | |
      1. 7.4.1 Middle East | | |
      2. 7.4.2 Saudi Arabia | | |
      3. 7.4.3 United Arab Emirates | | |
      4. 7.4.4 Rest of Middle East | | |
      5. 7.4.5 Africa | | |
      6. 7.4.6 South Africa | | |
      7. 7.4.7 Egypt | | |
      8. 7.4.8 Rest of Africa | |
    5. 7.5 South America | | |
      1. 7.5.1 Brazil | | |
      2. 7.5.2 Argentina | | |
      3. 7.5.3 Rest of South America | |
  8. 8 Future Outlook (2026–2035) | |
    1. 8.1 Supervised Autonomy in Plant Operations | |
    2. 8.2 Platform Ecosystems and Data-Layer Control | |
    3. 8.3 Electrification and Power-Aware Production | |
    4. 8.4 Assured Sustainability Data | |
  9. 9 Segmentation Analysis | |
    1. 9.1 By Deployment | | |
      1. 9.1.1 On-Premises | | |
      2. 9.1.2 Cloud | |
    2. 9.2 By Component | | |
      1. 9.2.1 Software | | |
      2. 9.2.2 Services | |
    3. 9.3 By Analytics Type | | |
      1. 9.3.1 Descriptive Analytics | | |
      2. 9.3.2 Predictive Analytics | | |
      3. 9.3.3 Prescriptive Analytics | |
    4. 9.4 By End-User Industry | | |
      1. 9.4.1 Manufacturing | | |
      2. 9.4.2 Construction | | |
      3. 9.4.3 Mining | | |
      4. 9.4.4 Transportation and Logistics | | |
      5. 9.4.5 Utilities | | |
      6. 9.4.6 Other End-User Industry | |
    5. 9.5 By Organization Size | | |
      1. 9.5.1 Large Enterprises | | |
      2. 9.5.2 Small and Medium-Sized Enterprises | |
    6. 9.6 By Application | | |
      1. 9.6.1 Asset Performance Management | | |
      2. 9.6.2 Quality and Process Optimization | | |
      3. 9.6.3 Supply-Chain and Inventory Analytics | | |
      4. 9.6.4 Energy Management | | |
      5. 9.6.5 Safety and Risk Analytics | |
  10. 10 Competitive Landscape | |
    1. 10.1 Market Concentration Analysis | |
    2. 10.2 Competitive Benchmarking Matrix | |
    3. 10.3 Company Profiles | | |
      1. 10.3.1 Siemens AG | | |
      2. 10.3.2 IBM Corporation | | |
      3. 10.3.3 SAP SE | | |
      4. 10.3.4 Microsoft Corporation | | |
      5. 10.3.5 GE Vernova Inc. | | |
      6. 10.3.6 Schneider Electric SE | | |
      7. 10.3.7 Honeywell International Inc. | | |
      8. 10.3.8 ABB Ltd. | | |
      9. 10.3.9 Rockwell Automation Inc. | | |
      10. 10.3.10 PTC Inc. | |
  11. 11 Recent News & Developments | |
  12. 12 Report Scope and Methodology | |
  13. 13 Detailed Sources and Citations | |
  14. 14 Frequently Asked Questions (FAQs) | | LIST OF TABLES | |
  15. TABLE 1 Market Snapshot, 2025 and 2035 | |
  16. TABLE 2 Global Market Size & Forecast, by Revenue (USD Billion), 2021–2035 | |
  17. TABLE 3 Driver Impact Analysis | |
  18. TABLE 4 Restraints Impact Analysis | |
  19. TABLE 5 Regional Market Summary, 2025 | |
  20. TABLE 6 North America Market, by Country, 2025 | |
  21. TABLE 7 Europe Market, by Country, 2025 | |
  22. TABLE 8 Asia-Pacific Market, by Country, 2025 | |
  23. TABLE 9 Middle East and Africa Market, by Country, 2025 | |
  24. TABLE 10 South America Market, by Country, 2025 | |
  25. TABLE 11 Global Market, by Deployment, 2025 | |
  26. TABLE 12 Global Market, by Component, 2025 | |
  27. TABLE 13 Global Market, by Analytics Type, 2025 | |
  28. TABLE 14 Global Market, by End-User Industry, 2025 | |
  29. TABLE 15 Global Market, by Organization Size, 2025 | |
  30. TABLE 16 Global Market, by Application, 2025 | |
  31. TABLE 17 Competitive Benchmarking Matrix | |
  32. TABLE 18 Report Scope and Methodology | |
  33. TABLE 19 Detailed Sources and Citations | |
  34. TABLE 20 Segmentation Quick Reference | |
  35. TABLE 21 Segmentation Overview, by Deployment | |
  36. TABLE 22 Segmentation Overview, by Component | |
  37. TABLE 23 Segmentation Overview, by Analytics Type | |
  38. TABLE 24 Segmentation Overview, by End-User Industry | |
  39. TABLE 25 Segmentation Overview, by Organization Size | |
  40. TABLE 26 Segmentation Overview, by Application | | LIST OF FIGURES | |
  41. FIGURE 1 Market Dynamics Overview (Drivers, Restraints, Opportunities) | |
  42. FIGURE 2 Industry Value Chain Analysis | |
  43. FIGURE 3 Porter's Five Forces Analysis | |
  44. FIGURE 4 Global Market Size Trend, 2021–2035 (USD Billion) | |
  45. FIGURE 5 Market Share, by Deployment, 2025 | |
  46. FIGURE 6 Market Share, by Component, 2025 | |
  47. FIGURE 7 Market Share, by Analytics Type, 2025 | |
  48. FIGURE 8 Market Share, by End-User Industry, 2025 | |
  49. FIGURE 9 Market Share, by Organization Size, 2025 | |
  50. FIGURE 10 Market Share, by Application, 2025 | |
  51. FIGURE 11 Market Share, by Region, 2025 | |
  52. FIGURE 12 Country-Level Share, by Region, 2025 | |
  53. FIGURE 13 Competitive Landscape, Estimated Vendor Share Ranges | |
  54. FIGURE 14 Competitive Positioning Matrix

Segmentation Quick Reference

DimensionSub-SegmentsDominant SegmentFastest Growing Segment
By DeploymentOn-Premises; CloudCloud (16.2% CAGR)Cloud (16.2% CAGR)
By ComponentSoftware; ServicesSoftware (58.4% share)Services (16.3% CAGR)
By Analytics TypeDescriptive Analytics; Predictive Analytics; Prescriptive AnalyticsPredictive Analytics (44.1% share)Prescriptive Analytics (16.4% CAGR)
By End-User IndustryManufacturing; Construction; Mining; Transportation and Logistics; Utilities; Other End-User IndustryManufacturing (27.5% share)Utilities (17.1% CAGR)
By Organization SizeLarge Enterprises; Small and Medium-Sized EnterprisesLarge Enterprises (66.2% share)Small and Medium-Sized Enterprises (17.4% CAGR)
By ApplicationAsset Performance Management; Quality and Process Optimization; Supply-Chain and Inventory Analytics; Energy Management; Safety and Risk AnalyticsAsset Performance Management (31.8% share)Energy Management (17.6% CAGR)
By RegionNorth America; Europe; Asia-Pacific; Middle East and Africa; South AmericaNorth America (36.4% share)Asia-Pacific (18.1% CAGR (2026–2035))

Market Segmentation Overview

By Deployment

Sub-SegmentKey Trend
On-PremisesRetained for latency-critical control and data that must stay on site
CloudMetered pricing and managed model pipelines drive new deployments

Cloud is both the leading and fastest-growing deployment model at a 16.2% CAGR, because consumption pricing removes upfront hardware costs and hyperscalers supply pre-built industrial data services.On-Premises keeps a 44.6% share in defense, pharmaceuticals, and other regulated plants where data residency and millisecond response outweigh elasticity. Federated designs that train centrally and infer locally are narrowing the gap between the two.

By Component

Sub-SegmentKey Trend
SoftwarePlatform subscriptions with embedded AI modules
ServicesManaged model tuning and integration contracts

Software leads with a 58.4% share as buyers standardize on data platforms with built-in modelling and visualization. Services grows faster at a 16.3% CAGR because models degrade as equipment ages, and few plants can staff the integration and recalibration work internally. Managed contracts are converting project fees into recurring service revenue.

By Analytics Type

Sub-SegmentKey Trend
Descriptive AnalyticsStable demand for compliance reporting and KPI dashboards
Predictive AnalyticsMature failure-forecasting use on rotating equipment
Prescriptive AnalyticsClosed-loop set-point automation gaining budget

Predictive Analytics holds a 44.1% share on the strength of proven failure-forecasting returns, while Prescriptive Analytics grows fastest at a 16.4% CAGR as operators want systems to act, not just alert. Descriptive Analytics, at USD 8.28 billion, stays necessary for regulatory reporting but captures a shrinking slice of incremental spending.

By End-User Industry

Sub-SegmentKey Trend
ManufacturingYield and downtime analytics scaling across multi-plant networks
ConstructionEquipment telematics feeding project cost controls
MiningAutonomous haulage and ore-grade optimization
Transportation and LogisticsEngine health and cold-chain monitoring
UtilitiesReal-time balancing for renewable-heavy grids
Other End-User IndustryProcess-safety and quality models in chemicals and oil and gas

Manufacturing leads with a 27.5% share because discrete and process plants were the earliest adopters of sensor-based yield and downtime analytics. Utilities grow fastest at a 17.1% CAGR as variable wind and solar output demands continuous balancing and transformer monitoring. Mining and Transportation and Logistics follow with autonomy- and fleet-driven use cases.

By Organization Size

Sub-SegmentKey Trend
Large EnterprisesEnterprise-wide platform standardization
Small and Medium-Sized EnterprisesPay-per-use applications and grant-funded adoption

Large Enterprises dominate with a 66.2% share through multi-site rollouts backed by internal data teams. Small and Medium-Sized Enterprises grow faster at a 17.4% CAGR as packaged per-asset subscriptions and public adoption grants remove the capital and skills barriers that previously excluded single-site manufacturers.

By Application

Sub-SegmentKey Trend
Asset Performance ManagementReliability programs extending equipment life
Quality and Process OptimizationIn-line vision inspection and statistical process control
Supply-Chain and Inventory AnalyticsSpare-parts and demand-sensing optimization
Energy ManagementTariff-aware load scheduling and emissions accounting
Safety and Risk AnalyticsIncident prevention and exposure monitoring

Asset Performance Management leads with a 31.8% share because unplanned downtime remains the costliest operational loss for asset-intensive plants. Energy Management grows fastest at a 17.6% CAGR, driven by volatile electricity prices and audited emissions disclosure. Quality and Process Optimization and Supply-Chain and Inventory Analytics deliver yield and working-capital gains, while Safety and Risk Analytics serves compliance-led buyers.


Download PDF ×

We do not share your information with anyone. However, we may send you emails based on your report interest from time to time. You may contact us at any time to opt-out.