Request Free Sample ×

Kindly complete the form below to receive a free sample of this Report

* Please use a valid business email

Leading companies partner with us for data-driven Insights

clients tt-cursor
Hero Background

India Tractor Market

ID: MRFR/AT/46361-HCR
200 Pages
Shubham Munde
Last Updated: April 06, 2026

India Tractor Market Research Report By Power Output (Less Than 30 HP, 30-50 HP, 51-100 HP, More Than 100 HP), By Drive Type (2 Wheel Drive, 4 Wheel Drive) andBy Application (Agriculture, Construction, Mining, Logistics) - Growth & Industry Forecast 2025 To 2035

Share:
Download PDF ×

We do not share your information with anyone. However, we may send you emails based on your report interest from time to time. You may contact us at any time to opt-out.

India Tractor Market Infographic
Purchase Options
  1. 1 SECTION I: EXECUTIVE SUMMARY AND KEY HIGHLIGHTS
    1. 1.1 EXECUTIVE SUMMARY
      1. 1.1.1 Market Overview
      2. 1.1.2 Key Findings
      3. 1.1.3 Market Segmentation
      4. 1.1.4 Competitive Landscape
      5. 1.1.5 Challenges and Opportunities
      6. 1.1.6 Future Outlook
  2. 2 SECTION II: SCOPING, METHODOLOGY AND MARKET STRUCTURE
    1. 2.1 MARKET INTRODUCTION
      1. 2.1.1 Definition
      2. 2.1.2 Scope of the study
        1. 2.1.2.1 Research Objective
        2. 2.1.2.2 Assumption
        3. 2.1.2.3 Limitations
    2. 2.2 RESEARCH METHODOLOGY
      1. 2.2.1 Overview
      2. 2.2.2 Data Mining
      3. 2.2.3 Secondary Research
      4. 2.2.4 Primary Research
        1. 2.2.4.1 Primary Interviews and Information Gathering Process
        2. 2.2.4.2 Breakdown of Primary Respondents
      5. 2.2.5 Forecasting Model
      6. 2.2.6 Market Size Estimation
        1. 2.2.6.1 Bottom-Up Approach
        2. 2.2.6.2 Top-Down Approach
      7. 2.2.7 Data Triangulation
      8. 2.2.8 Validation
  3. 3 SECTION III: QUALITATIVE ANALYSIS
    1. 3.1 MARKET DYNAMICS
      1. 3.1.1 Overview
      2. 3.1.2 Drivers
      3. 3.1.3 Restraints
      4. 3.1.4 Opportunities
    2. 3.2 MARKET FACTOR ANALYSIS
      1. 3.2.1 Value chain Analysis
      2. 3.2.2 Porter's Five Forces Analysis
        1. 3.2.2.1 Bargaining Power of Suppliers
        2. 3.2.2.2 Bargaining Power of Buyers
        3. 3.2.2.3 Threat of New Entrants
        4. 3.2.2.4 Threat of Substitutes
        5. 3.2.2.5 Intensity of Rivalry
      3. 3.2.3 COVID-19 Impact Analysis
        1. 3.2.3.1 Market Impact Analysis
        2. 3.2.3.2 Regional Impact
        3. 3.2.3.3 Opportunity and Threat Analysis
  4. 4 SECTION IV: QUANTITATIVE ANALYSIS
    1. 4.1 Automobile, BY Application (USD Billion)
      1. 4.1.1 Agriculture
      2. 4.1.2 Construction
      3. 4.1.3 Landscaping
      4. 4.1.4 Forestry
      5. 4.1.5 Mining
    2. 4.2 Automobile, BY Engine Type (USD Billion)
      1. 4.2.1 Internal Combustion Engine
      2. 4.2.2 Electric
      3. 4.2.3 Hybrid
      4. 4.2.4 Alternative Fuel
      5. 4.2.5 Hydrogen
    3. 4.3 Automobile, BY Tractor Size (USD Billion)
      1. 4.3.1 Compact
      2. 4.3.2 Utility
      3. 4.3.3 Full-Size
      4. 4.3.4 High Horsepower
      5. 4.3.5 Sub-Compact
    4. 4.4 Automobile, BY Transmission Type (USD Billion)
      1. 4.4.1 Manual
      2. 4.4.2 Automatic
      3. 4.4.3 Semi-Automatic
      4. 4.4.4 CVT
      5. 4.4.5 Power Shuttle
  5. 5 SECTION V: COMPETITIVE ANALYSIS
    1. 5.1 Competitive Landscape
      1. 5.1.1 Overview
      2. 5.1.2 Competitive Analysis
      3. 5.1.3 Market share Analysis
      4. 5.1.4 Major Growth Strategy in the Automobile
      5. 5.1.5 Competitive Benchmarking
      6. 5.1.6 Leading Players in Terms of Number of Developments in the Automobile
      7. 5.1.7 Key developments and growth strategies
        1. 5.1.7.1 New Product Launch/Service Deployment
        2. 5.1.7.2 Merger & Acquisitions
        3. 5.1.7.3 Joint Ventures
      8. 5.1.8 Major Players Financial Matrix
        1. 5.1.8.1 Sales and Operating Income
        2. 5.1.8.2 Major Players R&D Expenditure. 2023
    2. 5.2 Company Profiles
      1. 5.2.1 John Deere (US)
        1. 5.2.1.1 Financial Overview
        2. 5.2.1.2 Products Offered
        3. 5.2.1.3 Key Developments
        4. 5.2.1.4 SWOT Analysis
        5. 5.2.1.5 Key Strategies
      2. 5.2.2 CNH Industrial (GB)
        1. 5.2.2.1 Financial Overview
        2. 5.2.2.2 Products Offered
        3. 5.2.2.3 Key Developments
        4. 5.2.2.4 SWOT Analysis
        5. 5.2.2.5 Key Strategies
      3. 5.2.3 AGCO Corporation (US)
        1. 5.2.3.1 Financial Overview
        2. 5.2.3.2 Products Offered
        3. 5.2.3.3 Key Developments
        4. 5.2.3.4 SWOT Analysis
        5. 5.2.3.5 Key Strategies
      4. 5.2.4 Kubota Corporation (JP)
        1. 5.2.4.1 Financial Overview
        2. 5.2.4.2 Products Offered
        3. 5.2.4.3 Key Developments
        4. 5.2.4.4 SWOT Analysis
        5. 5.2.4.5 Key Strategies
      5. 5.2.5 Mahindra & Mahindra (IN)
        1. 5.2.5.1 Financial Overview
        2. 5.2.5.2 Products Offered
        3. 5.2.5.3 Key Developments
        4. 5.2.5.4 SWOT Analysis
        5. 5.2.5.5 Key Strategies
      6. 5.2.6 SDF Group (IT)
        1. 5.2.6.1 Financial Overview
        2. 5.2.6.2 Products Offered
        3. 5.2.6.3 Key Developments
        4. 5.2.6.4 SWOT Analysis
        5. 5.2.6.5 Key Strategies
      7. 5.2.7 Yanmar Co Ltd (JP)
        1. 5.2.7.1 Financial Overview
        2. 5.2.7.2 Products Offered
        3. 5.2.7.3 Key Developments
        4. 5.2.7.4 SWOT Analysis
        5. 5.2.7.5 Key Strategies
      8. 5.2.8 Deutz-Fahr (DE)
        1. 5.2.8.1 Financial Overview
        2. 5.2.8.2 Products Offered
        3. 5.2.8.3 Key Developments
        4. 5.2.8.4 SWOT Analysis
        5. 5.2.8.5 Key Strategies
      9. 5.2.9 Tafe (IN)
        1. 5.2.9.1 Financial Overview
        2. 5.2.9.2 Products Offered
        3. 5.2.9.3 Key Developments
        4. 5.2.9.4 SWOT Analysis
        5. 5.2.9.5 Key Strategies
    3. 5.3 Appendix
      1. 5.3.1 References
      2. 5.3.2 Related Reports
  6. 6 LIST OF FIGURES
    1. 6.1 MARKET SYNOPSIS
    2. 6.2 INDIA MARKET ANALYSIS BY APPLICATION
    3. 6.3 INDIA MARKET ANALYSIS BY ENGINE TYPE
    4. 6.4 INDIA MARKET ANALYSIS BY TRACTOR SIZE
    5. 6.5 INDIA MARKET ANALYSIS BY TRANSMISSION TYPE
    6. 6.6 KEY BUYING CRITERIA OF AUTOMOBILE
    7. 6.7 RESEARCH PROCESS OF MRFR
    8. 6.8 DRO ANALYSIS OF AUTOMOBILE
    9. 6.9 DRIVERS IMPACT ANALYSIS: AUTOMOBILE
    10. 6.10 RESTRAINTS IMPACT ANALYSIS: AUTOMOBILE
    11. 6.11 SUPPLY / VALUE CHAIN: AUTOMOBILE
    12. 6.12 AUTOMOBILE, BY APPLICATION, 2024 (% SHARE)
    13. 6.13 AUTOMOBILE, BY APPLICATION, 2024 TO 2035 (USD Billion)
    14. 6.14 AUTOMOBILE, BY ENGINE TYPE, 2024 (% SHARE)
    15. 6.15 AUTOMOBILE, BY ENGINE TYPE, 2024 TO 2035 (USD Billion)
    16. 6.16 AUTOMOBILE, BY TRACTOR SIZE, 2024 (% SHARE)
    17. 6.17 AUTOMOBILE, BY TRACTOR SIZE, 2024 TO 2035 (USD Billion)
    18. 6.18 AUTOMOBILE, BY TRANSMISSION TYPE, 2024 (% SHARE)
    19. 6.19 AUTOMOBILE, BY TRANSMISSION TYPE, 2024 TO 2035 (USD Billion)
    20. 6.20 BENCHMARKING OF MAJOR COMPETITORS
  7. 7 LIST OF TABLES
    1. 7.1 LIST OF ASSUMPTIONS
  8. 7.1.1
    1. 7.2 India MARKET SIZE ESTIMATES; FORECAST
      1. 7.2.1 BY APPLICATION, 2025-2035 (USD Billion)
      2. 7.2.2 BY ENGINE TYPE, 2025-2035 (USD Billion)
      3. 7.2.3 BY TRACTOR SIZE, 2025-2035 (USD Billion)
      4. 7.2.4 BY TRANSMISSION TYPE, 2025-2035 (USD Billion)
    2. 7.3 PRODUCT LAUNCH/PRODUCT DEVELOPMENT/APPROVAL
  9. 7.3.1
    1. 7.4 ACQUISITION/PARTNERSHIP
  10. 7.4.1

India Automobile Market Segmentation

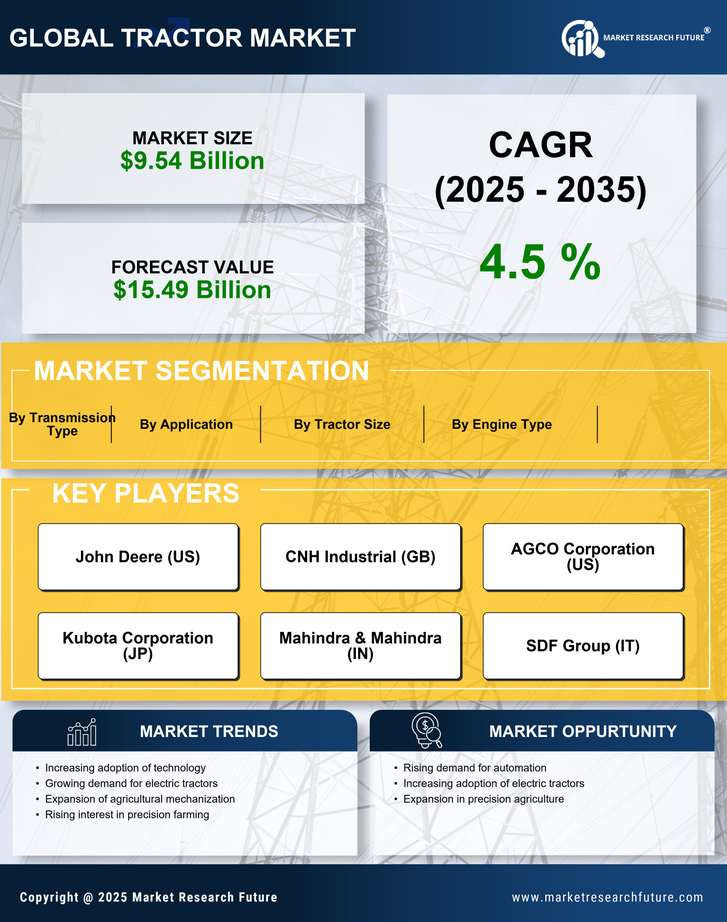
Automobile By Application (USD Billion, 2025-2035)

  • Agriculture
  • Construction
  • Landscaping
  • Forestry
  • Mining

Automobile By Engine Type (USD Billion, 2025-2035)

  • Internal Combustion Engine
  • Electric
  • Hybrid
  • Alternative Fuel
  • Hydrogen

Automobile By Tractor Size (USD Billion, 2025-2035)

  • Compact
  • Utility
  • Full-Size
  • High Horsepower
  • Sub-Compact

Automobile By Transmission Type (USD Billion, 2025-2035)

  • Manual
  • Automatic
  • Semi-Automatic
  • CVT
  • Power Shuttle

Compare Licence

×
Features License Type
Single User Multiuser License Enterprise User
Price $4,950 $5,950 $7,250
Maximum User Access Limit 1 User Upto 10 Users Unrestricted Access Throughout the Organization
Free Customization
Direct Access to Analyst
Deliverable Format
Platform Access
Discount on Next Purchase 10% 15% 15%
Printable Versions