

India Industrial Automation & Equipment Market Segmentation
Industrial Automation & Equipment By Type (USD Million, 2025-2035)
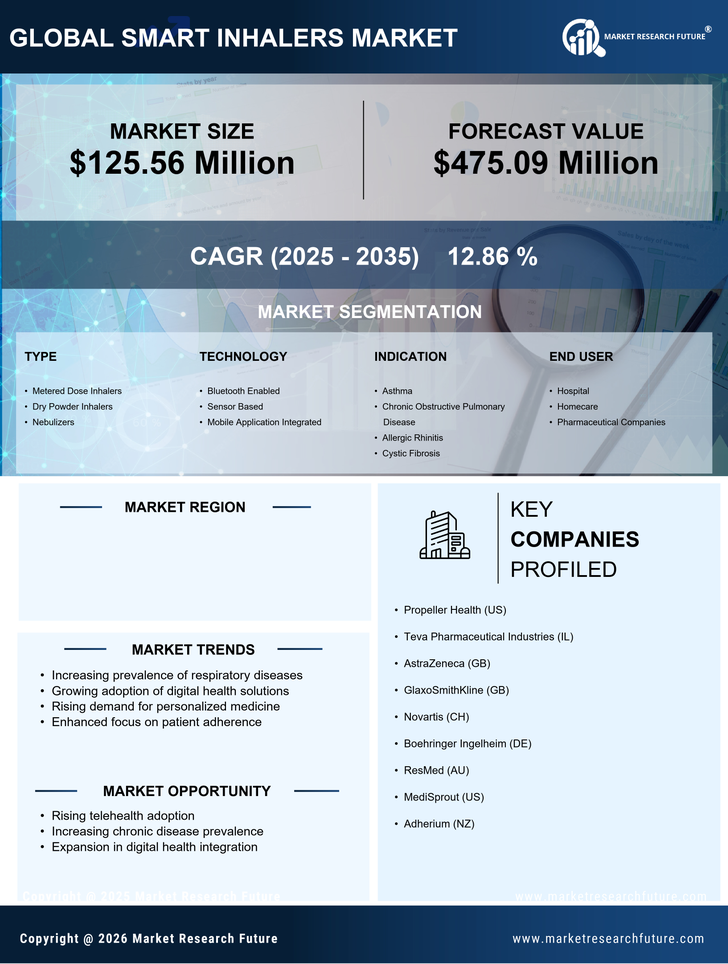
- Metered Dose Inhalers
- Dry Powder Inhalers
- Nebulizers
Industrial Automation & Equipment By Technology (USD Million, 2025-2035)
- Bluetooth Enabled
- Sensor Based
- Mobile Application Integrated
Industrial Automation & Equipment By Indication (USD Million, 2025-2035)
- Asthma
- Chronic Obstructive Pulmonary Disease
- Allergic Rhinitis
- Cystic Fibrosis
Industrial Automation & Equipment By End User (USD Million, 2025-2035)
- Hospital
- Homecare
- Pharmaceutical Companies
Industrial Automation & Equipment By Distribution Channel (USD Million, 2025-2035)
- Online Pharmacies
- Retail Pharmacies
- Hospitals


