

India Industrial Automation & Equipment Market Segmentation
Industrial Automation & Equipment By Application (USD Million, 2025-2035)
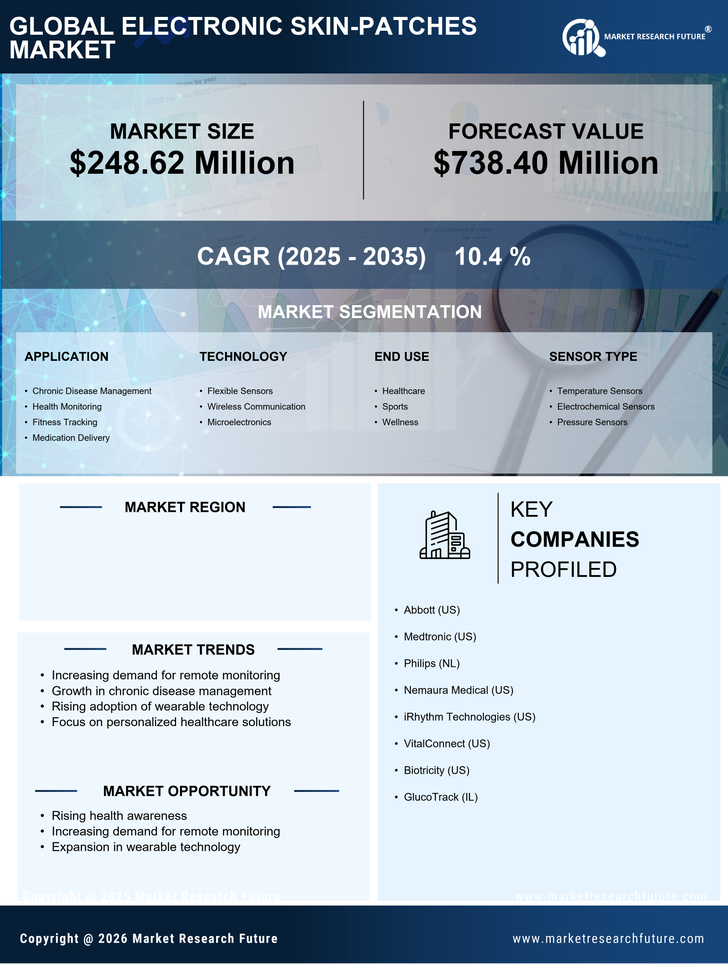
- Chronic Disease Management
- Health Monitoring
- Fitness Tracking
- Medication Delivery
Industrial Automation & Equipment By Technology (USD Million, 2025-2035)
- Flexible Sensors
- Wireless Communication
- Microelectronics
Industrial Automation & Equipment By End Use (USD Million, 2025-2035)
- Healthcare
- Sports
- Wellness
Industrial Automation & Equipment By Sensor Type (USD Million, 2025-2035)
- Temperature Sensors
- Electrochemical Sensors
- Pressure Sensors


