India India CCTV Camera Market Segmentation
India CCTV Camera Market By Product (USD Million, 2025-2035)
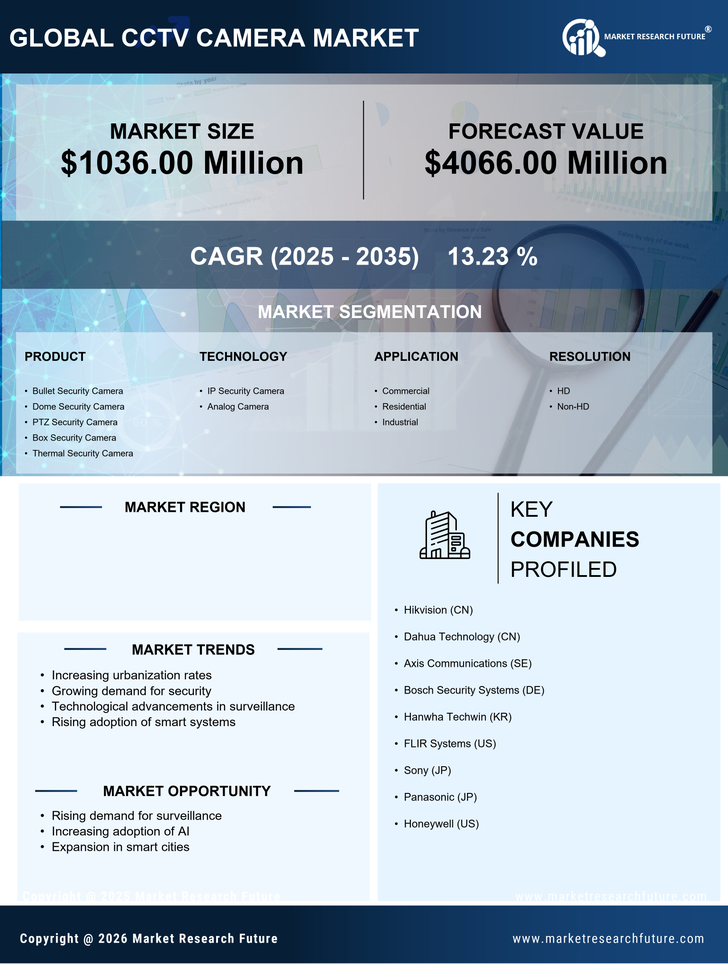
- Bullet Security Camera
- Dome Security Camera
- PTZ Security Camera
- Box Security Camera
- Thermal Security Camera
India CCTV Camera Market By Technology (USD Million, 2025-2035)
- IP Security Camera
- Analog Camera
India CCTV Camera Market By Application (USD Million, 2025-2035)
- Commercial
- Residential
- Industrial
India CCTV Camera Market By Resolution (USD Million, 2025-2035)
- HD
- Non-HD
India CCTV Camera Market By Services (USD Million, 2025-2035)
- Professional Service
- Managed Service