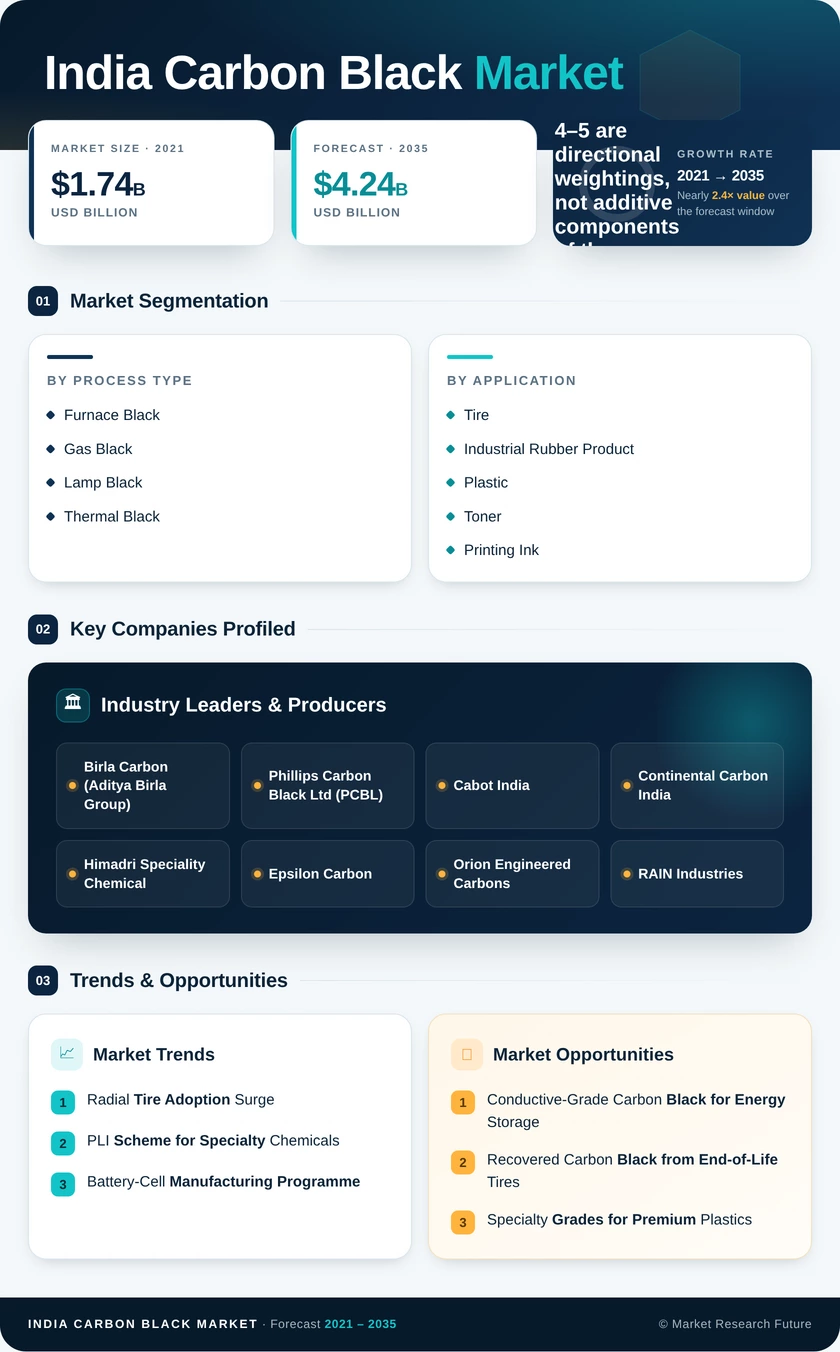
Request Free Sample ×

Kindly complete the form below to receive a free sample of this Report

* Please use a valid business email

Leading companies partner with us for data-driven Insights

clients tt-cursor
Hero Background

India Carbon Black Market

ID: MRFR/CnM/20172-HCR
128 Pages
Priya Nagrale
Last Updated: April 06, 2026

India Carbon Black Market Research Report Information by Type (Furnace Black, Acetylene Black, Channel Black, and Others), by Application (Rubber Black (Tire Treads (Inner Liner and Tubes, Conveyor Belts, Hoses, Others) and Specialty Black (Plastics, Ink and Toners, Paint and Coatings, Wires and Cables, Others)) – India Market Forecast Till 2035

Share:
Download PDF ×

We do not share your information with anyone. However, we may send you emails based on your report interest from time to time. You may contact us at any time to opt-out.

  1. 1 SECTION I: EXECUTIVE SUMMARY AND KEY HIGHLIGHTS
    1. 1.1 EXECUTIVE SUMMARY
      1. 1.1.1 Market Overview
      2. 1.1.2 Key Findings
      3. 1.1.3 Market Segmentation
      4. 1.1.4 Competitive Landscape
      5. 1.1.5 Challenges and Opportunities
      6. 1.1.6 Future Outlook
  2. 2 SECTION II: SCOPING, METHODOLOGY AND MARKET STRUCTURE
    1. 2.1 MARKET INTRODUCTION
      1. 2.1.1 Definition
      2. 2.1.2 Scope of the study
        1. 2.1.2.1 Research Objective
        2. 2.1.2.2 Assumption
        3. 2.1.2.3 Limitations
    2. 2.2 RESEARCH METHODOLOGY
      1. 2.2.1 Overview
      2. 2.2.2 Data Mining
      3. 2.2.3 Secondary Research
      4. 2.2.4 Primary Research
        1. 2.2.4.1 Primary Interviews and Information Gathering Process
        2. 2.2.4.2 Breakdown of Primary Respondents
      5. 2.2.5 Forecasting Model
      6. 2.2.6 Market Size Estimation
        1. 2.2.6.1 Bottom-Up Approach
        2. 2.2.6.2 Top-Down Approach
      7. 2.2.7 Data Triangulation
      8. 2.2.8 Validation
  3. 3 SECTION III: QUALITATIVE ANALYSIS
    1. 3.1 MARKET DYNAMICS
      1. 3.1.1 Overview
      2. 3.1.2 Drivers
      3. 3.1.3 Restraints
      4. 3.1.4 Opportunities
    2. 3.2 MARKET FACTOR ANALYSIS
      1. 3.2.1 Value chain Analysis
      2. 3.2.2 Porter's Five Forces Analysis
        1. 3.2.2.1 Bargaining Power of Suppliers
        2. 3.2.2.2 Bargaining Power of Buyers
        3. 3.2.2.3 Threat of New Entrants
        4. 3.2.2.4 Threat of Substitutes
        5. 3.2.2.5 Intensity of Rivalry
      3. 3.2.3 COVID-19 Impact Analysis
        1. 3.2.3.1 Market Impact Analysis
        2. 3.2.3.2 Regional Impact
        3. 3.2.3.3 Opportunity and Threat Analysis
  4. 4 SECTION IV: QUANTITATIVE ANALYSIS
    1. 4.1 Chemicals and Materials, BY Application (USD Billion)
      1. 4.1.1 Tires
      2. 4.1.2 Plastics
      3. 4.1.3 Coatings
      4. 4.1.4 Inks
      5. 4.1.5 Adhesives
    2. 4.2 Chemicals and Materials, BY End Use Industry (USD Billion)
      1. 4.2.1 Automotive
      2. 4.2.2 Construction
      3. 4.2.3 Electronics
      4. 4.2.4 Consumer Goods
      5. 4.2.5 Industrial
    3. 4.3 Chemicals and Materials, BY Production Process (USD Billion)
      1. 4.3.1 Thermal Black
      2. 4.3.2 Acetylene Black
      3. 4.3.3 Furnace Black
      4. 4.3.4 Lamp Black
      5. 4.3.5 Channel Black
    4. 4.4 Chemicals and Materials, BY Grade (USD Billion)
      1. 4.4.1 Standard Grade
      2. 4.4.2 High-Performance Grade
      3. 4.4.3 Specialty Grade
      4. 4.4.4 Reinforcement Grade
      5. 4.4.5 Conductive Grade
  5. 5 SECTION V: COMPETITIVE ANALYSIS
    1. 5.1 Competitive Landscape
      1. 5.1.1 Overview
      2. 5.1.2 Competitive Analysis
      3. 5.1.3 Market share Analysis
      4. 5.1.4 Major Growth Strategy in the Chemicals and Materials
      5. 5.1.5 Competitive Benchmarking
      6. 5.1.6 Leading Players in Terms of Number of Developments in the Chemicals and Materials
      7. 5.1.7 Key developments and growth strategies
        1. 5.1.7.1 New Product Launch/Service Deployment
        2. 5.1.7.2 Merger & Acquisitions
        3. 5.1.7.3 Joint Ventures
      8. 5.1.8 Major Players Financial Matrix
        1. 5.1.8.1 Sales and Operating Income
        2. 5.1.8.2 Major Players R&D Expenditure. 2023
    2. 5.2 Company Profiles
      1. 5.2.1 Continental Carbon India Limited (IN)
        1. 5.2.1.1 Financial Overview
        2. 5.2.1.2 Products Offered
        3. 5.2.1.3 Key Developments
        4. 5.2.1.4 SWOT Analysis
        5. 5.2.1.5 Key Strategies
      2. 5.2.2 Aditya Birla Carbon (IN)
        1. 5.2.2.1 Financial Overview
        2. 5.2.2.2 Products Offered
        3. 5.2.2.3 Key Developments
        4. 5.2.2.4 SWOT Analysis
        5. 5.2.2.5 Key Strategies
      3. 5.2.3 Orion Engineered Carbons S.A. (IN)
        1. 5.2.3.1 Financial Overview
        2. 5.2.3.2 Products Offered
        3. 5.2.3.3 Key Developments
        4. 5.2.3.4 SWOT Analysis
        5. 5.2.3.5 Key Strategies
      4. 5.2.4 Cabot Carbon Limited (IN)
        1. 5.2.4.1 Financial Overview
        2. 5.2.4.2 Products Offered
        3. 5.2.4.3 Key Developments
        4. 5.2.4.4 SWOT Analysis
        5. 5.2.4.5 Key Strategies
      5. 5.2.5 Phillips Carbon Black Limited (IN)
        1. 5.2.5.1 Financial Overview
        2. 5.2.5.2 Products Offered
        3. 5.2.5.3 Key Developments
        4. 5.2.5.4 SWOT Analysis
        5. 5.2.5.5 Key Strategies
      6. 5.2.6 Tianjin Black Cat Carbon Black Co., Ltd. (IN)
        1. 5.2.6.1 Financial Overview
        2. 5.2.6.2 Products Offered
        3. 5.2.6.3 Key Developments
        4. 5.2.6.4 SWOT Analysis
        5. 5.2.6.5 Key Strategies
      7. 5.2.7 Saarthi Carbon (IN)
        1. 5.2.7.1 Financial Overview
        2. 5.2.7.2 Products Offered
        3. 5.2.7.3 Key Developments
        4. 5.2.7.4 SWOT Analysis
        5. 5.2.7.5 Key Strategies
      8. 5.2.8 Maharashtra Rubber Products (IN)
        1. 5.2.8.1 Financial Overview
        2. 5.2.8.2 Products Offered
        3. 5.2.8.3 Key Developments
        4. 5.2.8.4 SWOT Analysis
        5. 5.2.8.5 Key Strategies
    3. 5.3 Appendix
      1. 5.3.1 References
      2. 5.3.2 Related Reports
  6. 6 LIST OF FIGURES
    1. 6.1 MARKET SYNOPSIS
    2. 6.2 INDIA MARKET ANALYSIS BY APPLICATION
    3. 6.3 INDIA MARKET ANALYSIS BY END USE INDUSTRY
    4. 6.4 INDIA MARKET ANALYSIS BY PRODUCTION PROCESS
    5. 6.5 INDIA MARKET ANALYSIS BY GRADE
    6. 6.6 KEY BUYING CRITERIA OF CHEMICALS AND MATERIALS
    7. 6.7 RESEARCH PROCESS OF MRFR
    8. 6.8 DRO ANALYSIS OF CHEMICALS AND MATERIALS
    9. 6.9 DRIVERS IMPACT ANALYSIS: CHEMICALS AND MATERIALS
    10. 6.10 RESTRAINTS IMPACT ANALYSIS: CHEMICALS AND MATERIALS
    11. 6.11 SUPPLY / VALUE CHAIN: CHEMICALS AND MATERIALS
    12. 6.12 CHEMICALS AND MATERIALS, BY APPLICATION, 2024 (% SHARE)
    13. 6.13 CHEMICALS AND MATERIALS, BY APPLICATION, 2024 TO 2035 (USD Billion)
    14. 6.14 CHEMICALS AND MATERIALS, BY END USE INDUSTRY, 2024 (% SHARE)
    15. 6.15 CHEMICALS AND MATERIALS, BY END USE INDUSTRY, 2024 TO 2035 (USD Billion)
    16. 6.16 CHEMICALS AND MATERIALS, BY PRODUCTION PROCESS, 2024 (% SHARE)
    17. 6.17 CHEMICALS AND MATERIALS, BY PRODUCTION PROCESS, 2024 TO 2035 (USD Billion)
    18. 6.18 CHEMICALS AND MATERIALS, BY GRADE, 2024 (% SHARE)
    19. 6.19 CHEMICALS AND MATERIALS, BY GRADE, 2024 TO 2035 (USD Billion)
    20. 6.20 BENCHMARKING OF MAJOR COMPETITORS
  7. 7 LIST OF TABLES
    1. 7.1 LIST OF ASSUMPTIONS
  8. 7.1.1
    1. 7.2 India MARKET SIZE ESTIMATES; FORECAST
      1. 7.2.1 BY APPLICATION, 2025-2035 (USD Billion)
      2. 7.2.2 BY END USE INDUSTRY, 2025-2035 (USD Billion)
      3. 7.2.3 BY PRODUCTION PROCESS, 2025-2035 (USD Billion)
      4. 7.2.4 BY GRADE, 2025-2035 (USD Billion)
    2. 7.3 PRODUCT LAUNCH/PRODUCT DEVELOPMENT/APPROVAL
  9. 7.3.1
    1. 7.4 ACQUISITION/PARTNERSHIP
  10. 7.4.1

India Chemicals and Materials Market Segmentation

Chemicals and Materials By Application (USD Billion, 2025-2035)

  • Tires
  • Plastics
  • Coatings
  • Inks
  • Adhesives

Chemicals and Materials By End Use Industry (USD Billion, 2025-2035)

  • Automotive
  • Construction
  • Electronics
  • Consumer Goods
  • Industrial

Chemicals and Materials By Production Process (USD Billion, 2025-2035)

  • Thermal Black
  • Acetylene Black
  • Furnace Black
  • Lamp Black
  • Channel Black

Chemicals and Materials By Grade (USD Billion, 2025-2035)

  • Standard Grade
  • High-Performance Grade
  • Specialty Grade
  • Reinforcement Grade
  • Conductive Grade

Compare Licence

×
Features License Type
Single User Multiuser License Enterprise User
Price $4,950 $5,950 $7,250
Maximum User Access Limit 1 User Upto 10 Users Unrestricted Access Throughout the Organization
Free Customization
Direct Access to Analyst
Deliverable Format
Platform Access
Discount on Next Purchase 10% 15% 15%
Printable Versions