India Breast Imaging Market

ID: MRFR/MED/51133-HCR
200 Pages
Vikita Thakur
Last Updated: February 06, 2026
India Breast Imaging Market Research Report: Size, Share, Trend Analysis By Technology (Mammography, Ultrasound, Magnetic Resonance Imaging, Tomosynthesis, Breast Biopsy), By Product (Systems, Consumables, Software), By Applications (Screening, Diagnosis, Treatment Planning) and By End Use (Hospitals, Diagnostic Centers, Research Institutes) - Growth Outlook & Industry Forecast 2025 To 2035
Download PDF ×

We do not share your information with anyone. However, we may send you emails based on your report interest from time to time. You may contact us at any time to opt-out.

India Breast Imaging Market

Market Size

Forecast Period2025 - 2035
CAGR (2025 - 2035)8.46%
2024 Market Size$ 309.79 Million
2025 Market Size$ 336 Million
2035 Market Size$ 756.55 Million

Key Players

Hologic
Siemens Healthineers
GE Healthcare
Philips
Fujifilm
Canon Medical Systems
Opportunities
  • Growing Private Sector Investment
  • Rising Incidence of Breast Cancer
  • Government Initiatives and Policies
  1. 1 SECTION I: EXECUTIVE SUMMARY AND KEY HIGHLIGHTS
    1. 1.1 EXECUTIVE SUMMARY
      1. 1.1.1 Market Overview
      2. 1.1.2 Key Findings
      3. 1.1.3 Market Segmentation
      4. 1.1.4 Competitive Landscape
      5. 1.1.5 Challenges and Opportunities
      6. 1.1.6 Future Outlook
  2. 2 SECTION II: SCOPING, METHODOLOGY AND MARKET STRUCTURE
    1. 2.1 MARKET INTRODUCTION
      1. 2.1.1 Definition
      2. 2.1.2 Scope of the study
        1. 2.1.2.1 Research Objective
        2. 2.1.2.2 Assumption
        3. 2.1.2.3 Limitations
    2. 2.2 RESEARCH METHODOLOGY
      1. 2.2.1 Overview
      2. 2.2.2 Data Mining
      3. 2.2.3 Secondary Research
      4. 2.2.4 Primary Research
        1. 2.2.4.1 Primary Interviews and Information Gathering Process
        2. 2.2.4.2 Breakdown of Primary Respondents
      5. 2.2.5 Forecasting Model
      6. 2.2.6 Market Size Estimation
        1. 2.2.6.1 Bottom-Up Approach
        2. 2.2.6.2 Top-Down Approach
      7. 2.2.7 Data Triangulation
      8. 2.2.8 Validation
  3. 3 SECTION III: QUALITATIVE ANALYSIS
    1. 3.1 MARKET DYNAMICS
      1. 3.1.1 Overview
      2. 3.1.2 Drivers
      3. 3.1.3 Restraints
      4. 3.1.4 Opportunities
    2. 3.2 MARKET FACTOR ANALYSIS
      1. 3.2.1 Value chain Analysis
      2. 3.2.2 Porter's Five Forces Analysis
        1. 3.2.2.1 Bargaining Power of Suppliers
        2. 3.2.2.2 Bargaining Power of Buyers
        3. 3.2.2.3 Threat of New Entrants
        4. 3.2.2.4 Threat of Substitutes
        5. 3.2.2.5 Intensity of Rivalry
      3. 3.2.3 COVID-19 Impact Analysis
        1. 3.2.3.1 Market Impact Analysis
        2. 3.2.3.2 Regional Impact
        3. 3.2.3.3 Opportunity and Threat Analysis
  4. 4 SECTION IV: QUANTITATIVE ANALYSIS
    1. 4.1 Industrial Automation & Equipment, BY Technology (USD Million)
      1. 4.1.1 Mammography
      2. 4.1.2 Ultrasound
      3. 4.1.3 Magnetic Resonance Imaging
      4. 4.1.4 Tomosynthesis
      5. 4.1.5 Breast Biopsy
    2. 4.2 Industrial Automation & Equipment, BY Product (USD Million)
      1. 4.2.1 Systems
      2. 4.2.2 Consumables
      3. 4.2.3 Software
    3. 4.3 Industrial Automation & Equipment, BY Application (USD Million)
      1. 4.3.1 Screening
      2. 4.3.2 Diagnosis
      3. 4.3.3 Treatment Planning
    4. 4.4 Industrial Automation & Equipment, BY End Use (USD Million)
      1. 4.4.1 Hospitals
      2. 4.4.2 Diagnostic Centers
      3. 4.4.3 Research Institutes
  5. 5 SECTION V: COMPETITIVE ANALYSIS
    1. 5.1 Competitive Landscape
      1. 5.1.1 Overview
      2. 5.1.2 Competitive Analysis
      3. 5.1.3 Market share Analysis
      4. 5.1.4 Major Growth Strategy in the Industrial Automation & Equipment
      5. 5.1.5 Competitive Benchmarking
      6. 5.1.6 Leading Players in Terms of Number of Developments in the Industrial Automation & Equipment
      7. 5.1.7 Key developments and growth strategies
        1. 5.1.7.1 New Product Launch/Service Deployment
        2. 5.1.7.2 Merger & Acquisitions
        3. 5.1.7.3 Joint Ventures
      8. 5.1.8 Major Players Financial Matrix
        1. 5.1.8.1 Sales and Operating Income
        2. 5.1.8.2 Major Players R&D Expenditure. 2023
    2. 5.2 Company Profiles
      1. 5.2.1 Hologic (US)
        1. 5.2.1.1 Financial Overview
        2. 5.2.1.2 Products Offered
        3. 5.2.1.3 Key Developments
        4. 5.2.1.4 SWOT Analysis
        5. 5.2.1.5 Key Strategies
      2. 5.2.2 Siemens Healthineers (DE)
        1. 5.2.2.1 Financial Overview
        2. 5.2.2.2 Products Offered
        3. 5.2.2.3 Key Developments
        4. 5.2.2.4 SWOT Analysis
        5. 5.2.2.5 Key Strategies
      3. 5.2.3 GE Healthcare (US)
        1. 5.2.3.1 Financial Overview
        2. 5.2.3.2 Products Offered
        3. 5.2.3.3 Key Developments
        4. 5.2.3.4 SWOT Analysis
        5. 5.2.3.5 Key Strategies
      4. 5.2.4 Philips (NL)
        1. 5.2.4.1 Financial Overview
        2. 5.2.4.2 Products Offered
        3. 5.2.4.3 Key Developments
        4. 5.2.4.4 SWOT Analysis
        5. 5.2.4.5 Key Strategies
      5. 5.2.5 Fujifilm (JP)
        1. 5.2.5.1 Financial Overview
        2. 5.2.5.2 Products Offered
        3. 5.2.5.3 Key Developments
        4. 5.2.5.4 SWOT Analysis
        5. 5.2.5.5 Key Strategies
      6. 5.2.6 Canon Medical Systems (JP)
        1. 5.2.6.1 Financial Overview
        2. 5.2.6.2 Products Offered
        3. 5.2.6.3 Key Developments
        4. 5.2.6.4 SWOT Analysis
        5. 5.2.6.5 Key Strategies
      7. 5.2.7 Carestream Health (US)
        1. 5.2.7.1 Financial Overview
        2. 5.2.7.2 Products Offered
        3. 5.2.7.3 Key Developments
        4. 5.2.7.4 SWOT Analysis
        5. 5.2.7.5 Key Strategies
      8. 5.2.8 Konica Minolta (JP)
        1. 5.2.8.1 Financial Overview
        2. 5.2.8.2 Products Offered
        3. 5.2.8.3 Key Developments
        4. 5.2.8.4 SWOT Analysis
        5. 5.2.8.5 Key Strategies
      9. 5.2.9 Agfa HealthCare (BE)
        1. 5.2.9.1 Financial Overview
        2. 5.2.9.2 Products Offered
        3. 5.2.9.3 Key Developments
        4. 5.2.9.4 SWOT Analysis
        5. 5.2.9.5 Key Strategies
    3. 5.3 Appendix
      1. 5.3.1 References
      2. 5.3.2 Related Reports
  6. 6 LIST OF FIGURES
    1. 6.1 MARKET SYNOPSIS
    2. 6.2 INDIA MARKET ANALYSIS BY TECHNOLOGY
    3. 6.3 INDIA MARKET ANALYSIS BY PRODUCT
    4. 6.4 INDIA MARKET ANALYSIS BY APPLICATION
    5. 6.5 INDIA MARKET ANALYSIS BY END USE
    6. 6.6 KEY BUYING CRITERIA OF INDUSTRIAL AUTOMATION & EQUIPMENT
    7. 6.7 RESEARCH PROCESS OF MRFR
    8. 6.8 DRO ANALYSIS OF INDUSTRIAL AUTOMATION & EQUIPMENT
    9. 6.9 DRIVERS IMPACT ANALYSIS: INDUSTRIAL AUTOMATION & EQUIPMENT
    10. 6.10 RESTRAINTS IMPACT ANALYSIS: INDUSTRIAL AUTOMATION & EQUIPMENT
    11. 6.11 SUPPLY / VALUE CHAIN: INDUSTRIAL AUTOMATION & EQUIPMENT
    12. 6.12 INDUSTRIAL AUTOMATION & EQUIPMENT, BY TECHNOLOGY, 2024 (% SHARE)
    13. 6.13 INDUSTRIAL AUTOMATION & EQUIPMENT, BY TECHNOLOGY, 2024 TO 2035 (USD Million)
    14. 6.14 INDUSTRIAL AUTOMATION & EQUIPMENT, BY PRODUCT, 2024 (% SHARE)
    15. 6.15 INDUSTRIAL AUTOMATION & EQUIPMENT, BY PRODUCT, 2024 TO 2035 (USD Million)
    16. 6.16 INDUSTRIAL AUTOMATION & EQUIPMENT, BY APPLICATION, 2024 (% SHARE)
    17. 6.17 INDUSTRIAL AUTOMATION & EQUIPMENT, BY APPLICATION, 2024 TO 2035 (USD Million)
    18. 6.18 INDUSTRIAL AUTOMATION & EQUIPMENT, BY END USE, 2024 (% SHARE)
    19. 6.19 INDUSTRIAL AUTOMATION & EQUIPMENT, BY END USE, 2024 TO 2035 (USD Million)
    20. 6.20 BENCHMARKING OF MAJOR COMPETITORS
  7. 7 LIST OF TABLES
    1. 7.1 LIST OF ASSUMPTIONS
  8. 7.1.1
    1. 7.2 India MARKET SIZE ESTIMATES; FORECAST
      1. 7.2.1 BY TECHNOLOGY, 2025-2035 (USD Million)
      2. 7.2.2 BY PRODUCT, 2025-2035 (USD Million)
      3. 7.2.3 BY APPLICATION, 2025-2035 (USD Million)
      4. 7.2.4 BY END USE, 2025-2035 (USD Million)
    2. 7.3 PRODUCT LAUNCH/PRODUCT DEVELOPMENT/APPROVAL
  9. 7.3.1
    1. 7.4 ACQUISITION/PARTNERSHIP
  10. 7.4.1

India Industrial Automation & Equipment Market Segmentation

Industrial Automation & Equipment By Technology (USD Million, 2025-2035)
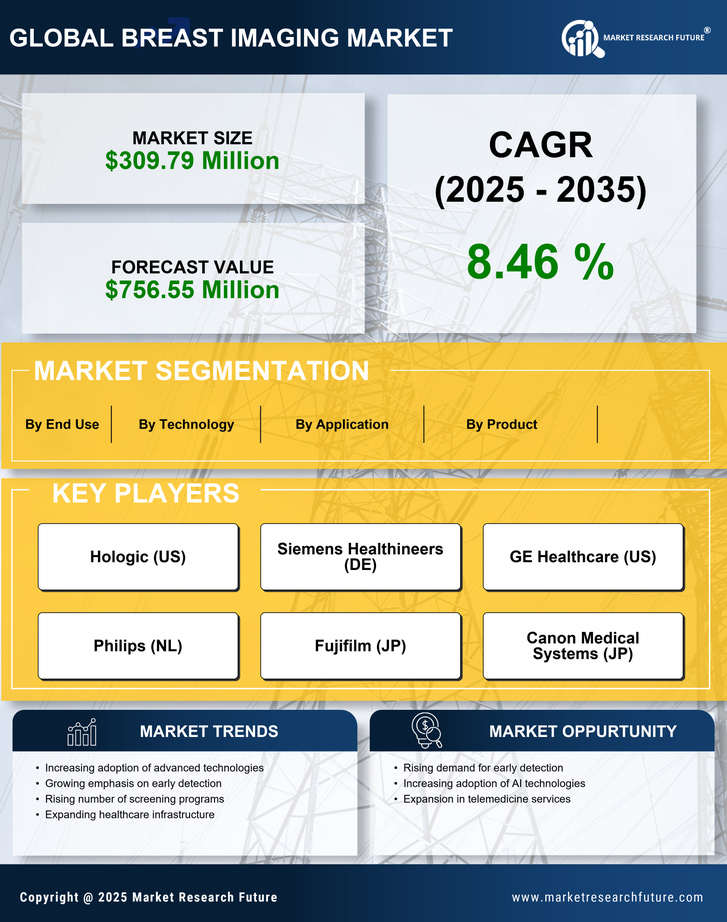
  • Mammography
  • Ultrasound
  • Magnetic Resonance Imaging
  • Tomosynthesis
  • Breast Biopsy

Industrial Automation & Equipment By Product (USD Million, 2025-2035)

  • Systems
  • Consumables
  • Software

Industrial Automation & Equipment By Application (USD Million, 2025-2035)

  • Screening
  • Diagnosis
  • Treatment Planning

Industrial Automation & Equipment By End Use (USD Million, 2025-2035)

  • Hospitals
  • Diagnostic Centers
  • Research Institutes