Request Free Sample ×

Kindly complete the form below to receive a free sample of this Report

* Please use a valid business email

Leading companies partner with us for data-driven Insights

clients tt-cursor
Hero Background

India Automotive Suspension System Market

ID: MRFR/AT/52920-HCR
200 Pages
Shubham Munde
Last Updated: February 09, 2026

India Automotive Suspension System Market Research Report By Type (Passive Suspension System, Active Suspension System, Semi-Active Suspension System), By Vehicle Type (Passenger Vehicles, Commercial Vehicles, Electric Vehicles, Heavy-Duty Vehicles), By System Component (Shock Absorbers, Struts, Coil Springs, Air Suspension, Leaf Springs), and By End-use (OEMs, Aftermarket) - Growth & Industry Forecast 2025 To 2035

Share:
Download PDF ×

We do not share your information with anyone. However, we may send you emails based on your report interest from time to time. You may contact us at any time to opt-out.

India Automotive Suspension System Market Infographic
Purchase Options
  1. 1 SECTION I: EXECUTIVE SUMMARY AND KEY HIGHLIGHTS
    1. 1.1 EXECUTIVE SUMMARY
      1. 1.1.1 Market Overview
      2. 1.1.2 Key Findings
      3. 1.1.3 Market Segmentation
      4. 1.1.4 Competitive Landscape
      5. 1.1.5 Challenges and Opportunities
      6. 1.1.6 Future Outlook
  2. 2 SECTION II: SCOPING, METHODOLOGY AND MARKET STRUCTURE
    1. 2.1 MARKET INTRODUCTION
      1. 2.1.1 Definition
      2. 2.1.2 Scope of the study
        1. 2.1.2.1 Research Objective
        2. 2.1.2.2 Assumption
        3. 2.1.2.3 Limitations
    2. 2.2 RESEARCH METHODOLOGY
      1. 2.2.1 Overview
      2. 2.2.2 Data Mining
      3. 2.2.3 Secondary Research
      4. 2.2.4 Primary Research
        1. 2.2.4.1 Primary Interviews and Information Gathering Process
        2. 2.2.4.2 Breakdown of Primary Respondents
      5. 2.2.5 Forecasting Model
      6. 2.2.6 Market Size Estimation
        1. 2.2.6.1 Bottom-Up Approach
        2. 2.2.6.2 Top-Down Approach
      7. 2.2.7 Data Triangulation
      8. 2.2.8 Validation
  3. 3 SECTION III: QUALITATIVE ANALYSIS
    1. 3.1 MARKET DYNAMICS
      1. 3.1.1 Overview
      2. 3.1.2 Drivers
      3. 3.1.3 Restraints
      4. 3.1.4 Opportunities
    2. 3.2 MARKET FACTOR ANALYSIS
      1. 3.2.1 Value chain Analysis
      2. 3.2.2 Porter's Five Forces Analysis
        1. 3.2.2.1 Bargaining Power of Suppliers
        2. 3.2.2.2 Bargaining Power of Buyers
        3. 3.2.2.3 Threat of New Entrants
        4. 3.2.2.4 Threat of Substitutes
        5. 3.2.2.5 Intensity of Rivalry
      3. 3.2.3 COVID-19 Impact Analysis
        1. 3.2.3.1 Market Impact Analysis
        2. 3.2.3.2 Regional Impact
        3. 3.2.3.3 Opportunity and Threat Analysis
  4. 4 SECTION IV: QUANTITATIVE ANALYSIS
    1. 4.1 Automobile, BY Type (USD Billion)
      1. 4.1.1 Passive Suspension System
      2. 4.1.2 Active Suspension System
      3. 4.1.3 Semi-Active Suspension System
    2. 4.2 Automobile, BY Vehicle Type (USD Billion)
      1. 4.2.1 Passenger Vehicles
      2. 4.2.2 Commercial Vehicles
      3. 4.2.3 Electric Vehicles
      4. 4.2.4 Heavy-Duty Vehicles
    3. 4.3 Automobile, BY System Component (USD Billion)
      1. 4.3.1 Shock Absorbers
      2. 4.3.2 Struts
      3. 4.3.3 Coil Springs
      4. 4.3.4 Air Suspension
      5. 4.3.5 Leaf Springs
    4. 4.4 Automobile, BY End Use (USD Billion)
      1. 4.4.1 OEMs
      2. 4.4.2 Aftermarket
  5. 5 SECTION V: COMPETITIVE ANALYSIS
    1. 5.1 Competitive Landscape
      1. 5.1.1 Overview
      2. 5.1.2 Competitive Analysis
      3. 5.1.3 Market share Analysis
      4. 5.1.4 Major Growth Strategy in the Automobile
      5. 5.1.5 Competitive Benchmarking
      6. 5.1.6 Leading Players in Terms of Number of Developments in the Automobile
      7. 5.1.7 Key developments and growth strategies
        1. 5.1.7.1 New Product Launch/Service Deployment
        2. 5.1.7.2 Merger & Acquisitions
        3. 5.1.7.3 Joint Ventures
      8. 5.1.8 Major Players Financial Matrix
        1. 5.1.8.1 Sales and Operating Income
        2. 5.1.8.2 Major Players R&D Expenditure. 2023
    2. 5.2 Company Profiles
      1. 5.2.1 ZF Friedrichshafen AG (DE)
        1. 5.2.1.1 Financial Overview
        2. 5.2.1.2 Products Offered
        3. 5.2.1.3 Key Developments
        4. 5.2.1.4 SWOT Analysis
        5. 5.2.1.5 Key Strategies
      2. 5.2.2 Tenneco Inc. (US)
        1. 5.2.2.1 Financial Overview
        2. 5.2.2.2 Products Offered
        3. 5.2.2.3 Key Developments
        4. 5.2.2.4 SWOT Analysis
        5. 5.2.2.5 Key Strategies
      3. 5.2.3 Magna International Inc. (CA)
        1. 5.2.3.1 Financial Overview
        2. 5.2.3.2 Products Offered
        3. 5.2.3.3 Key Developments
        4. 5.2.3.4 SWOT Analysis
        5. 5.2.3.5 Key Strategies
      4. 5.2.4 Thyssenkrupp AG (DE)
        1. 5.2.4.1 Financial Overview
        2. 5.2.4.2 Products Offered
        3. 5.2.4.3 Key Developments
        4. 5.2.4.4 SWOT Analysis
        5. 5.2.4.5 Key Strategies
      5. 5.2.5 Continental AG (DE)
        1. 5.2.5.1 Financial Overview
        2. 5.2.5.2 Products Offered
        3. 5.2.5.3 Key Developments
        4. 5.2.5.4 SWOT Analysis
        5. 5.2.5.5 Key Strategies
      6. 5.2.6 BWI Group (CN)
        1. 5.2.6.1 Financial Overview
        2. 5.2.6.2 Products Offered
        3. 5.2.6.3 Key Developments
        4. 5.2.6.4 SWOT Analysis
        5. 5.2.6.5 Key Strategies
      7. 5.2.7 Hitachi Automotive Systems Ltd. (JP)
        1. 5.2.7.1 Financial Overview
        2. 5.2.7.2 Products Offered
        3. 5.2.7.3 Key Developments
        4. 5.2.7.4 SWOT Analysis
        5. 5.2.7.5 Key Strategies
      8. 5.2.8 Mando Corporation (KR)
        1. 5.2.8.1 Financial Overview
        2. 5.2.8.2 Products Offered
        3. 5.2.8.3 Key Developments
        4. 5.2.8.4 SWOT Analysis
        5. 5.2.8.5 Key Strategies
      9. 5.2.9 KYB Corporation (JP)
        1. 5.2.9.1 Financial Overview
        2. 5.2.9.2 Products Offered
        3. 5.2.9.3 Key Developments
        4. 5.2.9.4 SWOT Analysis
        5. 5.2.9.5 Key Strategies
    3. 5.3 Appendix
      1. 5.3.1 References
      2. 5.3.2 Related Reports
  6. 6 LIST OF FIGURES
    1. 6.1 MARKET SYNOPSIS
    2. 6.2 INDIA MARKET ANALYSIS BY TYPE
    3. 6.3 INDIA MARKET ANALYSIS BY VEHICLE TYPE
    4. 6.4 INDIA MARKET ANALYSIS BY SYSTEM COMPONENT
    5. 6.5 INDIA MARKET ANALYSIS BY END USE
    6. 6.6 KEY BUYING CRITERIA OF AUTOMOBILE
    7. 6.7 RESEARCH PROCESS OF MRFR
    8. 6.8 DRO ANALYSIS OF AUTOMOBILE
    9. 6.9 DRIVERS IMPACT ANALYSIS: AUTOMOBILE
    10. 6.10 RESTRAINTS IMPACT ANALYSIS: AUTOMOBILE
    11. 6.11 SUPPLY / VALUE CHAIN: AUTOMOBILE
    12. 6.12 AUTOMOBILE, BY TYPE, 2024 (% SHARE)
    13. 6.13 AUTOMOBILE, BY TYPE, 2024 TO 2035 (USD Billion)
    14. 6.14 AUTOMOBILE, BY VEHICLE TYPE, 2024 (% SHARE)
    15. 6.15 AUTOMOBILE, BY VEHICLE TYPE, 2024 TO 2035 (USD Billion)
    16. 6.16 AUTOMOBILE, BY SYSTEM COMPONENT, 2024 (% SHARE)
    17. 6.17 AUTOMOBILE, BY SYSTEM COMPONENT, 2024 TO 2035 (USD Billion)
    18. 6.18 AUTOMOBILE, BY END USE, 2024 (% SHARE)
    19. 6.19 AUTOMOBILE, BY END USE, 2024 TO 2035 (USD Billion)
    20. 6.20 BENCHMARKING OF MAJOR COMPETITORS
  7. 7 LIST OF TABLES
    1. 7.1 LIST OF ASSUMPTIONS
  8. 7.1.1
    1. 7.2 India MARKET SIZE ESTIMATES; FORECAST
      1. 7.2.1 BY TYPE, 2025-2035 (USD Billion)
      2. 7.2.2 BY VEHICLE TYPE, 2025-2035 (USD Billion)
      3. 7.2.3 BY SYSTEM COMPONENT, 2025-2035 (USD Billion)
      4. 7.2.4 BY END USE, 2025-2035 (USD Billion)
    2. 7.3 PRODUCT LAUNCH/PRODUCT DEVELOPMENT/APPROVAL
  9. 7.3.1
    1. 7.4 ACQUISITION/PARTNERSHIP
  10. 7.4.1

India Automobile Market Segmentation

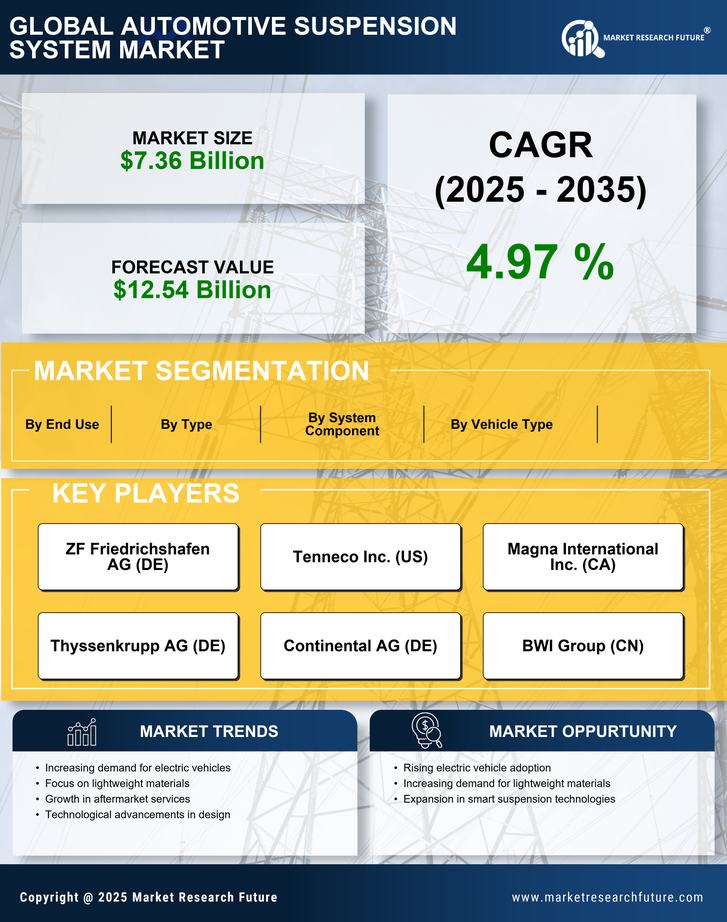
Automobile By Type (USD Billion, 2025-2035)

  • Passive Suspension System
  • Active Suspension System
  • Semi-Active Suspension System

Automobile By Vehicle Type (USD Billion, 2025-2035)

  • Passenger Vehicles
  • Commercial Vehicles
  • Electric Vehicles
  • Heavy-Duty Vehicles

Automobile By System Component (USD Billion, 2025-2035)

  • Shock Absorbers
  • Struts
  • Coil Springs
  • Air Suspension
  • Leaf Springs

Automobile By End Use (USD Billion, 2025-2035)

  • OEMs
  • Aftermarket

Compare Licence

×
Features License Type
Single User Multiuser License Enterprise User
Price $4,950 $5,950 $7,250
Maximum User Access Limit 1 User Upto 10 Users Unrestricted Access Throughout the Organization
Free Customization
Direct Access to Analyst
Deliverable Format
Platform Access
Discount on Next Purchase 10% 15% 15%
Printable Versions