• Cat-intel
  • MedIntelliX
  • Resources
  • About Us
  • Hero Background
    English
    Chinese
    French
    Japanese
    Korean
    German
    Spanish

    In-wheel Motors Market Share

    ID: MRFR/AM/5824-CR
    110 Pages
    Sejal Akre
    October 2022

    In-wheel motor Market Research Report Information By Propulsion Type (BEV, PHEV, FCEV, Cooling Type, Air Cooling, Liquid Cooling) Power Output (Up to 60 kW, 60–90 kW, Above 90 kW) Vehicle Type (Passenger Cars, Commercial Vehicles) Forecast 2030

    Share:
    Download PDF ×

    We do not share your information with anyone. However, we may send you emails based on your report interest from time to time. You may contact us at any time to opt-out.

    In-wheel Motors Market Infographic
    $ 4,950.0
    $ 5,950.0
    $ 7,250.0

    Market Share

    In-wheel Motors Market Share Analysis

    Logistics companies are going through big changes because of new technologies and what customers want. This shift to using digital tools is making things work better and allowing companies to cooperate more. This change is expected to be a big reason why the market for in-wheel motors will grow. In the United States, where moving things from one place to another is a very competitive business, the rise in people buying things online is causing a shake-up in how things are moved around. According to the US Department of Commerce, in 2020, the total sales from online shopping in the US were a huge USD 787.9 billion, which is 32.3% more than the year before. Because more people are buying smaller amounts of things online, companies are changing how they do things. They are setting up smaller centers closer to where people live, called "last-mile" centers, to keep things closer to customers. This is making the need for electric trucks that don't produce pollution go up. For example, in 2020, a company called AB Volvo made a deal with NFI Industries to use electric trucks for moving goods in different conditions. In North America, different ways are used to move goods, like air transport, trains, ships, and trucks. Big companies, both from other countries and within the US, offer special ways to move goods efficiently through each step, including by truck. DHL, a big logistics company, uses electric vans, and Amazon plans to use electric vans for delivery made by a company called Rivian starting in 2021. One of the great things about using in-wheel motors is that they send power straight from the motor to the wheel, making things work better by reducing the distance the power has to travel. This is especially important as more and more things need to be moved around, and that's why there is a growing need for in-wheel motors for electric trucks doing these jobs. So, as more things need to be moved around, the need for in-wheel motors is also growing, creating good opportunities for companies in the global in-wheel motor market.

    Market Summary

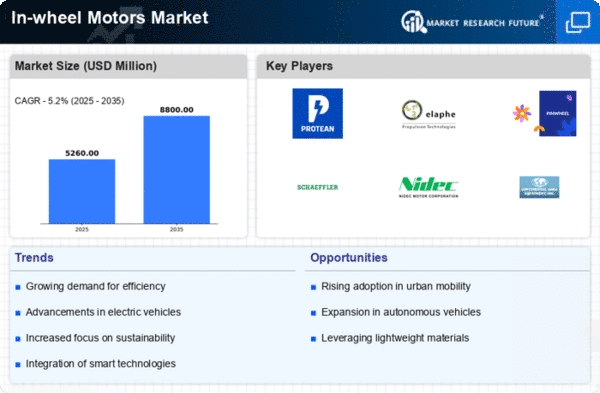
    As per Market Research Future Analysis, the global in-wheel motor market is projected to reach USD 49.150 Billion by 2032, with a CAGR of 32.31% from 2024 to 2030. In-wheel motors, mounted directly on vehicle wheels, enhance efficiency and reduce weight while enabling torque vectoring for improved handling. The COVID-19 pandemic initially disrupted the automotive industry, causing a decline in sales and production delays, but the market is recovering as demand for electric vehicles (EVs) rises. Key drivers include government initiatives promoting electric commercial vehicles and the expansion of EV manufacturers into emerging markets. However, high vehicle prices and limited battery capacity remain significant restraints. Opportunities are emerging from increased logistics activities driven by e-commerce growth, necessitating electric commercial vehicles for efficient last-mile delivery.

    Key Market Trends & Highlights

    The in-wheel motor market is witnessing significant growth driven by technological advancements and increasing demand for electric vehicles.

    • Market projected to reach USD 49.150 Billion by 2032; CAGR of 32.31% from 2024 to 2030.
    • Asia-Pacific expected to hold the highest revenue share due to rising demand for electric buses.
    • BEV segment anticipated to dominate market share, driven by government initiatives for EV adoption.
    • Liquid cooling segment expected to have the highest CAGR, enhancing motor efficiency.

    Market Size & Forecast

    Market Size USD 49.150 Billion by 2032
    CAGR 32.31% (2024-2030)
    Largest Regional Market Asia-Pacific
    Key Drivers Government initiatives and e-commerce growth.

    Major Players

    Protean Electric (US), NTN (Japan), NSK (Japan), Printed Motor Works (UK), Elaphe Ltd. (Slovenia), Ziehl-Abegg (Germany), e-Traction (Netherlands), DANA TM4 (Canada), Ecomove (Denmark), TAJIMA EV (Japan), YASA (UK), Schaeffler (Germany)

    Market Trends

    The ongoing shift towards electric mobility and the increasing demand for energy-efficient solutions are driving innovations in in-wheel motor technology, which may redefine vehicle design and performance in the coming years.

    U.S. Department of Energy

    In-wheel Motors Market Market Drivers

    Market Growth Projections

    The Global In-wheel motor market Industry is poised for remarkable growth, with projections indicating a market size of 7.63 USD Billion in 2024 and an impressive escalation to 113.8 USD Billion by 2035. This growth trajectory suggests a compound annual growth rate (CAGR) of 27.85% from 2025 to 2035. Such figures reflect the increasing adoption of electric vehicles and the integration of advanced technologies in automotive design. The market's expansion is likely to be driven by various factors, including technological advancements, government policies, and changing consumer preferences. As the industry evolves, stakeholders are expected to capitalize on emerging opportunities, further propelling the market forward.

    Rising Focus on Vehicle Efficiency

    The rising focus on vehicle efficiency is a significant driver for the Global In-wheel motor market Industry. As automotive manufacturers strive to enhance fuel economy and reduce emissions, in-wheel motors present a viable solution. By integrating motors directly into the wheel hub, manufacturers can achieve better weight distribution and lower energy losses. This efficiency is particularly appealing in the context of electric vehicles, where maximizing range is critical. The market's growth trajectory, with an expected valuation of 7.63 USD Billion in 2024, underscores the importance of efficiency in automotive design. As consumer preferences shift towards more efficient vehicles, the demand for in-wheel motors is likely to increase.

    Growing Demand for Electric Vehicles

    The increasing global demand for electric vehicles (EVs) is a primary driver for the Global In-wheel motor market Industry. As consumers become more environmentally conscious, the shift towards sustainable transportation solutions accelerates. In 2024, the market is projected to reach 7.63 USD Billion, reflecting a robust interest in innovative technologies like in-wheel motors. These motors enhance vehicle efficiency by reducing weight and improving space utilization, which is crucial for EV manufacturers. The anticipated growth in EV sales is expected to further bolster the adoption of in-wheel motors, aligning with the industry's trajectory towards cleaner mobility solutions.

    Government Initiatives and Incentives

    Government initiatives and incentives aimed at promoting electric mobility play a crucial role in driving the Global In-wheel motor market Industry. Various countries are implementing policies that encourage the adoption of electric vehicles, including tax rebates, subsidies, and infrastructure development for charging stations. These measures are likely to stimulate demand for in-wheel motors, as they are integral to the design of electric vehicles. With the market expected to grow at a CAGR of 27.85% from 2025 to 2035, supportive government policies are anticipated to create a favorable environment for manufacturers and consumers alike, fostering innovation and investment in this sector.

    Emerging Markets and Urbanization Trends

    Emerging markets and urbanization trends are reshaping the Global In-wheel motor market Industry. As urban populations grow, the demand for efficient and compact transportation solutions rises. In-wheel motors offer a unique advantage in urban settings, allowing for smaller vehicle designs that can navigate congested areas more effectively. This trend is particularly evident in regions experiencing rapid urbanization, where traditional vehicle designs may not suffice. The anticipated growth in these markets is expected to contribute to the overall expansion of the in-wheel motor sector, with projections indicating a market size of 113.8 USD Billion by 2035. Manufacturers are likely to adapt their strategies to cater to these evolving urban mobility needs.

    Technological Advancements in Motor Design

    Technological advancements in motor design significantly influence the Global In-wheel motor market Industry. Innovations such as improved power density, thermal management, and integration of smart technologies enhance the performance and reliability of in-wheel motors. These developments enable manufacturers to produce lighter and more efficient motors, which are essential for modern electric and hybrid vehicles. As a result, the market is likely to experience substantial growth, with projections indicating a rise to 113.8 USD Billion by 2035. The continuous evolution of motor technology not only meets consumer expectations but also aligns with regulatory standards for emissions and energy efficiency.

    Market Segment Insights

    Regional Insights

    Key Companies in the In-wheel Motors Market market include

    Industry Developments

    Elaphe Ltd. (Slovenia)

    January, 2025: Elaphe unveiled the Sonic.1, a high-performance front in-wheel motor, at CES 2025. This motor integrates a 400 mm brake disc within a 21-inch rim, delivering a continuous output of 272 horsepower per wheel and a peak power of 347 horsepower.

    The design allows for potential configurations achieving up to one megawatt of power in rear-wheel-drive setups. The Sonic.1 enhances vehicle control with response times twenty times faster than traditional electric axle systems.

    January, 2025: In collaboration with Italdesign, Elaphe's Sonic.1 motors were showcased in the Quintessenza concept car at CES 2025. This partnership demonstrates the integration of advanced in-wheel motor technology with innovative vehicle design, highlighting the potential for future electric vehicle architectures.

    In June 2021, e-Traction partnered with ViriCti, to help accelerate the adoption of electric buses by using the state-of-art The Motion 2.0 drivetrain.

    In February 2021, Tajima Motor Corporation Idemitsu Kosan partnered with Corporation to build and market mini electric vehicles that can travel as fast as 60 kilometers per hour.

    In January 2021, National Electric Vehicle Sweden (NEVS), a subsidiary of Evergrande Health, has acquired Protean Electric, a leading developer of in-wheel motor technology. The acquisition is part of Evergrande’s strategy to become a major player-in the global electric vehicle (EV) industry.

    In May 2019, Elaphe Ltd. Has announced they have begun low-volume series manufacturing of the world’s highest performance direct drive, gearless in-wheel powertrain system, called the L1500.

    In September 2018, Printed Motor Works, resigned and enhanced the specification of its compact XR15 series in-wheel motor range. The upgraded models have greater radial and axial load bearing capacity.

    Future Outlook

    In-wheel Motors Market Future Outlook

    The Global In-wheel motor market is projected to grow at a remarkable 27.85% CAGR from 2024 to 2035, driven by advancements in electric vehicle technology and increasing demand for efficient propulsion systems.

    New opportunities lie in:

    • Develop lightweight materials to enhance motor efficiency and vehicle performance.
    • Invest in smart motor technologies for real-time performance monitoring and optimization.
    • Expand partnerships with automotive manufacturers to integrate in-wheel motors in new electric vehicle models.

    By 2035, the In-wheel motor market is poised to achieve substantial growth, reflecting a transformative shift in automotive propulsion systems.

    Market Segmentation

    In-wheel motor Report Overview:

    In-wheel motor Market Segmentation

    Automotive In-wheel motor Market Segmentation Overview:

    Report Scope

    Report Attribute/Metric Details
      Market Size    2030: USD 49.150 Billion
      CAGR    ~32.31% CAGR (2024 - 2030)
      Base Year    2023
      Forecast Period    2024-2030
      Historical Data    2019 & 2023
      Forecast Units   Value (USD Billion)
      Report Coverage    Revenue Forecast, Competitive Landscape, Growth Factors, and Trends
      Segments Covered   Cooling Type, Motor Type, Vehicle Type, And Power Output
      Geographies Covered   North America, Europe, Asia-Pacific, Middle East & Africa, and South America
      Key Vendors   Protean Electric (US), NTN (Japan), NSK (Japan), Printed Motor Works (UK), Elaphe Ltd. (Slovenia), Ziehl-Abegg (Germany), e-Traction (Netherlands), DANA TM4 (Canada), Ecomove (Denmark), TAJIMA EV (Japan), YASA (UK), Schaeffler (Germany)
      Key Market Opportunities   Technological advancements in off-road vehicles
      Key Market Drivers   Government initiatives to encourage adoption of electric commercial vehicles Expansion of global electric vehicle manufacturers into emerging markets

    Market Highlights

    Author

    Sejal Akre
    Senior Research Analyst

    She holds an experience of about 6+ years in market research and business consulting, working under the spectrum of information communication technology, telecommunications and semiconductor domains. aarti conceptualizes and implements a scalable business strategy and provides strategic leadership to the clients. her expertise lies in market estimation, competitive intelligence, pipeline analysis, customer assessment, etc.

    Leave a Comment

    Latest Comments

    John Doe
    john@example.com

    This is a great article! Really helped me understand the topic better.

    Posted on July 23, 2025, 10:15 AM
    Jane Smith
    jane@domain.com

    Thanks for sharing this. I’ve bookmarked it for later reference.

    Posted on July 22, 2025, 7:45 PM

    FAQs

    What growth rate would the Global In-wheel motor Market register in the future?

    The Global In-wheel motor Market would register a growth of ~32.31% during the forecast period.

    What is the key restraining factor for the Global In-wheel motor Market?

    High prices of electric vehicles is a key restraining factor for the Global In-wheel motor Market

    Which region would enjoy the upper hand in the Global In-wheel motor Market?

    Asia-pacific would enjoy the upper hand in the Global In-wheel motor Market

    Which Asia-pacific country would set the trend in the Global In-wheel motor Market?

    China.

    Who are the key players operative in the global inwheel motors market?

    A few major market players operating in the global inwheel motors market are ECOmove GmbH (Germany), NTN Corporation (Japan), Protean Electric (US), among others.

    1. EXECUTIVE SUMMARY
      1. MARKET ATTRACTIVENESS
        1. GLOBAL IN-WHEEL MOTOR MARKET, BY PROPULSION TYPE
      2. ANALYSIS
      3. 1.1.2
    2. GLOBAL IN-WHEEL MOTOR MARKET, BY COOLING TYPE
      1. BY MOTOR TYPE
      2. 1.1.5
    3. GLOBAL IN-WHEEL MOTOR MARKET,
    4. GLOBAL IN-WHEEL MOTOR MARKET, BY VEHICLE TYPE
    5. GLOBAL IN-WHEEL MOTOR MARKET, BY POWER OUTPUT
      1. BY REGION
      2. \r\n
      3. 2: MARKET INTRODUCTION
      4. OF THE STUDY
      5. \r\n
    6. GLOBAL IN-WHEEL MOTOR MARKET,
      1. DEFINITION
      2. SCOPE
      3. MARKET STRUCTURE
    7. RESEARCH METHODOLOGY
      1. RESEARCH PROCESS
      2. PRIMARY RESEARCH
      3. SECONDARY RESEARCH
      4. MARKET SIZE ESTIMATION
      5. TOP-DOWN AND BOTTOM-UP APPROACH
      6. FORECAST
      7. MODEL
      8. LIST OF ASSUMPTIONS
      9. \r\n
    8. MARKET DYNAMICS
      1. INTRODUCTION
      2. DRIVERS
        1. GOVERNMENT INITIATIVES TO ENCOURAGE ADOPTION OF ELECTRIC
        2. EXPANSION OF GLOBAL ELECTRIC VEHICLE MANUFACTURERS
        3. DRIVER IMPACT ANALYSIS
      3. COMMERCIAL VEHICLES
      4. INTO EMERGING MARKETS
      5. RESTRAINTS
        1. LIMITED CAPACITY OF BATTERIES
      6. 4.3.1
      7. HIGH PRICES OF ELECTRIC VEHICLES
      8. 4.3.3
    9. RESTRAINT IMPACT ANALYSIS
      1. OPPORTUNITY
        1. INCREASING LOGISTIC ACTIVITIES
      2. COVID-19 IMPACT ANALYSIS
        1. ECONOMIC IMPACT ON THE AUTOMOTIVE INDUSTRY
        2. IMPACT ON PRODUCTION AND SALES
        3. IMPACT ON THE IN-WHEEL MOTOR
        4. IMPACT
      3. MARKET
      4. ON WORLD TRADE
    10. MARKET FACTOR ANALYSIS
      1. PORTER’S FIVE FORCES
        1. THREAT OF NEW ENTRANTS
        2. BARGAINING POWER OF SUPPLIERS
        3. THREAT OF SUBSTITUTES
        4. BARGAINING POWER OF BUYERS
        5. INTENSITY
      2. MODEL
      3. OF RIVALRY
      4. SUPPLY CHAIN ANALYSIS
        1. DESIGN & DEVELOPMENT
        2. RAW MATERIAL/COMPONENT SUPPLY
        3. ASSEMBLY
        4. DISTRIBUTION/SUPPLY
        5. END USE
    11. GLOBAL IN-WHEEL MOTOR MARKET, BY PROPULSION TYPE
      1. 6.1
      2. OVERVIEW
      3. BEV
      4. PHEV
      5. FCEV
    12. GLOBAL IN-WHEEL MOTOR MARKET,
      1. BY COOLING TYPE
      2. OVERVIEW
      3. AIR COOLING
      4. LIQUID COOLING
    13. GLOBAL IN-WHEEL MOTOR MARKET, BY MOTOR TYPE
      1. OVERVIEW
      2. AXIAL
      3. FLUX MOTOR
      4. RADIAL FLUX MOTOR
    14. GLOBAL IN-WHEEL MOTOR MARKET, BY POWER
      1. OUTPUT
      2. OVERVIEW
      3. UP TO 60 KW
      4. 60–90 KW
      5. ABOVE
    15. KW
    16. GLOBAL IN-WHEEL MOTOR MARKET, BY VEHICLE TYPE
      1. OVERVIEW
      2. PASSENGER CARS
      3. COMMERCIAL VEHICLES
    17. GLOBAL IN-WHEEL MOTOR
    18. MARKET, BY REGION
      1. OVERVIEW
      2. NORTH AMERICA
        1. US
        2. MEXICO
      3. 11.2.2
      4. CANADA
      5. EUROPE
        1. GERMANY
        2. UK
        3. FRANCE
        4. ITALY
        5. REST OF EUROPE
      6. ASIA-PACIFIC
        1. CHINA
        2. JAPAN
        3. INDIA
        4. REST OF ASIA-PACIFIC
      7. REST OF THE WORLD
        1. MIDDLE EAST & AFRICA
        2. SOUTH
      8. AMERICA
    19. COMPETITIVE LANDSCAPES
      1. COMPETITIVE OVERVIEW
      2. 12.2
      3. COMPETITIVE BENCHMARKING
      4. MARKET SHARE ANALYSIS
      5. KEY DEVELOPMENTS
    20. IN THE GLOBAL IN-WHEEL MOTOR MARKET
      1. 12.4.2
      2. PARTNERSHIP
    21. PRODUCT DEVELOPMENT
    22. MERGERS AND ACQUISITIONS
    23. EXPANSION
    24. COMPANY
      1. PROFILES
      2. PROTEAN
        1. COMPANY OVERVIEW
        2. FINANCIAL OVERVIEW
        3. PRODUCTS OFFERED
        4. KEY DEVELOPMENTS
        5. SWOT ANALYSIS
        6. KEY STRATEGIES
      3. NTN CORPORATION
        1. COMPANY OVERVIEW
        2. FINANCIAL OVERVIEW
        3. PRODUCTS OFFERED
        4. KEY DEVELOPMENTS
        5. SWOT ANALYSIS
        6. KEY STRATEGIES
      4. NSK LTD.
        1. FINANCIAL OVERVIEW
        2. PRODUCTS OFFERED
        3. KEY DEVELOPMENTS
        4. SWOT ANALYSIS
        5. KEY STRATEGIES
      5. 13.3.1
      6. COMPANY OVERVIEW
      7. TAJIMA MOTOR CORPORATION
        1. COMPANY OVERVIEW
        2. FINANCIAL
        3. PRODUCTS OFFERED
        4. KEY DEVELOPMENTS
      8. OVERVIEW
      9. YASA
        1. COMPANY OVERVIEW
        2. FINANCIAL OVERVIEW
        3. KEY DEVELOPMENTS
      10. LIMITED
      11. 13.5.3
      12. PRODUCTS OFFERED
      13. ECOMOVE
        1. COMPANY
        2. FINANCIAL OVERVIEW
        3. PRODUCTS OFFERED
      14. OVERVIEW
      15. 13.6.4
      16. KEY DEVELOPMENTS
      17. ELAPHE LTD.
        1. COMPANY OVERVIEW
        2. PRODUCTS OFFERED
        3. KEY DEVELOPMENTS
      18. 13.7.2
      19. FINANCIAL OVERVIEW
      20. SCHAEFFLER AG
        1. COMPANY OVERVIEW
        2. FINANCIAL OVERVIEW
        3. PRODUCTS, SOLUTIONS, AND SERVICES OFFERED
        4. KEY DEVELOPMENTS
      21. ZIEHL-ABEGG SE
        1. COMPANY OVERVIEW
        2. FINANCIAL OVERVIEW
        3. PRODUCTS OFFERED
        4. KEY DEVELOPMENTS
      22. PRINTED MOTOR
        1. COMPANY OVERVIEW
        2. FINANCIAL OVERVIEW
        3. KEY DEVELOPMENTS
      23. WORKS
      24. 13.10.3
      25. PRODUCTS OFFERED
      26. E-TRACTION B.V.
        1. FINANCIAL OVERVIEW
        2. PRODUCTS OFFERED
        3. KEY DEVELOPMENTS
      27. 13.11.1
      28. COMPANY OVERVIEW
      29. DANA TM4 INC.
        1. COMPANY OVERVIEW
        2. FINANCIAL OVERVIEW
        3. PRODUCTS OFFERED
        4. KEY DEVELOPMENTS
    25. APPENDIX
      1. DATA SOURCES
    26. LIST OF TABLES
      1. TABLE
      2. 1: LIST OF ASSUMPTIONS 28
    27. GLOBAL IN-WHEEL MOTOR MARKET ESTIMATES &
      1. FORECAST, BY PROPULSION TYPE, 2024–2030 (USD MILLION) 41
    28. GLOBAL
    29. IN-WHEEL MOTOR MARKET ESTIMATES & FORECAST, BY COOLING TYPE, 2024–2030
      1. (USD MILLION) 43
    30. GLOBAL IN-WHEEL MOTOR MARKET ESTIMATES & FORECAST,
      1. BY MOTOR TYPE, 2024–2030 (USD MILLION) 45
    31. GLOBAL IN-WHEEL MOTOR
    32. MARKET ESTIMATES & FORECAST, BY POWER OUTPUT, 2024–2030 (USD MILLION)
      1. 47
    33. GLOBAL IN-WHEEL MOTOR MARKET ESTIMATES & FORECAST, BY VEHICLE
      1. TYPE, 2024–2030 (USD MILLION) 49
    34. GLOBAL IN-WHEEL MOTOR MARKET,
      1. BY REGION, 2024–2030 (USD MILLION) 51
      2. TABLE 8: North America: In-WHEEL
    35. MOTOR MARKET, BY COUNTRY, 2024–2030 (USD MILLION) 52
    36. NORTH AMERICA:
    37. IN-WHEEL MOTOR MARKET ESTIMATES & FORECAST, BY PROPULSION TYPE, 2024–2030
      1. (USD MILLION) 52
    38. NORTH AMERICA: IN-WHEEL MOTOR MARKET ESTIMATES &
      1. FORECAST, BY COOLING TYPE, 2024–2030 (USD MILLION) 53
    39. NORTH
    40. AMERICA: IN-WHEEL MOTOR MARKET ESTIMATES & FORECAST, BY MOTOR TYPE, 2024–2030
      1. (USD MILLION) 53
    41. NORTH AMERICA: IN-WHEEL MOTOR MARKET ESTIMATES &
      1. FORECAST, BY POWER OUTPUT, 2024–2030 (USD MILLION) 53
    42. NORTH
    43. AMERICA: IN-WHEEL MOTOR MARKET ESTIMATES & FORECAST, BY VEHICLE TYPE, 2024–2030
      1. (USD MILLION) 54
    44. US: IN-WHEEL MOTOR MARKET ESTIMATES & FORECAST,
      1. BY PROPULSION TYPE, 2024–2030 (USD MILLION) 54
    45. US: IN-WHEEL
    46. MOTOR MARKET ESTIMATES & FORECAST, BY COOLING TYPE, 2024–2030 (USD MILLION)
      1. 54
    47. US: IN-WHEEL MOTOR MARKET ESTIMATES & FORECAST, BY MOTOR TYPE,
      1. TABLE 17: IN-WHEEL MOTOR MARKET ESTIMATES
      2. & FORECAST, BY POWER OUTPUT, 2024–2030 (USD MILLION)
    48. US:
    49. IN-WHEEL MOTOR MARKET ESTIMATES & FORECAST, BY VEHICLE TYPE, 2024–2030
      1. (USD MILLION) 55
    50. CANADA: IN-WHEEL MOTOR MARKET ESTIMATES & FORECAST,
      1. BY PROPULSION TYPE, 2024–2030 (USD MILLION) 56
    51. CANADA: IN-WHEEL
    52. MOTOR MARKET ESTIMATES & FORECAST, BY COOLING TYPE, 2024–2030 (USD MILLION)
      1. 56
    53. CANADA: IN-WHEEL MOTOR MARKET ESTIMATES & FORECAST, BY MOTOR
      1. TYPE, 2024–2030 (USD MILLION) 56
    54. CANADA: IN-WHEEL MOTOR MARKET
      1. ESTIMATES & FORECAST, BY POWER OUTPUT, 2024–2030 (USD MILLION) 57
      2. TABLE
    55. CANADA: IN-WHEEL MOTOR MARKET ESTIMATES & FORECAST, BY VEHICLE TYPE, 2024–2030
      1. (USD MILLION) 57
    56. MEXICO: IN-WHEEL MOTOR MARKET ESTIMATES & FORECAST,
      1. BY PROPULSION TYPE, 2024–2030 (USD MILLION) 58
    57. MEXICO: IN-WHEEL
    58. MOTOR MARKET ESTIMATES & FORECAST, BY COOLING TYPE, 2024–2030 (USD MILLION)
      1. 58
    59. MEXICO: IN-WHEEL MOTOR MARKET ESTIMATES & FORECAST, BY MOTOR
      1. TYPE, 2024–2030 (USD MILLION) 58
    60. MEXICO: IN-WHEEL MOTOR MARKET
      1. ESTIMATES & FORECAST, BY POWER OUTPUT, 2024–2030 (USD MILLION)
      2. TABLE
    61. MEXICO: IN-WHEEL MOTOR MARKET ESTIMATES & FORECAST, BY VEHICLE TYPE, 2024–2030
      1. (USD MILLION) 59
    62. TABLE 29: EUROPE: IN-WHEEL MOTOR MARKET, BY COUNTRY, 2024–2030
      1. (USD MILLION)
      2. TABLE 30: IN-WHEEL MOTOR MARKET ESTIMATES & FORECAST, BY
      3. PROPULSION TYPE, 2024–2030 (USD MILLION)
      4. TABLE 31: EUROPE: IN-WHEEL MOTOR
    63. MARKET ESTIMATES & FORECAST, BY COOLING TYPE, 2024–2030 (USD MILLION)
    64. TABLE 32: EUROPE: IN-WHEEL MOTOR MARKET ESTIMATES & FORECAST, BY MOTOR TYPE,
    65. EUROPE: IN-WHEEL MOTOR MARKET ESTIMATES
      1. & FORECAST, BY POWER OUTPUT, 2024–2030 (USD MILLION) 62
      2. TABLE 34
    66. EUROPE: IN-WHEEL MOTOR MARKET ESTIMATES & FORECAST, BY VEHICLE TYPE, 2024–2030
      1. (USD MILLION) 62
    67. GERMANY: IN-WHEEL MOTOR MARKET ESTIMATES & FORECAST,
      1. BY PROPULSION TYPE, 2024–2030 (USD MILLION) 62
    68. GERMANY: IN-WHEEL
    69. MOTOR MARKET ESTIMATES & FORECAST, BY COOLING TYPE, 2024–2030 (USD MILLION)
      1. 63
    70. GERMANY: IN-WHEEL MOTOR MARKET ESTIMATES & FORECAST, BY MOTOR
      1. TYPE, 2024–2030 (USD MILLION) 63
    71. GERMANY: IN-WHEEL MOTOR MARKET
      1. ESTIMATES & FORECAST, BY POWER OUTPUT, 2024–2030 (USD MILLION) 63
      2. TABLE
    72. GERMANY: IN-WHEEL MOTOR MARKET ESTIMATES & FORECAST, BY VEHICLE TYPE, 2024–2030
      1. (USD MILLION) 64
    73. UK: IN-WHEEL MOTOR MARKET ESTIMATES & FORECAST,
      1. BY PROPULSION TYPE, 2024–2030 (USD MILLION) 64
    74. UK: IN-WHEEL
    75. MOTOR MARKET ESTIMATES & FORECAST, BY COOLING TYPE, 2024–2030 (USD MILLION)
      1. 64
    76. UK: IN-WHEEL MOTOR MARKET ESTIMATES & FORECAST, BY MOTOR TYPE,
    77. UK: IN-WHEEL MOTOR MARKET ESTIMATES
      1. & FORECAST, BY POWER OUTPUT, 2024–2030 (USD MILLION) 65
      2. TABLE 44
    78. UK: IN-WHEEL MOTOR MARKET ESTIMATES & FORECAST, BY VEHICLE TYPE, 2024–2030
      1. (USD MILLION) 65
    79. FRANCE: IN-WHEEL MOTOR MARKET ESTIMATES & FORECAST,
      1. BY PROPULSION TYPE, 2024–2030 (USD MILLION) 66
    80. FRANCE: IN-WHEEL
    81. MOTOR MARKET ESTIMATES & FORECAST, BY COOLING TYPE, 2024–2030 (USD MILLION)
      1. 66
    82. FRANCE: IN-WHEEL MOTOR MARKET ESTIMATES & FORECAST, BY MOTOR
      1. TYPE, 2024–2030 (USD MILLION) 66
    83. FRANCE: IN-WHEEL MOTOR MARKET
      1. ESTIMATES & FORECAST, BY POWER OUTPUT, 2024–2030 (USD MILLION) 67
      2. TABLE
    84. FRANCE: IN-WHEEL MOTOR MARKET ESTIMATES & FORECAST, BY VEHICLE TYPE, 2024–2030
      1. (USD MILLION) 67
    85. ITALY: IN-WHEEL MOTOR MARKET ESTIMATES & FORECAST,
      1. BY PROPULSION TYPE, 2024–2030 (USD MILLION) 67
    86. ITALY: IN-WHEEL
    87. MOTOR MARKET ESTIMATES & FORECAST, BY COOLING TYPE, 2024–2030 (USD MILLION)
      1. 68
    88. ITALY: IN-WHEEL MOTOR MARKET ESTIMATES & FORECAST, BY MOTOR
      1. TYPE, 2024–2030 (USD MILLION) 68
    89. ITALY: IN-WHEEL MOTOR MARKET
      1. ESTIMATES & FORECAST, BY POWER OUTPUT, 2024–2030 (USD MILLION) 68
      2. TABLE
    90. ITALY: IN-WHEEL MOTOR MARKET ESTIMATES & FORECAST, BY VEHICLE TYPE, 2024–2030
      1. (USD MILLION) 69
    91. REST OF EUROPE: IN-WHEEL MOTOR MARKET ESTIMATES &
      1. FORECAST, BY PROPULSION TYPE, 2024–2030 (USD MILLION) 69
    92. REST
    93. OF EUROPE: IN-WHEEL MOTOR MARKET ESTIMATES & FORECAST, BY COOLING TYPE, 2024–2030
      1. (USD MILLION) 69
    94. REST OF EUROPE: IN-WHEEL MOTOR MARKET ESTIMATES &
      1. FORECAST, BY MOTOR TYPE, 2024–2030 (USD MILLION) 70
    95. REST OF
    96. EUROPE: IN-WHEEL MOTOR MARKET ESTIMATES & FORECAST, BY POWER OUTPUT, 2024–2030
      1. (USD MILLION) 70
    97. REST OF EUROPE: IN-WHEEL MOTOR MARKET ESTIMATES &
      1. FORECAST, BY VEHICLE TYPE, 2024–2030 (USD MILLION) 70
    98. ASIA-PACIFIC:
    99. IN-WHEEL MOTOR MARKET, BY COUNTRY, 2024–2030 (USD MILLION) 71
      1. TABLE 61
    100. ASIA-PACIFIC: IN-WHEEL MOTOR MARKET ESTIMATES & FORECAST, BY PROPULSION TYPE,
    101. ASIA-PACIFIC: IN-WHEEL MOTOR MARKET
      1. ESTIMATES & FORECAST, BY COOLING TYPE, 2024–2030 (USD MILLION) 72
      2. TABLE
    102. ASIA-PACIFIC: IN-WHEEL MOTOR MARKET ESTIMATES & FORECAST, BY MOTOR TYPE,
    103. ASIA-PACIFIC: IN-WHEEL MOTOR MARKET
      1. ESTIMATES & FORECAST, BY POWER OUTPUT, 2024–2030 (USD MILLION) 72
      2. TABLE
    104. ASIA-PACIFIC: IN-WHEEL MOTOR MARKET ESTIMATES & FORECAST, BY VEHICLE TYPE,
    105. CHINA: IN-WHEEL MOTOR MARKET ESTIMATES
      1. & FORECAST, BY PROPULSION TYPE, 2024–2030 (USD MILLION) 73
      2. TABLE
    106. CHINA: IN-WHEEL MOTOR MARKET ESTIMATES & FORECAST, BY COOLING TYPE, 2024–2030
      1. (USD MILLION) 73
    107. CHINA: IN-WHEEL MOTOR MARKET ESTIMATES & FORECAST,
      1. BY MOTOR TYPE, 2024–2030 (USD MILLION) 74
    108. CHINA: IN-WHEEL MOTOR
    109. MARKET ESTIMATES & FORECAST, BY POWER OUTPUT, 2024–2030 (USD MILLION)
      1. 74
    110. CHINA: IN-WHEEL MOTOR MARKET ESTIMATES & FORECAST, BY VEHICLE
      1. TYPE, 2024–2030 (USD MILLION) 74
    111. JAPAN: IN-WHEEL MOTOR MARKET
      1. ESTIMATES & FORECAST, BY PROPULSION TYPE, 2024–2030 (USD MILLION) 75
    112. JAPAN: IN-WHEEL MOTOR MARKET ESTIMATES & FORECAST, BY COOLING TYPE,
    113. JAPAN: IN-WHEEL MOTOR MARKET ESTIMATES
      1. & FORECAST, BY MOTOR TYPE, 2024–2030 (USD MILLION) 75
    114. JAPAN:
    115. IN-WHEEL MOTOR MARKET ESTIMATES & FORECAST, BY POWER OUTPUT, 2024–2030
      1. (USD MILLION) 76
    116. JAPAN: IN-WHEEL MOTOR MARKET ESTIMATES & FORECAST,
      1. BY VEHICLE TYPE, 2024–2030 (USD MILLION) 76
    117. INDIA: IN-WHEEL
    118. MOTOR MARKET ESTIMATES & FORECAST, BY PROPULSION TYPE, 2024–2030 (USD
      1. MILLION) 76
    119. INDIA: IN-WHEEL MOTOR MARKET ESTIMATES & FORECAST,
      1. BY COOLING TYPE, 2024–2030 (USD MILLION) 77
    120. INDIA: IN-WHEEL
    121. MOTOR MARKET ESTIMATES & FORECAST, BY MOTOR TYPE, 2024–2030 (USD MILLION)
      1. 77
    122. INDIA: IN-WHEEL MOTOR MARKET ESTIMATES & FORECAST, BY POWER
      1. OUTPUT, 2024–2030 (USD MILLION) 77
    123. INDIA: IN-WHEEL MOTOR MARKET
      1. ESTIMATES & FORECAST, BY VEHICLE TYPE, 2024–2030 (USD MILLION) 78
      2. TABLE
    124. REST OF ASIA-PACIFC: IN-WHEEL MOTOR MARKET ESTIMATES & FORECAST, BY PROPULSION
      1. TYPE, 2024–2030 (USD MILLION) 78
    125. REST OF ASIA-PACIFC: IN-WHEEL
    126. MOTOR MARKET ESTIMATES & FORECAST, BY COOLING TYPE, 2024–2030 (USD MILLION)
      1. 78
    127. REST OF ASIA-PACIFC: IN-WHEEL MOTOR MARKET ESTIMATES & FORECAST,
      1. BY MOTOR TYPE, 2024–2030 (USD MILLION) 79
    128. REST OF ASIA-PACIFC:
    129. IN-WHEEL MOTOR MARKET ESTIMATES & FORECAST, BY POWER OUTPUT, 2024–2030
      1. (USD MILLION) 79
    130. REST OF ASIA-PACIFC: IN-WHEEL MOTOR MARKET ESTIMATES
      1. & FORECAST, BY VEHICLE TYPE, 2024–2030 (USD MILLION) 79
      2. TABLE 86
    131. REST OF THE WORLD: IN-WHEEL MOTOR MARKET, BY REGION, 2024–2030 (USD MILLION)
      1. 80
    132. REST OF THE WORLD: IN-WHEEL MOTOR MARKET ESTIMATES & FORECAST,
      1. BY PROPULSION TYPE, 2024–2030 (USD MILLION) 80
    133. REST OF THE WORLD:
    134. IN-WHEEL MOTOR MARKET ESTIMATES & FORECAST, BY COOLING TYPE, 2024–2030
      1. (USD MILLION) 80
    135. REST OF THE WORLD: IN-WHEEL MOTOR MARKET ESTIMATES
      1. & FORECAST, BY MOTOR TYPE, 2024–2030 (USD MILLION) 81
    136. REST
    137. OF THE WORLD: IN-WHEEL MOTOR MARKET ESTIMATES & FORECAST, BY POWER OUTPUT, 2024–2030
      1. (USD MILLION) 81
    138. REST OF THE WORLD: IN-WHEEL MOTOR MARKET ESTIMATES
      1. & FORECAST, BY VEHICLE TYPE, 2024–2030 (USD MILLION) 81
      2. TABLE 92
    139. MIDDLE EAST & AFRICA: IN-WHEEL MOTOR MARKET ESTIMATES & FORECAST, BY PROPULSION
      1. TYPE, 2024–2030 (USD MILLION) 82
    140. MIDDLE EAST & AFRICA: IN-WHEEL
    141. MOTOR MARKET ESTIMATES & FORECAST, BY COOLING TYPE, 2024–2030 (USD MILLION)
      1. 82
    142. MIDDLE EAST & AFRICA: IN-WHEEL MOTOR MARKET ESTIMATES &
      1. FORECAST, BY MOTOR TYPE, 2024–2030 (USD MILLION) 83
    143. MIDDLE EAST
    144. & AFRICA: IN-WHEEL MOTOR MARKET ESTIMATES & FORECAST, BY POWER OUTPUT, 2024–2030
      1. (USD MILLION) 83
    145. MIDDLE EAST & AFRICA: IN-WHEEL MOTOR MARKET ESTIMATES
      1. & FORECAST, BY VEHICLE TYPE, 2024–2030 (USD MILLION) 83
      2. TABLE 97
    146. SOUTH AMERICA: IN-WHEEL MOTOR MARKET ESTIMATES & FORECAST, BY PROPULSION TYPE,
    147. SOUTH AMERICA: IN-WHEEL MOTOR MARKET
      1. ESTIMATES & FORECAST, BY COOLING TYPE, 2024–2030 (USD MILLION) 84
      2. TABLE
    148. SOUTH AMERICA: IN-WHEEL MOTOR MARKET ESTIMATES & FORECAST, BY MOTOR TYPE,
    149. SOUTH AMERICA: IN-WHEEL MOTOR MARKET
      1. ESTIMATES & FORECAST, BY POWER OUTPUT, 2024–2030 (USD MILLION) 85
      2. TABLE
    150. SOUTH AMERICA: IN-WHEEL MOTOR MARKET ESTIMATES & FORECAST, BY VEHICLE TYPE,
    151. PRODUCT DEVELOPMENT 88
      1. TABLE
    152. PARTNERSHIP 89
    153. MERGERS & ACQUISITIONS 89
    154. EXPANSION
      1. 89
    155. PROTEAN: PRODUCTS OFFERED 90
    156. PROTEAN: KEY DEVELOPMENTS
      1. 90
    157. NTN CORPORATION PRODUCTS OFFERED 93
    158. NTN CORPORATION
      1. KEY DEVELOPMENTS 94
    159. NSK LTD. PRODUCTS OFFERED 97
    160. NSK
      1. LTD. KEY DEVELOPMENTS 98
    161. TAJIMA MOTOR CORPORATION PRODUCTS OFFERED
      1. 99
    162. TAJIMA MOTOR CORPORATION KEY DEVELOPMENTS 99
    163. YASA
      1. LIMITED PRODUCTS OFFERED 100
    164. ECOMOVE PRODUCTS OFFERED 101
      1. TABLE
    165. ECOMOVE KEY DEVELOPMENTS 101
    166. ELAPHE LTD.: PRODUCTS OFFERED 102
    167. ELAPHE LTD.: KEY DEVELOPMENTS 102
    168. SCHAEFFLER AG: PRODUCTS/SOLUTIONS/SERVICES
      1. OFFERED 104
    169. ZIEHL-ABEGG SE.: PRODUCTS OFFERED 105
      1. TABLE 121
      2. PRINTED MOTOR WORKS: PRODUCTS OFFERED 106
    170. PRINTED MOTOR WORKS: KEY
      1. DEVELOPMENTS 106
    171. E-TRACTION B.V.: PRODUCTS OFFERED 107
      1. TABLE
    172. E-TRACTION B.V.: KEY DEVELOPMENTS 107
    173. DANA TM4 INC.: PRODUCTS
      1. OFFERED 108
    174. LIST OF FIGURES
    175. MARKET SYNOPSIS 15
    176. GLOBAL IN-WHEEL MOTOR MARKET ANALYSIS, BY PROPULSION TYPE 16
      1. FIGURE
    177. GLOBAL IN-WHEEL MOTOR MARKET ANALYSIS, BY COOLING TYPE 17
    178. GLOBAL
    179. IN-WHEEL MOTOR MARKET ANALYSIS, BY MOTOR TYPE 18
    180. GLOBAL IN-WHEEL MOTOR
    181. MARKET ANALYSIS, BY VEHICLE TYPE 19
    182. GLOBAL IN-WHEEL MOTOR MARKET ANALYSIS,
      1. BY POWER OUTPUT 20
    183. GLOBAL IN-WHEEL MOTOR MARKET ANALYSIS, BY REGION
      1. 21
    184. GLOBAL IN-WHEEL MOTOR MARKET: MARKET STRUCTURE 22
      1. FIGURE 9
      2. RESEARCH PROCESS OF MRFR 23
    185. MARKET DYNAMICS: GLOBAL IN-WHEEL MOTOR
      1. MARKET 29
    186. DRIVER IMPACT ANALYSIS: GLOBAL IN-WHEEL MOTOR MARKET 31
    187. RESTRAINT IMPACT ANALYSIS: GLOBAL IN-WHEEL MOTOR MARKET 32
      1. FIGURE
    188. PORTER’S FIVE FORCES ANALYSIS: GLOBAL IN-WHEEL MOTOR MARKET 37
      1. FIGURE
    189. SUPPLY CHAIN ANALYSIS: GLOBAL IN-WHEEL MOTOR MARKET 39
    190. GLOBAL
    191. IN-WHEEL MOTOR MARKET, BY PROPULSION TYPE, 2020 (% SHARE) 41
    192. GLOBAL
    193. IN-WHEEL MOTOR MARKET, BY COOLING TYPE, 2020 (% SHARE) 43
    194. GLOBAL
    195. IN-WHEEL MOTOR MARKET, BY MOTOR TYPE, 2020 (% SHARE) 45
    196. GLOBAL IN-WHEEL
    197. MOTOR MARKET, BY POWER OUTPUT, 2020 (% SHARE) 47
    198. GLOBAL IN-WHEEL
    199. MOTOR MARKET, BY VEHICLE TYPE, 2020 (% SHARE) 49
    200. GLOBAL IN-WHEEL
    201. MOTOR MARKET, BY REGION, 2020 (% SHARE) 51
    202. BENCHMARKING OF MAJOR
      1. COMPETITORS 87
    203. GLOBAL IN-WHEEL MOTOR MARKET SHARE ANALYSIS, 2020
      1. 88
    204. PROTEAN: SWOT ANALYSIS 91
    205. NTN CORPORATION FINANCIAL
      1. OVERVIEW SNAPSHOT 93
    206. NTN CORPORATION: SWOT ANALYSIS 94
      1. FIGURE
    207. NSK LTD. FINANCIAL OVERVIEW SNAPSHOT 97
    208. NSK LTD.: SWOT ANALYSIS
      1. 98
    209. SCHAEFFLER AG: FINANCIAL OVERVIEW SNAPSHOT 104

    In-wheel motor Market Segmentation

    Market Segmentation Overview

    • Detailed segmentation data will be available in the full report
    • Comprehensive analysis by multiple parameters
    • Regional and country-level breakdowns
    • Market size forecasts by segment
    Infographic

    Free Sample Request

    Kindly complete the form below to receive a free sample of this Report

    Get Free Sample

    Customer Strories

    “I am very pleased with how market segments have been defined in a relevant way for my purposes (such as "Portable Freezers & refrigerators" and "last-mile"). In general the report is well structured. Thanks very much for your efforts.”

    Victoria Milne

    Founder
    Case Study
    Chemicals and Materials