

Healthcare Market Segmentation
Healthcare By Product (USD Billion, 2025-2035)
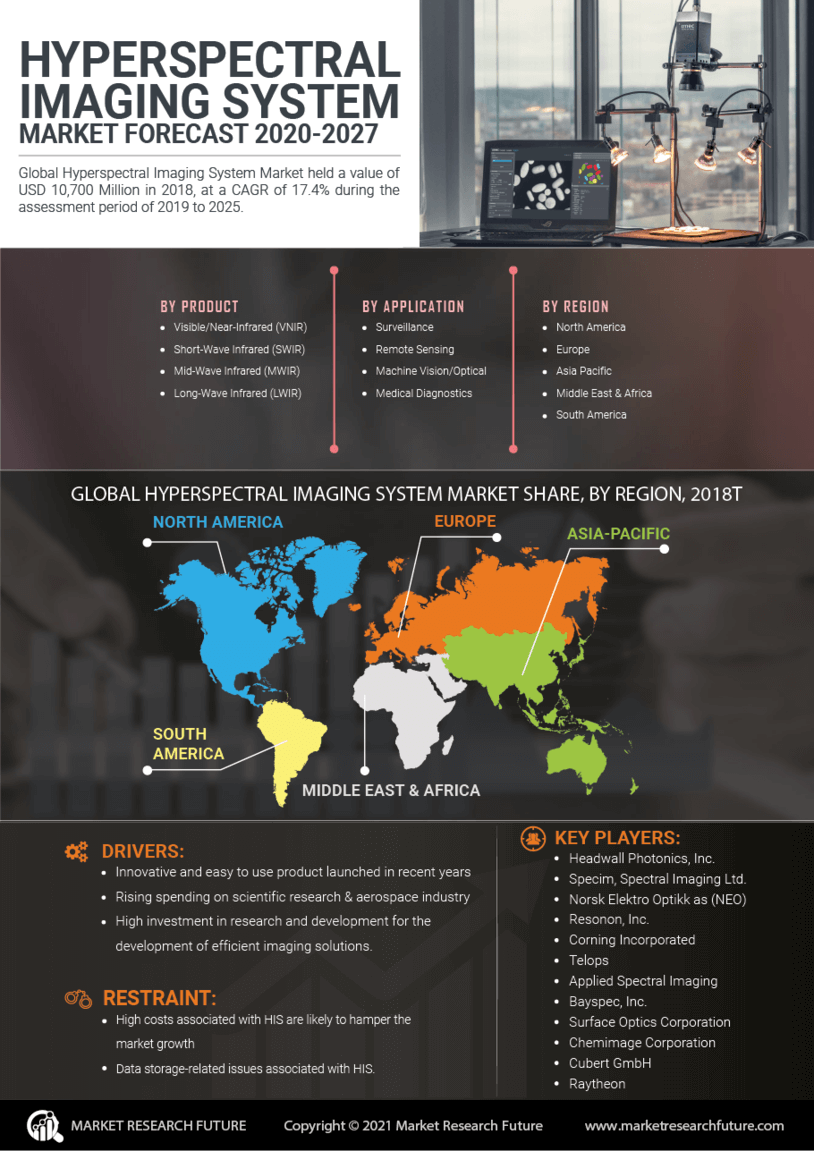
- Visible/Near-Infrared (VNIR)
- Short-Wave Infrared (SWIR)
- Mid-Wave Infrared (MWIR)
- Long-Wave Infrared (LWIR)
Healthcare By Application (USD Billion, 2025-2035)
- Surveillance
- Remote Sensing
- Machine Vision/Optical
- Medical Diagnostics


