Hyaluronic Acid Market (2026 - 2035)

ID: MRFR/HC/5965-CR 143 Pages Vikita Thakur Last Updated: October 17, 2026
Hyaluronic Acid Market Size, Growth Research Report By Grade (Pharmaceutical Grade, Food Grade, and Cosmetic Grade), By Form (Solid, and Liquid), By Application (Pharmaceuticals (Ophthalmology, Orthopedics, and Dermatology), Cosmetics, and Food & Beverages), By Region (North America, Europe, Asia-Pacific, And Rest of The World) –Competitor Industry Analysis and Trends Forecast Till 2035
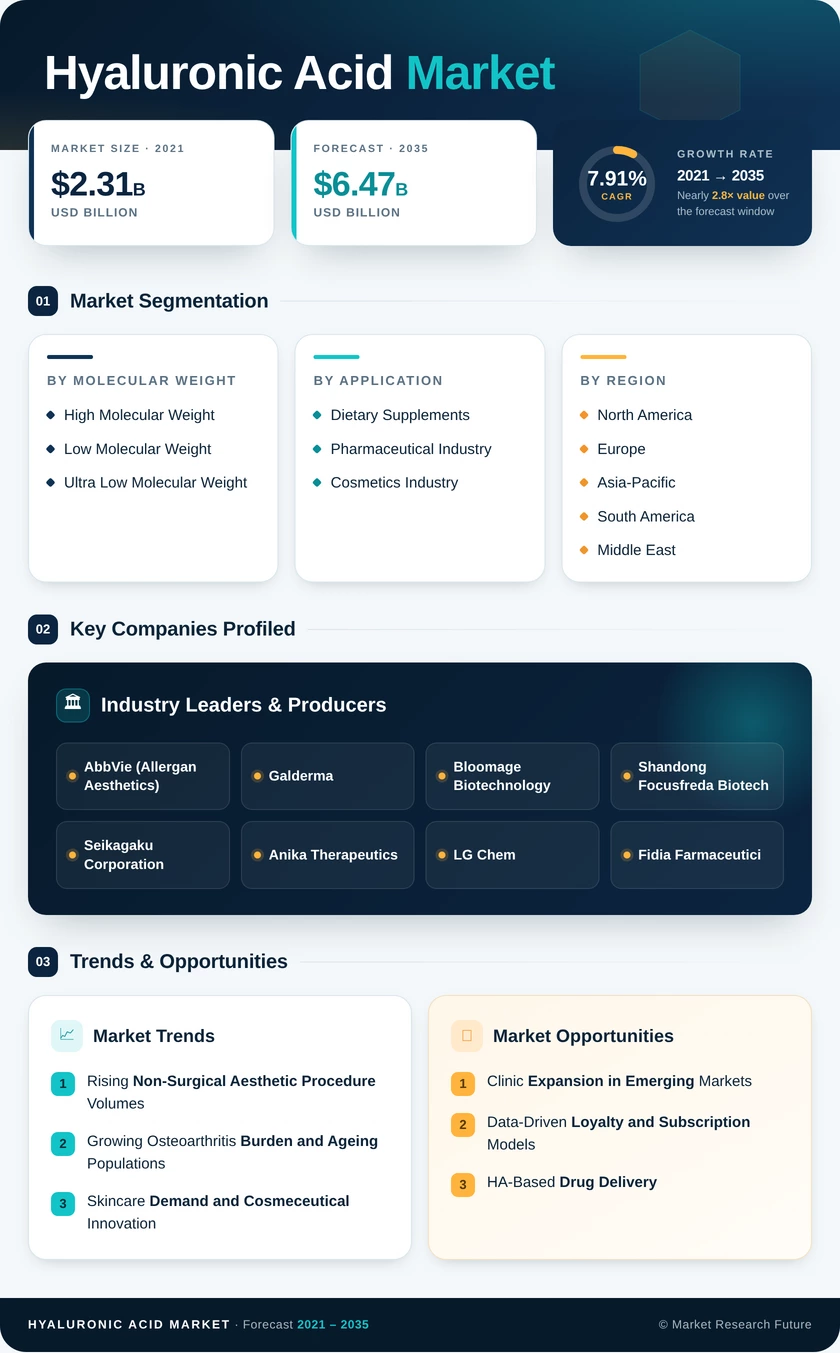
Hyaluronic Acid Market
Market Size
Forecast Period2026-2035
CAGR (2026-2035)7.91%
2025 Market SizeUSD 3.02 Billion
2035 Market SizeUSD 6.47 Billion
Key Players
AbbVie
Galderma
Bloomage Biotechnology
Shandong Focusfreda Biotech
Seikagaku Corporation
Anika Therapeutics
Opportunities
  • Clinic Expansion in Emerging Markets
  • Data-Driven Loyalty and Subscription Models
  • HA-Based Drug Delivery
  1. 1 Market Summary | |
  2. 2 Key Report Takeaways | |
    1. 2.1 By Molecular Weight | |
    2. 2.2 By Application | |
    3. 2.3 By Region | |
  3. 3 Market Size and Forecast (2021–2035) | |
  4. 4 Driver Impact Analysis | |
    1. 4.1 Rising Non-Surgical Aesthetic Procedure Volumes | |
    2. 4.2 Growing Osteoarthritis Burden and Ageing Populations | |
    3. 4.3 Skincare Demand and Cosmeceutical Innovation | |
    4. 4.4 Fermentation Scale-Up Lowering Ingredient Cost | |
    5. 4.5 Ophthalmic Surgery Volumes | |
    6. 4.6 Regulatory Approval of New Indications | |
  5. 5 Restraints Impact Analysis | |
    1. 5.1 Adverse Events and Counterfeit Products | |
    2. 5.2 Weak Clinical Guidance for Viscosupplementation | |
    3. 5.3 Tighter Medical Device Regulation in Europe | |
    4. 5.4 Raw-Material Price Competition | |
    5. 5.5 Competition from Alternative Injectables | |
  6. 6 Opportunities | |
    1. 6.1 Clinic Expansion in Emerging Markets | |
    2. 6.2 Data-Driven Loyalty and Subscription Models | |
    3. 6.3 HA-Based Drug Delivery | |
    4. 6.4 Ophthalmic and Dry-Eye Products | |
    5. 6.5 Nutricosmetics and Oral Supplements | |
  7. 7 Regional Market Share and Country-Level Analysis | |
    1. 7.1 North America | | |
      1. 7.1.1 US | | |
      2. 7.1.2 Canada | | |
      3. 7.1.3 Mexico | |
    2. 7.2 Europe | | |
      1. 7.2.1 Germany | | |
      2. 7.2.2 UK | | |
      3. 7.2.3 France | | |
      4. 7.2.4 Italy | | |
      5. 7.2.5 Spain | | |
      6. 7.2.6 Nordic Countries | | |
      7. 7.2.7 Russia | | |
      8. 7.2.8 Rest of Europe | |
    3. 7.3 Asia-Pacific | | |
      1. 7.3.1 China | | |
      2. 7.3.2 India | | |
      3. 7.3.3 Japan | | |
      4. 7.3.4 South Korea | | |
      5. 7.3.5 ASEAN | | |
      6. 7.3.6 Rest of Asia-Pacific | |
    4. 7.4 South America | | |
      1. 7.4.1 Brazil | | |
      2. 7.4.2 Argentina | | |
      3. 7.4.3 Rest of South America | |
    5. 7.5 Middle East and Africa | | |
      1. 7.5.1 Saudi Arabia | | |
      2. 7.5.2 UAE | | |
      3. 7.5.3 South Africa | | |
      4. 7.5.4 Egypt | | |
      5. 7.5.5 Rest of MEA | |
  8. 8 Future Outlook (2026–2035) | |
    1. 8.1 AI-Guided Diagnostics and Personalized Treatment | |
    2. 8.2 Synthetic Biology and Precision Manufacturing | |
    3. 8.3 Demographic Ageing and Medical Indications | |
    4. 8.4 Sustainability and Claim Substantiation | |
  9. 9 Segmentation Analysis | |
    1. 9.1 By Molecular Weight | | |
      1. 9.1.1 High Molecular Weight | | |
      2. 9.1.2 Low Molecular Weight | | |
      3. 9.1.3 Ultra Low Molecular Weight | |
    2. 9.2 By Application | | |
      1. 9.2.1 Dietary Supplements | | |
      2. 9.2.2 Pharmaceutical Industry | | |
      3. 9.2.3 Cosmetics Industry | |
  10. 10 Competitive Landscape | |
  11. 11 Recent News & Developments | |
  12. 12 Report Scope and Methodology | |
  13. 13 Detailed Sources and Citations | |
  14. 14 Frequently Asked Questions (FAQs) | | LIST OF TABLES | |
  15. TABLE 1 Global HA Market Snapshot, 2025 and 2035 | |
  16. TABLE 2 Global HA Market Size & Forecast, by Revenue (USD billion), 2021–2035 | |
  17. TABLE 3 Driver Impact Analysis, 2026–2035 | |
  18. TABLE 4 Restraints Impact Analysis, 2026–2035 | |
  19. TABLE 5 Regional Summary, by Region, 2025 (USD billion / Share / CAGR) | |
  20. TABLE 6 North America, Country-Level Analysis, 2025–2035 | |
  21. TABLE 7 Europe, Country-Level Analysis, 2025–2035 | |
  22. TABLE 8 Asia-Pacific, Country-Level Analysis, 2025–2035 | |
  23. TABLE 9 South America, Country-Level Analysis, 2025–2035 | |
  24. TABLE 10 Middle East and Africa, Country-Level Analysis, 2025–2035 | |
  25. TABLE 11 Global HA Market, by Molecular Weight, 2025–2035 | |
  26. TABLE 12 Global HA Market, by Application, 2025–2035 | |
  27. TABLE 13 Competitive Benchmarking Matrix, 2025 | |
  28. TABLE 14 Report Scope and Methodology | |
  29. TABLE 15 Detailed Sources and Citations | |
  30. TABLE 16 Segmentation Quick Reference | | LIST OF FIGURES | |
  31. FIGURE 1 Market Dynamics Overview — Drivers, Restraints and Opportunities | |
  32. FIGURE 2 Industry Value Chain Analysis | |
  33. FIGURE 3 Porter's Five Forces Analysis | |
  34. FIGURE 4 Global HA Market Size Trend, 2021–2035 (USD billion) | |
  35. FIGURE 5 Market Share by Molecular Weight, 2025 (%) | |
  36. FIGURE 6 Market Share by Application, 2025 (%) | |
  37. FIGURE 7 Regional Market Share, 2025 (%) | |
  38. FIGURE 8 Country-Level Share within Each Region, 2025 (%) | |
  39. FIGURE 9 Competitive Landscape Positioning Matrix | |
  40. FIGURE 10 Estimated Revenue Share Ranges of Key Players, 2025

Segmentation Quick Reference

DimensionSub-SegmentsDominant SegmentFastest Growing Segment
By Molecular WeightHigh Molecular Weight; Low Molecular Weight; Ultra Low Molecular WeightHigh Molecular Weight (49.2% share)Ultra Low Molecular Weight (8.96% CAGR)
By ApplicationDietary Supplements; Pharmaceutical Industry; Cosmetics IndustryCosmetics Industry (70.3% share)Pharmaceutical Industry (9.22% CAGR)
By RegionNorth America; Europe; Asia-Pacific; South America; Middle East and AfricaAsia-Pacific (38.6% share)Asia-Pacific (38.6% share)


Market Segmentation Overview

By Molecular Weight

Sub-SegmentKey Trend
High Molecular WeightAnchors viscosupplements, volumizing fillers and surgical viscoelastics
Low Molecular WeightExpands in topical serums, wound care and oral supplements
Ultra Low Molecular WeightGains traction in transdermal delivery and nanocarrier formulations


High Molecular Weight leads with a 49.2% share because joint injections and structural fillers require its viscosity, elasticity and slow degradation. Ultra Low Molecular Weight grows fastest at an 8.96% CAGR, as its small chain length penetrates the epidermis and pairs with nanoparticle carriers in drug-delivery pipelines. Low Molecular Weight sits between them, serving formats where absorption matters more than volume.

By Application

Sub-SegmentKey Trend
Dietary SupplementsEncapsulated oral HA gains ground in joint and skin-moisture claims
Pharmaceutical IndustryNew indications in orthopedics, ophthalmology and oncology delivery
Cosmetics IndustryDaily-use skincare and clinic fillers sustain volume leadership.


The Cosmetics Industry dominates with a 70.3% share, combining mass-market hydration products with high-value clinic injectables backed by FDA indication approvals. The Pharmaceutical Industry grows fastest at a 9.22% CAGR, as viscosupplements, ophthalmic viscoelastics and CD44-targeted delivery programs demand tightly specified pharmaceutical-grade material. Dietary Supplements remain the smallest application but benefit from functional-claim frameworks in Japan and Korea.




Download PDF ×

We do not share your information with anyone. However, we may send you emails based on your report interest from time to time. You may contact us at any time to opt-out.