ID: MRFR/HC/5965-CR | August 2021 | Region: Global | 161 Pages
Table of Content
LIST OF CONTENTS
1 EXECUTIVE SUMMARY 16
2 MARKET INTRODUCTION 18
2.1 SCOPE OF THE STUDY 18
2.2 RESEARCH OBJECTIVE 18
2.3 MARKET STRUCTURE 18
2.4 ASSUMPTIONS & LIMITATIONS 19
3 RESEARCH METHODOLOGY 20
3.1 DATA MINING 20
3.2 SECONDARY RESEARCH 21
3.3 PRIMARY RESEARCH 22
3.4 BREAKDOWN OF PRIMARY RESPONDENTS 23
3.5 FORECASTING TECHNIQUES 24
3.6 RESEARCH METHODOLOGY FOR MARKET SIZE ESTIMATION 25
3.6.1 BOTTOM-UP APPROACH 26
3.6.2 TOP-DOWN APPROACH 26
3.7 DATA TRIANGULATION 27
3.8 VALIDATION 27
4 MARKET DYNAMICS 28
4.1 INTRODUCTION 28
4.2 DRIVERS 29
4.2.1 INCREASING APPLICATION OF HYALURONIC ACID IN COSMETIC & PERSONAL CARE PRODUCTS 29
4.2.2 INCREASING NUMBER OF COSMETIC SURGERIES 31
4.2.3 EXTENSIVE USE OF HYALURONIC ACID IN THE TREATMENT OF OSTEOARTHRITIS AND DRY EYE 32
4.3 RESTRAINTS 33
4.3.1 AVAILABILITY OF SUBSTITUTES 33
4.4 OPPORTUNITY 34
4.4.1 EXTENSIVE R&D ASSOCIATED WITH HYALURONIC ACID 34
4.5 TREND 35
4.5.1 USE OF HYALURONIC ACID AS AN ANIMAL SUPPLEMENT 35
5 MARKET FACTOR ANALYSIS 36
5.1 SUPPLY CHAIN ANALYSIS 36
5.1.1 RAW MATERIAL SUPPLIERS 37
5.1.2 HYALURONIC ACID PRODUCERS 37
5.1.3 DISTRIBUTION & SALES CHANNEL 37
5.1.4 END USERS 38
5.2 PORTERβS FIVE FORCES MODEL 38
5.2.1 BARGAINING POWER OF SUPPLIERS 39
5.2.2 BARGAINING POWER OF BUYERS 39
5.2.3 THREAT OF NEW ENTRANTS 39
5.2.4 THREAT OF SUBSTITUTES 39
5.2.5 INTENSITY OF RIVALRY 39
5.3 COVID-19 IMPACT ANALYSIS 40
5.3.1 IMPACT ON GROWTH RATE 40
5.3.2 IMPACT ON MAJOR PLAYERS 40
5.3.3 IMPACT ON PREFERENCE OF CUSTOMERS 40
5.3.4 IMPACT ON AESTHETIC INDUSTRY 42
6 GLOBAL HYALURONIC ACID MARKET, BY GRADE 43
6.1 OVERVIEW 43
6.2 COSMETIC GRADE 45
6.3 PHARMACEUTICAL GRADE 46
6.4 FOOD GRADE 47
7 GLOBAL HYALURONIC ACID MARKET, BY APPLICATION 48
7.1 OVERVIEW 48
7.2 AESTHETICS 49
7.3 OSTEOARTHRITIS 50
7.4 PHARMACEUTICAL API 51
7.5 COSMETICS 52
7.6 DIETARY SUPPLEMENTS 53
7.7 OPHTHALMOLOGY 54
7.8 OTHERS 54
8 GLOBAL HYALURONIC ACID MARKET, BY END USER 56
8.1 OVERVIEW 56
8.2 PHARMACEUTICAL INDUSTRY 58
8.3 DERMATOLOGY CLINICS & COSMETIC SURGERY CENTERS 59
8.4 FOOD INDUSTRY 60
8.5 PERSONAL CARE 61
8.6 OTHERS 61
9 GLOBAL HYALURONIC ACID MARKET, BY REGION 63
9.1 OVERVIEW 63
9.2 NORTH AMERICA 65
9.2.1 US 67
9.2.2 CANADA 69
9.3 EUROPE 71
9.3.1 FRANCE 74
9.3.2 GERMANY 75
9.3.3 UK 77
9.3.4 SPAIN 78
9.3.5 ITALY 80
9.3.6 RUSSIA 81
9.3.7 BELGIUM 83
9.3.8 POLAND 84
9.3.9 REST OF EUROPE 86
9.4 ASIA-PACIFIC 88
9.4.1 CHINA 91
9.4.2 JAPAN 92
9.4.3 INDIA 94
9.4.4 SOUTH KOREA 95
9.4.5 AUSTRALIA 97
9.4.6 THAILAND 98
9.4.7 INDONESIA 100
9.4.8 REST OF ASIA-PACIFIC 101
9.5 LATIN AMERICA 103
9.5.1 BRAZIL 105
9.5.2 MEXICO 107
9.5.3 ARGENTINA 108
9.5.4 REST OF LATIN AMERICA 110
9.6 MIDDLE EAST & AFRICA 112
9.6.1 SAUDI ARABIA 115
9.6.2 UAE 116
9.6.3 TURKEY 118
9.6.4 SOUTH AFRICA 119
9.6.5 ISRAEL 121
9.6.6 REST OF THE MIDDLE EAST &AFRICA 122
10 COMPETITIVE LANDSCAPE 124
10.1 OVERVIEW 124
10.2 COMPETITIVE BENCHMARKING 125
10.3 MAJOR GROWTH STRATEGY IN THE GLOBAL HYALURONIC ACID MARKET 127
10.4 LEADING PLAYERS IN TERMS OF NUMBER OF DEVELOPMENTS 128
10.5 KEY DEVELOPMENTS & GROWTH STRATEGIES 129
10.5.1 JOINT VENTURES & AGREEMENTS 130
10.5.2 MARKETING STRATEGY 130
10.5.3 MERGERS&ACQUISITIONS 130
10.6 FINANCIAL MATRIX 131
11 COMPANY PROFILES 132
11.1 ALLERGAN PLC 132
11.1.1 COMPANY OVERVIEW 132
11.1.2 FINANCIAL OVERVIEW 133
11.1.3 PRODUCTS/SERVICES OFFERED 133
11.1.4 KEY DEVELOPMENTS 134
11.1.5 SWOT ANALYSIS 134
11.1.6 KEY STRATEGIES 135
11.2 CONTIPRO AS. 136
11.2.1 COMPANY OVERVIEW 136
11.2.2 FINANCIAL OVERVIEW 136
11.2.3 PRODUCTS OFFERED 136
11.2.4 KEY DEVELOPMENTS 137
11.2.5 SWOT ANALYSIS 137
11.2.6 KEY STRATEGIES 137
11.3 SYMATESE 138
11.3.1 COMPANY OVERVIEW 138
11.3.2 FINANCIAL OVERVIEW 138
11.3.3 PRODUCTS OFFERED 138
11.3.4 KEY DEVELOPMENTS 138
11.3.5 SWOT ANALYSIS 139
11.3.6 KEY STRATEGIES 139
11.4 ZHONGLAN INDUSTRY CO., LTD. 140
11.4.1 COMPANY OVERVIEW 140
11.4.2 FINANCIAL OVERVIEW 140
11.4.3 PRODUCTS OFFERED 140
11.4.4 KEY DEVELOPMENTS 140
11.4.5 SWOT ANALYSIS 141
11.4.6 KEY STRATEGIES 141
11.5 ALTERGON ITALIA SRL 142
11.5.1 COMPANY OVERVIEW 142
11.5.2 FINANCIAL OVERVIEW 142
11.5.3 PRODUCTS OFFERED 142
11.5.4 KEY DEVELOPMENTS 142
11.5.5 SWOT ANALYSIS 143
11.5.6 KEY STRATEGIES 143
11.6 FIDIA FARMACEUTICI S.P.A. 144
11.6.1 COMPANY OVERVIEW 144
11.6.2 FINANCIAL OVERVIEW 144
11.6.3 PRODUCTS OFFERED 144
11.6.4 KEY DEVELOPMENTS 144
11.6.5 SWOT ANALYSIS 145
11.6.6 KEY STRATEGIES 145
11.7 BIOIBERICA SAU. 146
11.7.1 COMPANY OVERVIEW 146
11.7.2 FINANCIAL OVERVIEW 146
11.7.3 PRODUCTS OFFERED 146
11.7.4 KEY DEVELOPMENTS 146
11.7.5 SWOT ANALYSIS 147
11.7.6 KEY STRATEGIES 147
11.8 KEWPIE CORPORATION 148
11.8.1 COMPANY OVERVIEW 148
11.8.2 FINANCIAL OVERVIEW 148
11.8.3 PRODUCTS OFFERED 149
11.8.4 KEY DEVELOPMENTS 149
11.8.5 SWOT ANALYSIS 150
11.8.6 KEY STRATEGIES 150
11.9 SEIKAGAKU CORPORATION 151
11.9.1 COMPANY OVERVIEW 151
11.9.2 FINANCIAL OVERVIEW 152
11.9.3 PRODUCTS OFFERED 153
11.9.4 KEY DEVELOPMENTS 153
11.9.5 SWOT ANALYSIS 154
11.9.6 KEY STRATEGIES 154
11.10 ANIKA THERAPEUTICS 155
11.10.1 COMPANY OVERVIEW 155
11.10.2 FINANCIAL OVERVIEW 156
11.10.3 PRODUCTS/SERVICES OFFERED 157
11.10.4 KEY DEVELOPMENTS 157
11.10.5 SWOT ANALYSIS 158
11.10.6 KEY STRATEGIES 158
12 APPENDIX 159
12.1 REFERENCES 159
12.2 RELATED REPORTS 160
LIST OF TABLES
TABLE 1 LIST OF ASSUMPTIONS & LIMITATIONS 19
TABLE 2 PRIMARY INTERVIEWS AND INFORMATION GATHERING PROCESS 22
TABLE 3 GLOBAL HYALURONIC ACID MARKET, BY GRADE, 2018β2027 (USD MILLION) 44
TABLE 4 GLOBAL HYALURONIC ACID MARKET FOR COSMETIC GRADE, BY REGION, 2018β2027 (USD MILLION) 45
TABLE 5 GLOBAL HYALURONIC ACID MARKET FOR PHARMACEUTICAL GRADE, BY REGION, 2018β2027 (USD MILLION) 46
TABLE 6 GLOBAL HYALURONIC ACID MARKET FOR FOOD-GRADE, BY REGION, 2018β2027 (USD MILLION) 47
TABLE 7 GLOBAL HYALURONIC ACID MARKET, BY APPLICATION, 2018β2027 (USD MILLION) 49
TABLE 8 GLOBAL HYALURONIC ACID MARKET FOR AESTHETICS, BY REGION, 2018β2027 (USD MILLION) 49
TABLE 9 GLOBAL HYALURONIC ACID MARKET FOR OSTEOARTHRITIS, BY REGION, 2018β2027 (USD MILLION) 50
TABLE 10 GLOBAL HYALURONIC ACID MARKET FOR PHARMACEUTICAL API, BY REGION, 2018β2027 (USD MILLION) 51
TABLE 11 GLOBAL HYALURONIC ACID MARKET FOR COSMETICS, BY REGION, 2018β2027 (USD MILLION) 52
TABLE 12 GLOBAL HYALURONIC ACID MARKET FOR DIETARY SUPPLEMENTS, BY REGION, 2018β2027 (USD MILLION) 53
TABLE 13 GLOBAL HYALURONIC ACID MARKET FOR OPHTHALMOLOGY, BY REGION, 2018β2027 (USD MILLION) 54
TABLE 14 GLOBAL HYALURONIC ACID MARKET, BY OPHTHALMOLOGY, FOR TYPE, 2018β2027 (USD MILLION) 54
TABLE 15 GLOBAL HYALURONIC ACID MARKET FOR OTHERS, BY REGION, 2018β2027 (USD MILLION) 55
TABLE 16 GLOBAL HYALURONIC ACID MARKET, BY END USER, 2018β2027 (USD MILLION) 57
TABLE 17 GLOBAL HYALURONIC ACID MARKET FOR PHARMACEUTICAL INDUSTRY, BY REGION, 2018β2027 (USD MILLION) 58
TABLE 18 GLOBAL HYALURONIC ACID MARKET FOR DERMATOLOGY CLINICS & COSMETIC SURGERY CENTERS, BY REGION, 2018β2027 (USD MILLION) 59
TABLE 19 GLOBAL HYALURONIC ACID MARKET FOR FOOD INDUSTRY, BY REGION, 2018β2027 (USD MILLION) 60
TABLE 20 GLOBAL HYALURONIC ACID MARKET FOR PERSONAL CARE, BY REGION, 2018β2027 (USD MILLION) 61
TABLE 21 GLOBAL HYALURONIC ACID MARKET FOR OTHERS, BY REGION, 2018β2027 (USD MILLION) 61
TABLE 22 GLOBAL HYALURONIC ACID MARKET, BY REGION, 2018β2027 (USD MILLION) 64
TABLE 23 NORTH AMERICA: HYALURONIC ACID MARKET, BY COUNTRY, 2018β2027 (USD MILLION) 65
TABLE 24 NORTH AMERICA: HYALURONIC ACID MARKET, BY GRADE, 2018β2027 (USD MILLION) 66
TABLE 25 NORTH AMERICA: HYALURONIC ACID MARKET, BY APPLICATION, 2018β2027 (USD MILLION) 66
TABLE 26 NORTH AMERICA: HYALURONIC ACID MARKET, BY END USER, 2018β2027 (USD MILLION) 67
TABLE 27 US: HYALURONIC ACID MARKET, BY GRADE, 2018β2027 (USD MILLION) 67
TABLE 28 US: HYALURONIC ACID MARKET, BY APPLICATION, 2018β2027 (USD MILLION) 68
TABLE 29 US: HYALURONIC ACID MARKET, BY END USER, 2018β2027 (USD MILLION) 68
TABLE 30 CANADA: HYALURONIC ACID MARKET, BY GRADE, 2018β2027 (USD MILLION) 69
TABLE 31 CANADA: HYALURONIC ACID MARKET, BY APPLICATION, 2018β2027 (USD MILLION) 69
TABLE 32 CANADA: HYALURONIC ACID MARKET, BY END USER, 2018β2027 (USD MILLION) 70
TABLE 33 EUROPE: HYALURONIC ACID MARKET, BY COUNTRY, 2018β2027 (USD MILLION) 72
TABLE 34 EUROPE: HYALURONIC ACID MARKET, BY GRADE, 2018β2027 (USD MILLION) 72
TABLE 35 EUROPE: HYALURONIC ACID MARKET, BY APPLICATION, 2018β2027 (USD MILLION) 73
TABLE 36 EUROPE: HYALURONIC ACID MARKET, BY END USER, 2018β2027 (USD MILLION) 73
TABLE 37 FRANCE: HYALURONIC ACID MARKET, BY GRADE, 2018β2027 (USD MILLION) 74
TABLE 38 FRANCE: HYALURONIC ACID MARKET, BY APPLICATION, 2018β2027 (USD MILLION) 74
TABLE 39 FRANCE: HYALURONIC ACID MARKET, BY END USER, 2018β2027 (USD MILLION) 75
TABLE 40 GERMANY: HYALURONIC ACID MARKET, BY GRADE, 2018β2027 (USD MILLION) 75
TABLE 41 GERMANY: HYALURONIC ACID MARKET, BY APPLICATION, 2018β2027 (USD MILLION) 76
TABLE 42 GERMANY: HYALURONIC ACID MARKET, BY END USER, 2018β2027 (USD MILLION) 76
TABLE 43 UK: HYALURONIC ACID MARKET, BY GRADE, 2018β2027 (USD MILLION) 77
TABLE 44 UK: HYALURONIC ACID MARKET, BY APPLICATION, 2018β2027 (USD MILLION) 77
TABLE 45 UK: HYALURONIC ACID MARKET, BY END USER, 2018β2027 (USD MILLION) 78
TABLE 46 SPAIN: HYALURONIC ACID MARKET, BY GRADE, 2018β2027 (USD MILLION) 78
TABLE 47 SPAIN: HYALURONIC ACID MARKET, BY APPLICATION, 2018β2027 (USD MILLION) 79
TABLE 48 SPAIN: HYALURONIC ACID MARKET, BY END USER, 2018β2027 (USD MILLION) 79
TABLE 49 ITALY: HYALURONIC ACID MARKET, BY GRADE, 2018β2027 (USD MILLION) 80
TABLE 50 ITALY: HYALURONIC ACID MARKET, BY APPLICATION, 2018β2027 (USD MILLION) 80
TABLE 51 ITALY: HYALURONIC ACID MARKET, BY END USER, 2018β2027 (USD MILLION) 81
TABLE 52 RUSSIA: HYALURONIC ACID MARKET, BY GRADE, 2018β2027 (USD MILLION) 81
TABLE 53 RUSSIA: HYALURONIC ACID MARKET, BY APPLICATION, 2018β2027 (USD MILLION) 82
TABLE 54 RUSSIA: HYALURONIC ACID MARKET, BY END USER, 2018β2027 (USD MILLION) 82
TABLE 55 BELGIUM: HYALURONIC ACID MARKET, BY GRADE, 2018β2027 (USD MILLION) 83
TABLE 56 BELGIUM: HYALURONIC ACID MARKET, BY APPLICATION, 2018β2027 (USD MILLION) 83
TABLE 57 BELGIUM: HYALURONIC ACID MARKET, BY END USER, 2018β2027 (USD MILLION) 84
TABLE 58 POLAND: HYALURONIC ACID MARKET, BY GRADE, 2018β2027 (USD MILLION) 84
TABLE 59 POLAND: HYALURONIC ACID MARKET, BY APPLICATION, 2018β2027 (USD MILLION) 85
TABLE 60 POLAND: HYALURONIC ACID MARKET, BY END USER, 2018β2027 (USD MILLION) 85
TABLE 61 REST OF EUROPE: HYALURONIC ACID MARKET, BY GRADE, 2018β2027 (USD MILLION) 86
TABLE 62 REST OF EUROPE: HYALURONIC ACID MARKET, BY APPLICATION, 2018β2027 (USD MILLION) 86
TABLE 63 REST OF EUROPE: HYALURONIC ACID MARKET, BY END USER, 2018β2027 (USD MILLION) 87
TABLE 64 ASIA-PACIFIC: HYALURONIC ACID MARKET, BY COUNTRY, 2018β2027 (USD MILLION) 89
TABLE 65 ASIA-PACIFIC: HYALURONIC ACID MARKET, BY GRADE, 2018β2027 (USD MILLION) 89
TABLE 66 ASIA-PACIFIC: HYALURONIC ACID MARKET, BY APPLICATION, 2018β2027 (USD MILLION) 90
TABLE 67 ASIA-PACIFIC: HYALURONIC ACID MARKET, BY END USER, 2018β2027 (USD MILLION) 90
TABLE 68 CHINA: HYALURONIC ACID MARKET, BY GRADE, 2018β2027 (USD MILLION) 91
TABLE 69 CHINA: HYALURONIC ACID MARKET, BY APPLICATION, 2018β2027 (USD MILLION) 91
TABLE 70 CHINA: HYALURONIC ACID MARKET, BY END USER, 2018β2027 (USD MILLION) 92
TABLE 71 JAPAN: HYALURONIC ACID MARKET, BY GRADE, 2018β2027 (USD MILLION) 92
TABLE 72 JAPAN: HYALURONIC ACID MARKET, BY APPLICATION, 2018β2027 (USD MILLION) 93
TABLE 73 JAPAN: HYALURONIC ACID MARKET, BY END USER, 2018β2027 (USD MILLION) 93
TABLE 74 INDIA: HYALURONIC ACID MARKET, BY GRADE, 2018β2027 (USD MILLION) 94
TABLE 75 INDIA: HYALURONIC ACID MARKET, BY APPLICATION, 2018β2027 (USD MILLION) 94
TABLE 76 INDIA: HYALURONIC ACID MARKET, BY END USER, 2018β2027 (USD MILLION) 95
TABLE 77 SOUTH KOREA: HYALURONIC ACID MARKET, BY GRADE, 2018β2027 (USD MILLION) 95
TABLE 78 SOUTH KOREA: HYALURONIC ACID MARKET, BY APPLICATION, 2018β2027 (USD MILLION) 96
TABLE 79 SOUTH KOREA: HYALURONIC ACID MARKET, BY END USER, 2018β2027 (USD MILLION) 96
TABLE 80 AUSTRALIA: HYALURONIC ACID MARKET, BY GRADE, 2018β2027 (USD MILLION) 97
TABLE 81 AUSTRALIA: HYALURONIC ACID MARKET, BY APPLICATION, 2018β2027 (USD MILLION) 97
TABLE 82 AUSTRALIA: HYALURONIC ACID MARKET, BY END USER, 2018β2027 (USD MILLION) 98
TABLE 83 THAILAND: HYALURONIC ACID MARKET, BY GRADE, 2018β2027 (USD MILLION) 98
TABLE 84 THAILAND: HYALURONIC ACID MARKET, BY APPLICATION, 2018β2027 (USD MILLION) 99
TABLE 85 THAILAND: HYALURONIC ACID MARKET, BY END USER, 2018β2027 (USD MILLION) 99
TABLE 86 INDONESIA: HYALURONIC ACID MARKET, BY GRADE, 2018β2027 (USD MILLION) 100
TABLE 87 INDONESIA: HYALURONIC ACID MARKET, BY APPLICATION, 2018β2027 (USD MILLION) 100
TABLE 88 INDONESIA: HYALURONIC ACID MARKET, BY END USER, 2018β2027 (USD MILLION) 101
TABLE 89 REST OF ASIA-PACIFIC: HYALURONIC ACID MARKET, BY GRADE, 2018β2027 (USD MILLION) 101
TABLE 90 REST OF ASIA-PACIFIC: HYALURONIC ACID MARKET, BY APPLICATION, 2018β2027 (USD MILLION) 102
TABLE 91 REST OF ASIA-PACIFIC: HYALURONIC ACID MARKET, BY END USER, 2018β2027 (USD MILLION) 102
TABLE 92 LATIN AMERICA: HYALURONIC ACID MARKET, BY COUNTRY, 2018β2027 (USD MILLION) 104
TABLE 93 LATIN AMERICA: HYALURONIC ACID MARKET, BY GRADE, 2018β2027 (USD MILLION) 104
TABLE 94 LATIN AMERICA: HYALURONIC ACID MARKET, BY APPLICATION, 2018β2027 (USD MILLION) 104
TABLE 95 LATIN AMERICA: HYALURONIC ACID MARKET, BY END USER, 2018β2027 (USD MILLION) 105
TABLE 96 BRAZIL: HYALURONIC ACID MARKET, BY GRADE, 2018β2027 (USD MILLION) 105
TABLE 97 BRAZIL: HYALURONIC ACID MARKET, BY APPLICATION, 2018β2027 (USD MILLION) 106
TABLE 98 BRAZIL: HYALURONIC ACID MARKET, BY END USER, 2018β2027 (USD MILLION) 106
TABLE 99 MEXICO: HYALURONIC ACID MARKET, BY GRADE, 2018β2027 (USD MILLION) 107
TABLE 100 MEXICO: HYALURONIC ACID MARKET, BY APPLICATION, 2018β2027 (USD MILLION) 107
TABLE 101 MEXICO: HYALURONIC ACID MARKET, BY END USER, 2018β2027 (USD MILLION) 108
TABLE 102 ARGENTINA: HYALURONIC ACID MARKET, BY GRADE, 2018β2027 (USD MILLION) 108
TABLE 103 ARGENTINA: HYALURONIC ACID MARKET, BY APPLICATION, 2018β2027 (USD MILLION) 109
TABLE 104 ARGENTINA: HYALURONIC ACID MARKET, BY END USER, 2018β2027 (USD MILLION) 109
TABLE 105 REST OF LATIN AMERICA: HYALURONIC ACID MARKET, BY GRADE, 2018β2027 (USD MILLION) 110
TABLE 106 REST OF LATIN AMERICA: HYALURONIC ACID MARKET, BY APPLICATION, 2018β2027 (USD MILLION) 110
TABLE 107 REST OF LATIN AMERICA: HYALURONIC ACID MARKET, BY END USER, 2018β2027 (USD MILLION) 111
TABLE 108 MIDDLE EAST & AFRICA: HYALURONIC ACID MARKET, BY COUNTRY, 2018β2027 (USD MILLION) 113
TABLE 109 MIDDLE EAST & AFRICA: HYALURONIC ACID MARKET, BY GRADE, 2018β2027 (USD MILLION) 113
TABLE 110 MIDDLE EAST & AFRICA: HYALURONIC ACID MARKET, BY APPLICATION, 2018β2027 (USD MILLION) 114
TABLE 111 MIDDLE EAST & AFRICA: HYALURONIC ACID MARKET, BY END USER, 2018β2027 (USD MILLION) 114
TABLE 112 SAUDI ARABIA: HYALURONIC ACID MARKET, BY GRADE, 2018β2027 (USD MILLION) 115
TABLE 113 SAUDI ARABIA: HYALURONIC ACID MARKET, BY APPLICATION, 2018β2027 (USD MILLION) 115
TABLE 114 SAUDI ARABIA: HYALURONIC ACID MARKET, BY END USER, 2018β2027 (USD MILLION) 116
TABLE 115 UAE: HYALURONIC ACID MARKET, BY GRADE, 2018β2027 (USD MILLION) 116
TABLE 116 UAE: HYALURONIC ACID MARKET, BY APPLICATION, 2018β2027 (USD MILLION) 117
TABLE 117 UAE: HYALURONIC ACID MARKET, BY END USER, 2018β2027 (USD MILLION) 117
TABLE 118 TURKEY: HYALURONIC ACID MARKET, BY GRADE, 2018β2027 (USD MILLION) 118
TABLE 119 TURKEY: HYALURONIC ACID MARKET, BY APPLICATION, 2018β2027 (USD MILLION) 118
TABLE 120 TURKEY: HYALURONIC ACID MARKET, BY END USER, 2018β2027 (USD MILLION) 119
TABLE 121 SOUTH AFRICA: HYALURONIC ACID MARKET, BY GRADE, 2018β2027 (USD MILLION) 119
TABLE 122 SOUTH AFRICA: HYALURONIC ACID MARKET, BY APPLICATION, 2018β2027 (USD MILLION) 120
TABLE 123 SOUTH AFRICA: HYALURONIC ACID MARKET, BY END USER, 2018β2027 (USD MILLION) 120
TABLE 124 ISRAEL: HYALURONIC ACID MARKET, BY GRADE, 2018β2027 (USD MILLION) 121
TABLE 125 ISRAEL: HYALURONIC ACID MARKET, BY APPLICATION, 2018β2027 (USD MILLION) 121
TABLE 126 ISRAEL: HYALURONIC ACID MARKET, BY END USER, 2018β2027 (USD MILLION) 122
TABLE 127 REST OF THE MIDDLE EAST & AFRICA: HYALURONIC ACID MARKET, BY GRADE, 2018β2027 (USD MILLION) 122
TABLE 128 REST OF THE MIDDLE EAST & AFRICA: HYALURONIC ACID MARKET, BY APPLICATION, 2018β2027 (USD MILLION) 123
TABLE 129 REST OF THE MIDDLE EAST & AFRICA: HYALURONIC ACID MARKET, BY END USER, 2018β2027 (USD MILLION) 123
TABLE 130 GLOBAL HYALURONIC ACID MARKET: COMPANY RANKING 126
TABLE 131 TOP PLAYERS IN TERMS OF NUMBER OF DEVELOPMENTS IN THE GLOBAL HYALURONIC ACID MARKET 128
TABLE 132 PRODUCT APPROVALS & PRODUCT LAUNCHES 129
TABLE 133 JOINT VENTURES & AGREEMENTS 130
TABLE 134 MARKETING STRATEGY 130
TABLE 135 MERGER & ACQUISITION 130
TABLE 136 ALLERGAN PLC: PRODUCTS/SERVICES OFFERED 133
TABLE 137 ALLERGAN: KEY DEVELOPMENTS 134
TABLE 138 CONTIPRO AS: PRODUCTS OFFERED 136
TABLE 139 CONTIPRO AS: KEY DEVELOPMENTS 137
TABLE 140 SYMATESE: PRODUCTS OFFERED 138
TABLE 141 SYMATESE: KEY DEVELOPMENTS 138
TABLE 142 ZHONGLAN INDUSTRY CO., LTD: PRODUCTS OFFERED 140
TABLE 143 ALTERGON ITALIA SRL: PRODUCTS OFFERED 142
TABLE 144 FIDIA FARMACEUTICI SPA: PRODUCTS OFFERED 144
TABLE 145 FIDIA FARMACEUTICI SPA: KEY DEVELOPMENTS 144
TABLE 146 BIOIBERICA SAU: PRODUCTS OFFERED 146
TABLE 147 BIOIBERICA SAU: KEY DEVELOPMENTS 146
TABLE 148 KEWPIE CORPORATION: PRODUCTS OFFERED 149
TABLE 149 SEIKAGAKU CORPORATION: PRODUCTS OFFERED 153
TABLE 150 SEIKAGAKU CORPORATION: KEY DEVELOPMENTS 153
TABLE 151 ANIKA THERAPEUTICS: PRODUCTS/SERVICES OFFERED 157
TABLE 152 ANIKA THERAPEUTICS: KEY DEVELOPMENTS 157
β
LIST OF FIGURES
FIGURE 1 MARKET SYNOPSIS 17
FIGURE 2 HYALURONIC ACID MARKET STRUCTURE 18
FIGURE 3 BOTTOM-UP AND TOP-DOWN APPROACHES 25
FIGURE 4 MARKET DYNAMICS OVERVIEW 28
FIGURE 5 TRADE DATA FOR SKINCARE PRODUCTS (USD MILLION) 29
FIGURE 6 GROWTH OF THE GLOBAL COSMETICS MARKET (%) 30
FIGURE 7 TOP 5 COUNTRIES FOR COSMETIC PROCEDURES, 2019 31
FIGURE 8 DRIVERS IMPACT ANALYSIS 33
FIGURE 9 RESTRAINT IMPACT ANALYSIS 34
FIGURE 10 SUPPLY CHAIN: GLOBAL HYALURONIC ACID MARKET 36
FIGURE 11 PORTER'S FIVE FORCES ANALYSIS: GLOBAL HYALURONIC ACID MARKET 38
FIGURE 12 GLOBAL HYALURONIC ACID MARKET SHARE, BY GRADE, 2020 (%) 43
FIGURE 13 GLOBAL HYALURONIC ACID MARKET, BY GRADE, 2020 & 2027 (USD MILLION) 44
FIGURE 14 GLOBAL HYALURONIC ACID MARKET SHARE, BY APPLICATION, 2020 (%) 48
FIGURE 15 GLOBAL HYALURONIC ACID MARKET, BY APPLICATION, 2020 & 2027 (USD MILLION) 48
FIGURE 16 GLOBAL HYALURONIC ACID MARKET SHARE, BY END USER, 2020 (%) 56
FIGURE 17 GLOBAL HYALURONIC ACID MARKET, BY END USER, 2020 & 2027 (USD MILLION) 57
FIGURE 18 GLOBAL HYALURONIC ACID MARKET SHARE, BY REGION, 2020 (%) 63
FIGURE 19 GLOBAL HYALURONIC ACID MARKET, BY REGION, 2020 & 2027 (USD MILLION) 64
FIGURE 20 NORTH AMERICA: HYALURONIC ACID MARKET, BY COUNTRY, 2020 & 2027 65
FIGURE 21 EUROPE: HYALURONIC ACID MARKET, BY COUNTRY, 2020 & 2027 71
FIGURE 22 ASIA-PACIFIC: HYALURONIC ACID MARKET, BY COUNTRY, 2020 & 2027 88
FIGURE 23 LATIN AMERICA: HYALURONIC ACID MARKET, BY COUNTRY, 2020 & 2027 103
FIGURE 24 MIDDLE EAST &AFRICA: HYALURONIC ACID MARKET, BY COUNTRY, 2020 & 2027 112
FIGURE 25 BENCHMARKING OF MAJOR COMPETITORS 125
FIGURE 26 MAJOR STRATEGY ADOPTED BY KEY PLAYERS IN GLOBAL HYALURONIC ACID MARKET 127
FIGURE 27 GLOBAL HYALURONIC ACID MARKET, KEY DEVELOPMENTS & GROWTH STRATEGIES (%) 129
FIGURE 28 SALES, 2020 131
FIGURE 29 R&D EXPENDITURE, 2020 131
FIGURE 30 ALLERGAN PLC: FINANCIAL OVERVIEW SNAPSHOT 133
FIGURE 31 ALLERGAN: SWOT ANALYSIS 134
FIGURE 32 CONTIPRO AS: SWOT ANALYSIS 137
FIGURE 33 SYMATESE: SWOT ANALYSIS 139
FIGURE 34 ZHONGLAN INDUSTRY CO., LTD: SWOT ANALYSIS 141
FIGURE 35 ALTERGON ITALIA SRL: SWOT ANALYSIS 143
FIGURE 36 FIDIA FARMACEUTICI SPA: SWOT ANALYSIS 145
FIGURE 37 BIOIBERICA SAU: SWOT ANALYSIS 147
FIGURE 38 KEWPIE CORPORATION: FINANCIAL OVERVIEW SNAPSHOT 148
FIGURE 39 KEWPIE CORPORATION: SWOT ANALYSIS 150
FIGURE 40 SEIKAGAKU CORPORATION: FINANCIAL OVERVIEW SNAPSHOT 152
FIGURE 41 SEIKAGAKU CORPORATION: SWOT ANALYSIS 154
FIGURE 42 ANIKA THERAPEUTICS INC.: FINANCIAL OVERVIEW SNAPSHOT 156
FIGURE 43 ANIKA THERAPEUTICS INC.: SWOT ANALYSIS 158
$20,144.59 million
6.77%
North America
2020-2027
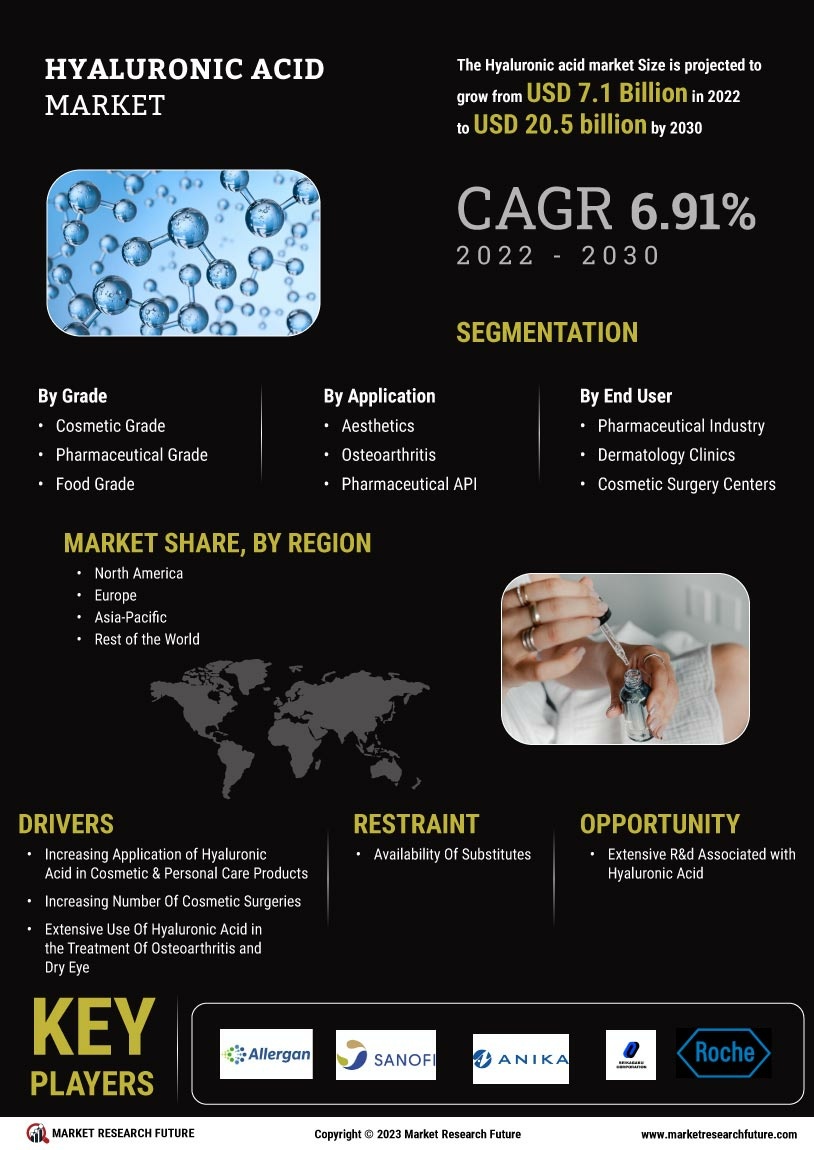
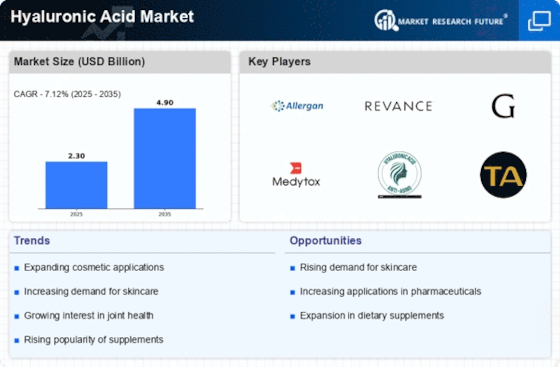
The hyaluronic acid market is expected to cross USD 20,144.59 million by 2027 at a CAGR of 6.77%.
Market Overview:
Hyaluronic acid, also called hyaluronan, is an anionic, nosulfated glycosaminoglycan distributed widely throughout connective, epithelial, and neural tissues.Hyaluronic acid is well known for its skin benefits, especially alleviating dry skin, reducing the appearance of fine lines and wrinkles, and speeding up wound healing. It can also help relieve joint pain in people with osteoarthritis.
The growth of the global hyaluronic acid marketis driven by the factors such as the increasing application of hyaluronic acid in cosmetic and personal care products. In addition, extensive research &development associated with hyaluronic acid create a lucrative opportunity for the market. However, the availability of alternatives3islikely to restrain the market growth.
COVID-19 Analysis:
The COVID-19 pandemic has affected the hyaluronic acid market dramatically. There are significant disturbances to the demand for the commodity across different end-use markets, with the global supply chains being disrupted and the manufacturers' hierarchy being modified. The lack of demand has rapidly caused an oversupply situation in the global chemical industry.
COVID-19 impacted the cosmetics market significantly, resulting in a decline of around 8% in the first two quarters, according to L'Oréal’s cosmetics market report 2020. However, according to the same report, the presence of e-commerce platforms helped soften the impact to some extent, with online cosmetic sales growing by around 40% in 2020 globally. The countries and various industries are trying to deal with the challenges caused by the novel coronavirus (COVID-19). Another industry surrounded by the uncertainty of the impact of the COVID-19 is medical aesthetics. Social distancing requirements and sharp cuts in consumers'discretionary income during the COVID-19 crisis have hit the medical aesthetics business hard. Many practices and medical spas are facing liquidity challenges. However, according to a report published by the American Society of Plastic Surgeons in April 2021, from a survey of 1000 women in the US, 70% of them were looking forward to having a cosmetic surgical procedure or minimally invasive procedure post-COVID-19. This demand shall help in the recovery of the market as the effects of COVID-19 waver off.
Market Dynamics:
Drivers
Hyaluronic acid is well known for its skin benefits, such as alleviating dry skin, reducing the appearance of fine lines, wrinkles, redness, and dermatitis. Hyaluronic acid helps to retain over 1,000 times its weight in water within the skin cells, making it an excellent moisturizer. It helps improve skin hydration and production of collagen, fight free radicals, and maintain skin elasticity. It also acts as a humectant, a category of hygroscopic skincare ingredient, which draws moisture from the surroundings.
A person loses collagen and hyaluronic acid naturally as he/she ages, and the skin becomes dehydrated easily. Climatic conditions, ultraviolet radiation, and pollution cause tiny breaks in the protective skin barrier, allowing water to escape, which increases the demand for hyaluronic acid. Hyaluronic acid supplements prevent water loss, thus giving the body an extra amount of hyaluronic acid to incorporate into the skin. An average dose of 120–240 mg per day for at least one month can help to increase the moisture of the skin significantly. It is widely used in personal care and cosmetic products such as facial creams, masks, serums, moisturizers, lipstick, eye shadow, foundation, shampoo, hair conditioner, styling gel, and others.
Restraints
Some of the substitutes for hyaluronic acid available in the market include rose oil, glycerine, tamarind extract, senna plant extract, and tremella mushroom extract. Rose oil is a natural substitute for hyaluronic acid. It is extremely hydrating and increases the permeability of the skin. Besides making the skin soft, supple, and plump, it also facilitates the absorption of skincare products into the skin, which consequently enhances the skin texture. Rose oil also acts as an anti-inflammatory agent due to its vitamin-packed properties and thus has theadded benefit of soothing redness.
Glycerine, much like hyaluronic acid, acts as a humectant, i.e., they attract and trap water. Glycerine, having a smaller molecular structure, gets absorbed deep into the skin while hyaluronic acid having a larger, molecular structure stays on the skin, making a layer-like structure. According to a report published in Healthline in 2019, glycerine was found to be a better humectant than hyaluronic acid as well. However, it must be used in correct proportions as usedin high concentrations may dry the skin.
Opportunities
According to an article published by Arianna Fallacara, Erika Baldini, Stefano Manfredini, and Silvia Vertuani in the MDPI journal in June 2018, hyaluronic acid is being studied across a variety of research areas. Hyaluronic acid and its derivatives are being used alone or in combination with other substances to develop pro-drugs, surface-modified liposomes, nanoparticles, microparticles, hydrogels, and other drug carriers. Hydrogels prepared from hyaluronic acid and theirchemical derivatives are 3D polymeric networks. They can be used in topical delivery of cells and many active ingredients, such as anti-inflammatories, anti-bacterial, antibodies, and proteins in general.
Supply Chain Analysis
The major stages in the supply chain are raw material suppliers, hyaluronic acid producers, distribution channels, and end users.
Microbial fermentation of hyaluronic acid is a new technique widely adopted nowadays, wherein hyaluronic acid is produced through Streptococcus zooepidemicus. The methodinvolves lower production costs and environmental pollution. The raw materials used during the fermentation of streptococci strain include peptone, glucose, yeast extract, as well as all the non-animal sources.
The distribution channel is a route through which goods and services from producers arrive at the intended consumer. Distribution channels can be short or long, depending on the number of intermediaries necessary to deliver a product or service. The distribution channel comprises distributors, suppliers, wholesalers, and e-commerce. The distributors are companies engaged in short- and long-term sales agreements with the end-use industries.The major end users of hyaluronic acid are dermatology clinics and cosmetic surgery centers, personal care, pharmaceutical, food industries, and others.
Segment Overview:
By Grade
Hyaluronic acid is used in cosmetics due to its moisturizing and film-forming properties. It enhances the appearance of dry or damaged skin by reducing flaking and restoring suppleness, thereby reducing the appearance of wrinkles,fine lines, redness, and dermatitis. Hyaluronic acid is also used to thicken the aqueous (water) portion of cosmetics and personal care products.
Pharmaceutical grade hyaluronic acid is used as a lubricating and moisturizing agent, limiting photo-aging, enhancing drug efficacy, tissue engineering, wound dressing applications, and promoting healing of the corneal and conjunctival injury. It is used in eye drops, eye lotions, and contactless solutions. Oral pharmaceutical preparations containing hyaluronic acid repair damaged mucous membrane or cartilage. It is also in intra-articular injection for joint pain and osteoarthritis.
The sodium salt of hyaluronic acid is used as a common ingredient in beverages, jelly, dairy products, cookies, candies, ice cream, among others. Food grade hyaluronic acid has a medium molecular weight, which is most suitable for internal support and supplementation compared to high molecular weight hyaluronic acid.
Global Hyaluronic Acid Market Share (%), by Grade, 2020
Source: MRFR Analysis
By Application
Hyaluronic acid is used to create a plumping effect. Dermatologists inject hyaluronic acid-based fillers to make the skin look firm. Botox and dermal filler treatments are commonly used in plastic surgeries. Women majorly undertake these surgeries to enhance their appearance. The different types of surgeries are facelift, skin resurfacing, and blepharoplasty among older women.
Hyaluronic acid products are used for the treatment of knee osteoarthritis (OA). The hyaluronic acid segment is likely to witness considerable market growth in the near future as it is a cost-effective and beneficial solution in pain relief. Knee osteoarthritis is one of the major causes of disability. Knee osteoarthritis is one of the most common orthopedic disorder and leading causes of disability among the geriatric population.
Hyaluronic acid as an Active Pharmaceutical Ingredient (API) is used to treat various joint disorders. The increasing prevalence of diseases and the growing geriatric population are expected to fuel the demand for pharmaceutical API in the market during the forecast period. According to the UN, the geriatric population is growing dramatically in countries such as Italy, the US, Japan, Germany, and Portugal. Europe has the largest aging population, which has increased the medical expenditure in the region.
Hyaluronic acid has significant skin benefits, such as reducing the appearance of fine lines, alleviating dry skin, wrinkles, redness, and dermatitis. It is widely used in personal care and cosmetics products such as facial creams, masks, serums, and moisturizers. Changing social preferences toward one's appearance and personality have increased the demand for healthy and glowing skin.
Hyaluronic acid helps to prevent aging-related health conditions. The standard proportion of hyaluronic acid required in a human body decreases with age, which increases the need for hyaluronic acid in dietary supplements. It is often used in animal dietary supplements, specifically for horses, to treat knee osteoarthritis. Further research is also going on for oral hyaluronic acid supplements for dogs.
Hyaluronic acid is used in surgeries as well as medicines, which deals with the diagnosis and treatment of eye disorders. It is used in the form of face cream, eye drops, and serums. It helps to cure dryeyes. It is found naturally in the skin, eyes, and joints, which function as lubricants in joints and moisture for the eyes.
The high demand for hyaluronic acid in animals and humans has forced industrial manufacturers to increase the production capacity. The established market players are highly contributing toward research and development of new hyaluronic acid new applications in the medical and cosmetic industries, in areas such as tissue engineering, drug delivery, etc.
By End User
Hyaluronic acid is used for the treatment of osteoarthritis and dry eye. It exhibits wound healing abilities in abrasions, post-operative scars, second- and third-degree burns, pressure sores, and external skin injuries. Additionally, it can be used for the prevention of bladder pain and urinary tract infection.
The use of hyaluronic acid in dermatology clinics & cosmetic surgery centers is a major driver of the global hyaluronic acid market. It is used as a dermal filler and lip filler in cosmetic surgeries. The increasing demand for these surgeries can be attributed to the impacts of media, fashion, and other cultural scenarios.
Beverages, jelly, dairy products, cookies, candies, ice creams, and others use hyaluronic acid as a common ingredient. The increasing demand for various dairy products such as milk, cheese, yogurt, and others across the globe has resulted in the growth of the global hyaluronic acid market.
Hyaluronic acid is widely used in a broad range of personal care & cosmetics products such as creams, emulsion, essence, lotions, gel, facial mask, lipstick, eye shadow, foundation, shampoo, hair conditioner, styling gel, hair restorer, body wash, and others.
The others segment of the global hyaluronic acid market includes its miscellaneous use in the prevention and treatment of symptoms related to connective tissue disorders such as fractures, hernias, glaucoma, keratoconus, temporomandibular joint, and vocal cord repair.
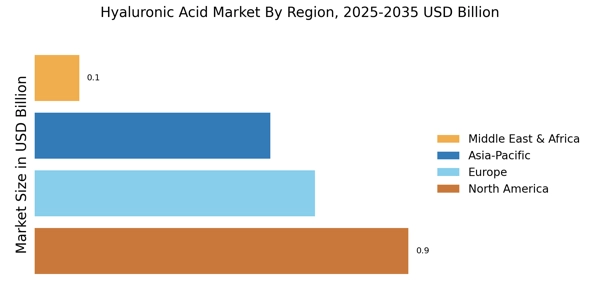
Global Hyaluronic Acid Market Share (%), by Region, 2020
Source: MRFR Analysis
Regional Analysis
The market in North America is expected to witness significant growth because of the high demand for the product in the pharmaceutical industry. The presence of a large pharmaceutical base in the US is a key driver for the growth of the regional market. According to the European Federation of Pharmaceutical Industries & Association (EFPIA), North America accounted for 48.7% of world pharmaceutical sales in 2019.
According to the EFPIA, Europe accounted for 22.9% of the overall pharmaceutical sales in 2019. In 2019, Europe invested an estimated USD 45,786 million in pharmaceutical R&D activities. The region produced pharmaceutical products worth USD 335,769 and exported products worth USD 579,965 million in 2019. Moreover, according to Cosmetics Europe (European trade association), Europe is the largest market for cosmetics and personal care products. A few countries such as Germany, France, the UK, Poland, and the UK hold the major market share in the region.
The growth of the pharmaceutical industry in the Asia-Pacific region is a prime factor driving the demand for the hyaluronic acid market. Countries such as China, India, and Japan are major contributors to the market growth. India emerged as the fastest growing country with a CAGR of 9.86% during the forecast period. According to the Indian Brand Equity Foundation, the Indian pharmaceutical industry is expected to register a CAGR of 22.4% and reached USD 55 billion in 2020. In addition, generic drugs hold the largest market share in the Indian pharmaceutical industry, followed by counter medicines and patented drugs.
Latin America has significant growth in the aging population. For instance, in 2018, the senior citizen population increased up to 71 million in this region, which is estimated to double by 2035. An increase in the aging population is expected to surge chronic diseases, positively impacting the hyaluronic acid market. The countries such as Chile, Peru, and Colombia are witnessing the highest healthcare expenses, registering a CAGR of 3.4% per year.
The Middle East & Africa is expected to register a CAGR of 4.67% during 2021–2027. The segment accounted for USD 800.75 million in 2020 and is expected to reach USD 1,104.82 million by 2027. The high prevalence of Non-communicable Diseases (NCDs), growing aging population, and increasing penetration of health insurance are some of the primary factors boosting the growth of the healthcare market in the Middle East & Africa.
Competitive Landscape
The global hyaluronic acid market is characterized by the presence of tier-1 and tier-2 companies. The market is highly competitive, with all the players competing to gain maximum market share. High investment in research & development of hyaluronic acid and limited government approval and license increases the intensity of rivalry among the players.
The growth of the market players is dependent on market and economic conditions and government regulations. Thus, the players should expand their distribution network to meet the demand and enhance their services. Allergan (Ireland), Contiproa.s. (Germany), Symatese Group (France), Zhonglan Industry Co., Ltd (China), Altergon Italia SRL (Italy), Fidia FarmaceuticiS.p.a (Italy), BioibericaS.A.U. (Spain), Kewpie Corporation (Japan), Seikagaku Corporation (Japan), and Anika Therapeutics Inc. (US) are the major companies in the global market at present, which are competing in terms of quality, price, and availability.
List of Key Companies Covered in this Report:
Recent Developments
Scope of the Report & Segmentation
Global Hyaluronic Acid Market, by Grade
Global Hyaluronic Acid Market, by Application
Global Hyaluronic Acid Market, by End User
Global Hyaluronic Acid Market, by Region
Report Overview:
The report contains:
Report Attribute/Metric | Details |
---|---|
Market Size | 2027 USD 4,510.12 Million |
CAGR | 6.77% |
Base Year | 2020 |
Forecast Period | 2021-2027 |
Historical Data | 2018-2019 |
Forecast Units | Value (USD Million) |
Report Coverage | Revenue Forecast, Competitive Landscape, Growth Factors, and Trends |
Segments Covered | Type,Application,and End User |
Geographies Covered | North America, Europe, Asia-Pacific, Latin America and the Middle East, and Africa |
Key Vendors | Allergan plc (Ireland), Contiproa.s. (Czechia), Symatese (France), Zhonglan Industry Co., Ltd (China), Altergon Italia Srl (Italy), Fidia Farmaceuticis.p.a. (Italy), Bioiberica S.A.U. (Barcelona), Kewpie Corporation's (Japan), Seikagaku Corporation (Japan), and Anika Therapeutics, Inc. (US) |
Key Market Opportunities | Extensive research and development associated with hyaluronic acid |
Key Market Drivers | Increasing application of hyaluronic acid in cosmetic and personal care, increasing number of cosmetic surgeries, extensive use of hyaluronic acid in the treatment of osteoarthritis and dry eye |
Frequently Asked Questions (FAQ) :
The global hyaluronic acid market is expected to expand at 6.77% CAGR from 2020 to 2027.
The global hyaluronic acid market size can reach USD 19,945.4 Million by 2027.
Rise in cosmetic surgeries is the major driver of the global hyaluronic acid market.
The Americas can contribute massively to the global hyaluronic acid market owing to the massive demand for hyaluronic acid in the pharmaceutical sector.
Anika Therapeutics, Seikagaku Corporation, Altergon Italia SRL, Allergan, Zhonglan Industry Co., Ltd, Contipro AS, Fidia Farmaceutici SPA, Bioiberica SAU, Kewpie Corporation, and Symatese Group are major players of the global hyaluronic acid market.