• Cat-intel
  • MedIntelliX
  • Resources
  • About Us
  • Hero Background
    English
    Chinese
    French
    Japanese
    Korean
    German
    Spanish

    High Purity Solvents Market Trends

    ID: MRFR/CnM/10367-HCR
    128 Pages
    Anshula Mandaokar
    October 2025

    High Purity Solvents Market Research Report Information By Type (Spectrophotometric Solvents, UHPLC and LC/MS Solvents, HPLC Solvents, GC Solvents), By Grade (ACS, Biosolv, Gcsolv, HPLC Grade, Omnisolv, Pestisolv, Purge & Trap, Spectrosolv, Tracegrade, USP, Ultratrace, Unisolv), By Category (Polar Solvent and Non-Polar Solvent), By Application (Liquid Crystals, Lithium Ion Batteries, Electr...

    Share:
    Download PDF ×

    We do not share your information with anyone. However, we may send you emails based on your report interest from time to time. You may contact us at any time to opt-out.

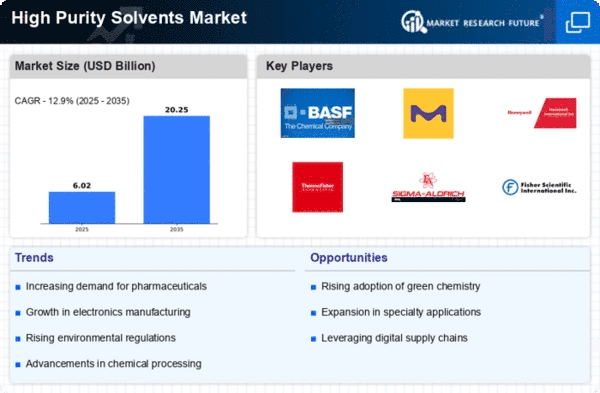
    High Purity Solvents Market Infographic
    $ 4,950.0
    $ 5,950.0
    $ 7,250.0

    Market Trends

    Key Emerging Trends in the High Purity Solvents Market

    The high-purity Purity Solvents Market is currently undergoing significant trends due to the rising demand for solvents that are pure and of high quality in different fields, such as pharmaceuticals, electronics, and analytical chemistry, among others. The critical processes, research, and production activities depend on high-purity solvents that have low impurities levels and are precise while being manufactured. An increased need for high-purity solvents has been observed in the pharmaceutical sector and biotechnology industries. Furthermore, manufacturers in the electronics industry have increased the usage of high-purity solvents. High-purity solvents are indispensable ingredients for producing semiconductors, printed circuit boards, and electronic components owing to the miniaturization of electronic components and the rising demand for cutting-edge electronic devices. Additionally, green and sustainable solvent innovations influence the market for high-purity solvents. Green manufacturers are focusing on renewable resources-based or environmentally friendly solvent production methods due to environmental concerns. Additionally; High purity solvent market growth also occurs within analytical chemistry. Applicable across diverse analytical techniques like mass spectrometry, chromatography, and spectroscopy where even the slightest trace impurities may compromise the accuracy or reliability of results. Precision and sensitivity driven by the analytical chemistry field also increase its requirements on HPS for optimum performance during laboratory analysis. This reflects a growing trend towards improved analytical techniques as well as higher standards. The market trends of high-purity solvents are largely shaped by government regulations relating to chemical purity, safety, and environmental impact. Solvent safe handling practices have been introduced globally by regulatory bodies so as to adopt the safe use of chemicals such as pharmaceuticals throughout, limit impurities level presence within chemical products, including medication, and encourage manufacturing practices that do not affect the environment negatively. However, there are some challenges, such as costs-related issues, competitive threats from substitute technologies to be faced and efficient recycling systems plus waste management. Providing superior-grade HPS, especially those that meet stringent criteria, can be more expensive than traditional solvents. This challenge requires strategic sourcing, efficient production processes, and economies of scale that will ensure competitiveness.

    Market Summary

    The Global High Purity Solvents Market is projected to grow significantly from 41.5 USD Billion in 2024 to 82.8 USD Billion by 2035.

    Key Market Trends & Highlights

    High Purity Solvents Key Trends and Highlights

    • The market is expected to experience a compound annual growth rate (CAGR) of 6.48% from 2025 to 2035.
    • By 2035, the market valuation is anticipated to reach 82.8 USD Billion, indicating robust growth potential.
    • In 2024, the market is valued at 41.5 USD Billion, reflecting a strong foundation for future expansion.
    • Growing adoption of high purity solvents due to increasing demand in pharmaceuticals is a major market driver.

    Market Size & Forecast

    2024 Market Size 41.5 (USD Billion)
    2035 Market Size 82.8 (USD Billion)
    CAGR (2025-2035) 6.48%
    Largest Regional Market Share in 2024 latin_america)

    Major Players

    Exxon Mobil Corporation, BASF SE, Asahi Kasei Corporation, Linde, Thermo Fisher Scientific Inc., High Purity Laboratory Chemicals Pvt. Ltd., Dow, Apchem Pvt. Ltd., Evonik Industries AG, Merck KGaA, Spectrum Chemical Manufacturing Corp., Central Drug House, Tedia, Mitsubishi Chemical Corporation, Akzo Nobel N.V.

    Market Trends

    Increasing use of n-heptane solvent as a test fuel component in anti-knock engine testing is driving the market growth

    Another important factor driving this market is the rising use of high purity solvents in the production of lab supplies for the life sciences sector. Demand is largely being driven by their use in the production of high performance coatings throughout geographies. The widespread use of these solvents may provide health risks, including toxicity to the nervous and reproductive systems, which may reduce consumer demand for the product and impede the expansion of the worldwide solvent market.

    As solvents are utilised in paint and coating applications in the construction, automotive, shipbuilding, and aircraft manufacturing industries, these industries' expansion has a significant impact on the market. Although the COVID-19 situation has had a significant negative impact on the market across various sectors, these sectors will eventually demonstrate a significant need for these high quality Solvents. Key companies in the global solvent market may benefit from the increased use of high purity solvents in perfumes. For producers of high purity solvents, the growing emphasis on the development and use of green and bio-based solvents can be a challenge.

    The market for high purity solvents is anticipated to increase in the future due to the rising demand for paints and coatings. Paints and coatings are mastic materials that are liquid, liquefiable, or solid before being applied in a thin layer to a surface. To dissolve various ingredients used in paint and coating compositions, high purity solvents are used. For instance, the US coating sector exported coating goods worth over $2.2 billion in June 2021, according to the American Coatings Association, a non-profit organisation with headquarters in the US.

    As a result, the market for high purity solvents is expanding due to the rising demand for paints and coatings.

    In the market for high purity solvents, the introduction of bio-derived products has become a major trend that is gaining popularity. To strengthen their position, major players in the high purity solvents industry are concentrating on developing bio-derived products. In order to actively combat climate change by removing fossil carbon from the value chain, Clariant, a speciality chemicals business with headquarters in Switzerland, introduced its new Vita 100% bio-based surfactants and polyethylene glycols (PEGS) in February 2022. Products from Vita have a Renewable Carbon Index of at least 98% and are produced using renewable feedstocks.

    The new Vita products help producers increase the bio-based carbon content of consumer goods including detergents, hair and body shampoo, industrial lubricants, paint, and crop formulations by being made for natural formulations with a high Renewable Carbon Index (RCI). Thus, driving the High Purity Solvents market revenue.

    The demand for high purity solvents is anticipated to rise as industries increasingly prioritize product quality and regulatory compliance, reflecting a broader trend towards enhanced operational standards.

    U.S. Environmental Protection Agency

    High Purity Solvents Market Market Drivers

    Market Growth Projections

    The Global High Purity Solvents Market Industry is projected to experience substantial growth over the next decade. With a market value of 41.5 USD billion in 2024, it is anticipated to reach 82.8 USD billion by 2035. This growth trajectory indicates a compound annual growth rate (CAGR) of 6.48% from 2025 to 2035. The increasing demand for high purity solvents across various industries, including pharmaceuticals, chemicals, and electronics, is a key driver of this growth. As industries continue to prioritize quality and compliance, the market for high purity solvents is likely to expand, reflecting the critical role these solvents play in modern manufacturing processes.

    Growth in Chemical Manufacturing

    The Global High Purity Solvents Market Industry is significantly influenced by the expansion of the chemical manufacturing sector. High purity solvents are integral to various chemical processes, including extraction, purification, and synthesis. As global chemical production is projected to grow, driven by increasing industrial activities and consumer demand, the need for high purity solvents is likely to rise. This growth is reflected in the anticipated market value of 82.8 USD billion by 2035, indicating a robust CAGR of 6.48% from 2025 to 2035. The chemical industry's reliance on high purity solvents for maintaining product quality and compliance with regulatory standards further underscores their importance.

    Rising Demand in Pharmaceuticals

    The Global High Purity Solvents Market Industry experiences a notable increase in demand driven by the pharmaceutical sector. High purity solvents are essential in the production of active pharmaceutical ingredients (APIs) and formulations. As the global pharmaceutical market is projected to reach approximately 1.5 trillion USD by 2024, the need for high-quality solvents is expected to grow correspondingly. This trend is further supported by the increasing focus on drug safety and efficacy, which necessitates the use of high purity solvents to minimize impurities. Consequently, the market for high purity solvents is anticipated to expand significantly, contributing to the overall market value of 41.5 USD billion in 2024.

    Regulatory Compliance and Quality Standards

    The Global High Purity Solvents Market Industry is significantly shaped by stringent regulatory compliance and quality standards across various sectors. Industries such as pharmaceuticals, food and beverage, and electronics are subject to rigorous regulations that mandate the use of high purity solvents to ensure product safety and quality. Compliance with these regulations not only protects consumer health but also enhances brand reputation. As regulatory bodies continue to enforce these standards, the demand for high purity solvents is expected to increase. This trend is likely to contribute to the market's growth, as companies prioritize the use of compliant solvents to meet both legal and consumer expectations.

    Technological Advancements in Solvent Production

    Technological innovations in the production of high purity solvents play a crucial role in the Global High Purity Solvents Market Industry. Advances in distillation, filtration, and purification techniques enhance the quality and efficiency of solvent production. These improvements not only reduce production costs but also ensure that solvents meet stringent regulatory requirements. As industries increasingly adopt these advanced technologies, the demand for high purity solvents is expected to rise. This trend is particularly evident in sectors such as electronics and biotechnology, where the need for ultra-pure solvents is paramount. The ongoing technological evolution is likely to bolster the market's growth trajectory.

    Emerging Applications in Electronics and Biotechnology

    The Global High Purity Solvents Market Industry is witnessing a surge in demand due to emerging applications in electronics and biotechnology. High purity solvents are critical in the manufacturing of semiconductors, electronic components, and biopharmaceuticals. As the electronics industry continues to evolve with advancements in technology, the need for ultra-pure solvents becomes increasingly vital to ensure product reliability and performance. Similarly, the biotechnology sector relies on high purity solvents for various applications, including research and development. This growing demand from diverse sectors is expected to drive the market's expansion, reflecting the versatility and essential nature of high purity solvents.

    Market Segment Insights

    High Purity Solvents Type Insights

    The High Purity Solvents Market segmentation, based on Type, includes spectrophotometric solvents, UHPLC and LC/MS solvents, HPLC solvents, GC solvents. Spectrophotometric Solvents segment dominated the global market in 2022. This is a result of the healthcare industry's increased usage of spectrophotometric solvents.

    High Purity Solvents Grade Insights

    The High Purity Solvents Market segmentation, based on Grade, includes ACS, biosolv, gcsolv, HPLC grade, omnisolv, pestisolv, purge & trap, spectrosolv, tracegrade, usp, ultratrace, unisolv. ACS segment dominated the global market in 2022. This is a result of the rising need for high purity ACS grade solvents.

    High Purity Solvents Category Insights

    The High Purity Solvents Market segmentation, based on Category, includes polar solvent and non-polar solvent. Polar solvent segment dominated the High Purity Solvents Market in 2022. The rising use of polar solvents in end-user industries is blamed for this rise.

    Figure 1: High Purity Solvents Market, by End User, 2022 & 2032 (USD Billion)

    Source: Secondary Research, Primary Research, Market Research Future Database and Analyst Review

    High Purity Solvents Application Insights

    The High Purity Solvents Market segmentation, based on Application, includes liquid crystals, lithium ion batteries, electroplating, resins, catalysts. Liquid crystals segment dominated the High Purity Solvents Market in 2022. The rising need for high purity solvents in liquid crystals can be linked to this.

    High Purity Solvents End User Insights

    The High Purity Solvents Market segmentation, based on End User, includes pharmaceutical and biopharmaceutical, chemical laboratories, cosmetics, food & beverage, agriculture, paints & coatings, biotechnology, electrical & electronics. Paints & coatings segment dominated the High Purity Solvents Market in 2022. Its high percentage can be attributed to the expansion of infrastructure and building projects in developing countries like China, Japan, and India.

    Get more detailed insights about High Purity Solvents Market Research Report—Global Forecast till 2032

    Regional Insights

    By region, the study provides the market insights into North America, Europe, Asia-Pacific and Rest of the World. The North America High Purity Solvents Market dominated this market in 2022 (45.80%). Due to increasing manufacturing output and anticipated recovery in construction activities throughout the projection period, this has occurred. Further, the U.S. High Purity Solvents market held the largest market share, and the Canada High Purity Solvents market was the fastest growing market in the North America region.

    Further, the major countries studied in the market report are The US, Canada, German, France, the UK, Italy, Spain, China, Japan, India, Australia, South Korea, and Brazil.

    Figure 2: HIGH PURITY SOLVENTS MARKET SHARE BY REGION 2022 (USD Billion)

    HIGH PURITY SOLVENTS MARKET SHARE BY REGION 2022

    Source: Secondary Research, Primary Research, Market Research Future Database and Analyst Review

    Europe High Purity Solvents market accounted for the healthy market share in 2022. As the automobile, aviation, and other end use industries resume their expansion following the epidemic, demand in this region is anticipated to increase at a good rate. Further, the German High Purity Solvents market held the largest market share, and the U.K High Purity Solvents market was the fastest growing market in the European region

    The Asia Pacific High Purity Solvents market is expected to register significant growth from 2023 to 2032. The growing demand for the manufacture of paints & coatings and adhesives & sealants is anticipated to be the main factor driving the growth of the Asia Pacific solvents market. Moreover, China’s High Purity Solvents market held the largest market share and the Indian High Purity Solvents market was the fastest growing market in the Asia-Pacific region.

    Key Players and Competitive Insights

    Leading market players are investing heavily in research and development in order to expand their product lines, which will help the High Purity Solvents market, grow even more. Market participants are also undertaking a variety of strategic activities to expand their global footprint, with important market developments including new product launches, contractual agreements, mergers and acquisitions, higher investments, and collaboration with other organizations. To expand and survive in a more competitive and rising market climate, High Purity Solvents industry must offer cost-effective items.

    Manufacturing locally to minimize operational costs is one of the key business tactics used by manufacturers in the global High Purity Solvents industry to benefit clients and increase the market sector. In recent years, the High Purity Solvents industry has offered some of the most significant advantages to medicine. Major players in the High Purity Solvents market, including Exxon Mobil Corporation, BASF SE, Asahi Kasei Corporation, Linde, Thermo Fisher Scientific Inc., High Purity Laboratory Chemicals Pvt. Ltd., Dow, Apchem Pvt.

    Ltd., Evonik Industries AG, Merck KGaA, Spectrum Chemical Manufacturing Corp., Central Drug House, Tedia, Mitsubishi Chemical Corporation (a subsidiary of Mitsubishi Chemical Holdings Corporation), and Akzo Nobel N.V., are attempting to increase market demand by investing in research and development Types.

    Specialty chemicals company Clariant International Ltd. (Clariant), a division of Clariant AG. It creates, produces, sells, and distributes a wide variety of specialised chemicals utilised in clients' production and treatment processes. Additives, automotive fluids, agricultural waste, petrochemical catalysts, performance materials, surfactants, mining chemicals, intermediates, and emulsions are among the company's product offerings. The headquarters of Clariant are located in Muttenz, Basel-Landschaft, Switzerland. In order to actively combat climate change by removing fossil carbon from the value chain, Clariant, a speciality chemicals business with headquarters in Switzerland, introduced its new Vita 100% bio-based surfactants and polyethylene glycols (PEGS) in February 2022.

    Aceto Corporation is a global leader in the sourcing, regulatory support, marketing, and distribution of specialty chemicals, final dosage form generics, nutraceutical goods, and agricultural protection products. Aceto, a US-based pharmaceutical company, purchased Finar Limited in May 2021 for an unknown sum. Aceto has increased the range of products it offers for the biopharmaceutical, pharmaceutical, and vaccine end markets as a result of this acquisition. An Indian company called Finar Chemicals specialises in high purity solvents.

    Key Companies in the High Purity Solvents Market market include

    Industry Developments

    March 2021: A Dutch business named NXTLEVVEL Biochem and Braskem collaborated to study the market for renewable solvents. This cooperation offers solutions for a variety of industries, including agrochemicals, personal care, home care, and institutional and industrial cleaning.

    Future Outlook

    High Purity Solvents Market Future Outlook

    The High Purity Solvents Market is projected to grow at a 6.48% CAGR from 2024 to 2035, driven by increasing demand in pharmaceuticals, electronics, and chemical manufacturing.

    New opportunities lie in:

    • Invest in R&D for eco-friendly solvent alternatives to capture sustainability-focused markets.
    • Expand distribution networks in emerging economies to leverage growing industrial sectors.
    • Develop specialized solvents for niche applications in biotechnology and nanotechnology industries.

    By 2035, the High Purity Solvents Market is expected to achieve substantial growth, reflecting evolving industry needs and technological advancements.

    Market Segmentation

    High Purity Solvents Type Outlook

    • Spectrophotometric Solvents
    • UHPLC and LC/MS Solvents
    • HPLC Solvents
    • GC Solvents

    High Purity Solvents Grade Outlook

    • ACS
    • Biosolv
    • Gcsolv
    • HPLC Grade
    • Omnisolv
    • Pestisolv
    • Purge & Trap
    • Spectrosolv
    • Tracegrade
    • USP
    • Ultratrace
    • Unisolv

    High Purity Solvents Category Outlook

    • Polar Solvent
    • Non-Polar Solvent

    High Purity Solvents End User Outlook

    • Pharmaceutical and Biopharmaceutical
    • Chemical Laboratories
    • Cosmetics
    • Food & Beverage
    • Agriculture
    • Paints & Coatings
    • Biotechnology
    • Electrical & Electronics

    High Purity Solvents Regional Outlook

    North America
    • US.
    • Canada

    High Purity Solvents Application Outlook

    • Liquid Crystals
    • Lithium Ion Batteries
    • Electroplating
    • Resins
    • Catalysts

    Report Scope

    Market Highlights

    Author

    Anshula Mandaokar
    Team Lead - Research

    She holds an experience of about 6+ years in market research and business consulting, working under the spectrum of information communication technology, telecommunications and semiconductor domains. aarti conceptualizes and implements a scalable business strategy and provides strategic leadership to the clients. her expertise lies in market estimation, competitive intelligence, pipeline analysis, customer assessment, etc.

    Leave a Comment

    Latest Comments

    John Doe
    john@example.com

    This is a great article! Really helped me understand the topic better.

    Posted on July 23, 2025, 10:15 AM
    Jane Smith
    jane@domain.com

    Thanks for sharing this. I’ve bookmarked it for later reference.

    Posted on July 22, 2025, 7:45 PM

    FAQs

    How much is the High Purity Solvents market?

    The High Purity Solvents Market size was valued at USD 37.2 Billion in 2022.

    What is the growth rate of the High Purity Solvents market?

    The global market is projected to grow at a CAGR of 6.90% during the forecast period, 2025-2035.

    Which region held the largest market share in the High Purity Solvents market?

    North America had the largest share in the global market

    Who are the key players in the High Purity Solvents market?

    The key players in the market are Exxon Mobil Corporation, BASF SE, Asahi Kasei Corporation, Linde, Thermo Fisher Scientific Inc., High Purity Laboratory Chemicals Pvt. Ltd., Dow, Apchem Pvt. Ltd., Evonik Industries AG, Merck KGaA, Spectrum Chemical Manufacturing Corp., Central Drug House, Tedia, Mitsubishi Chemical Corporation (a subsidiary of Mitsubishi Chemical Holdings Corporation), and Akzo Nobel N.V.

    Which Type led the High Purity Solvents market?

    The Spectrophotometric Solvents Type dominated the market in 2022.

    Which Grade had the largest market share in the High Purity Solvents market?

    sThe ACS Grade had the largest share in the global market.

    1. Table of Contents
    2. Executive Summary
    3. Market Introduction
      1. Definition
      2. Scope of the Study
        1. Research Objective
        2. Assumptions
        3. Limitations
    4. Research Methodology
      1. Overview
      2. Data Mining
      3. Secondary Research
      4. Primary Research
        1. Primary Interviews and Information Gathering Process
        2. Breakdown of Primary Respondents
      5. Forecasting Modality
      6. Market Size Estimation
        1. Bottom-up Approach
        2. Top-Down Approach
      7. Data Triangulation
      8. Validation
    5. MARKET DYNAMICS
      1. Overview
      2. Drivers
      3. Restraints
      4. Opportunities
    6. MARKET FACTOR ANALYSIS
      1. Value Chain Analysis
      2. Porter’s Five Forces Analysis
        1. Bargaining Power of Suppliers
        2. Bargaining Power of Buyers
        3. Threat of New Entrants
        4. Threat of Substitutes
        5. Intensity of Rivalry
      3. COVID-19 Impact Analysis
        1. Market Impact Analysis
        2. Regional Impact
        3. Opportunity and Threat Analysis
    7. GLOBAL HIGH PURITY SOLVENTS MARKET, BY TYPE
      1. Overview
      2. Spectrophotometric Solvents
      3. UHPLC and LC/MS Solvents
      4. HPLC Solvents
      5. GC Solvents
    8. GLOBAL HIGH PURITY SOLVENTS MARKET, BY GRADE
      1. Overview
      2. ACS
      3. Biosolv
      4. Gcsolv
      5. HPLC Grade
      6. Omnisolv
      7. Pestisolv
      8. Purge & Trap
      9. Spectrosolv
      10. Tracegrade
      11. USP
      12. Ultratrace
      13. Unisolv
    9. GLOBAL HIGH PURITY SOLVENTS MARKET, BY CATEGORY
      1. Overview
      2. Polar Solvent
      3. Non-Polar Solvent
    10. GLOBAL HIGH PURITY SOLVENTS MARKET, BY APPLICATION
      1. Overview
      2. Liquid Crystals
      3. Lithium Ion Batteries
      4. Electroplating
      5. Resins
      6. Catalysts
    11. GLOBAL HIGH PURITY SOLVENTS MARKET, BY END-USER
      1. Overview
      2. Pharmaceutical and Biopharmaceutical
      3. Chemical Laboratories
      4. Cosmetics
      5. Food & Beverage
      6. Agriculture
      7. Paints & Coatings
      8. Biotechnology
      9. Electrical & Electronics
    12. GLOBAL HIGH PURITY SOLVENTS MARKET, BY REGION
      1. Overview
      2. North America
        1. U.S.
        2. Canada
      3. Europe
        1. Germany
        2. France
        3. U.K
        4. Italy
        5. Spain
        6. Rest of Europe
      4. Asia-Pacific
        1. China
        2. India
        3. Japan
        4. South Korea
        5. Australia
        6. Rest of Asia-Pacific
      5. Rest of the World
        1. Middle East
        2. Africa
        3. Latin America
    13. Competitive Landscape
      1. Overview
      2. Competitive Analysis
      3. Market Share Analysis
      4. Major Growth Strategy in the Global High Purity Solvents Market,
      5. Competitive Benchmarking
      6. Leading Players in Terms of Number of Developments in the Global High Purity Solvents Market,
      7. Key developments and Growth Strategies
        1. New Type Launch/Grade Deployment
        2. Merger & Acquisitions
        3. Joint Ventures
      8. Major Players Financial Matrix
        1. Sales & Operating Income, 2022
        2. Major Players R&D Expenditure. 2022
    14. COMPANY PROFILES
      1. EXXON MOBIL CORPORATION.
        1. Company Overview
        2. Financial Overview
        3. Types Offered
        4. Key Developments
        5. SWOT Analysis
        6. Key Strategies
      2. BASF SE
        1. Company Overview
        2. Financial Overview
        3. Types Offered
        4. Key Developments
        5. SWOT Analysis
        6. Key Strategies
      3. Asahi Kasei Corporation
        1. Company Overview
        2. Financial Overview
        3. Types Offered
        4. Key Developments
        5. SWOT Analysis
        6. Key Strategies
      4. Linde.
        1. Company Overview
        2. Financial Overview
        3. Types Offered
        4. Key Developments
        5. SWOT Analysis
        6. Key Strategies
      5. Thermo Fisher Scientific Inc.
        1. Company Overview
        2. Financial Overview
        3. Types Offered
        4. Key Developments
        5. SWOT Analysis
        6. Key Strategies
      6. HIGH PURITY LABORATORY CHEMICALS PVT. LTD.
        1. Company Overview
        2. Financial Overview
        3. Types Offered
        4. Key Developments
        5. SWOT Analysis
        6. Key Strategies
      7. Dow
        1. Company Overview
        2. Financial Overview
        3. Types Offered
        4. Key Developments
        5. SWOT Analysis
        6. Key Strategies
      8. Apchem Pvt. Ltd..
        1. Company Overview
        2. Financial Overview
        3. Types Offered
        4. Key Developments
        5. SWOT Analysis
        6. Key Strategies
      9. Evonik Industries AG
        1. Company Overview
        2. Financial Overview
        3. Types Offered
        4. Key Developments
        5. SWOT Analysis
        6. Key Strategies
      10. Merck KGaA
        1. Company Overview
        2. Financial Overview
        3. Types Offered
        4. Key Developments
        5. SWOT Analysis
        6. Key Strategies
      11. Spectrum Chemical Manufacturing Corp.
        1. Company Overview
        2. Financial Overview
        3. Types Offered
        4. Key Developments
        5. SWOT Analysis
        6. Key Strategies
      12. Central Drug House
        1. Company Overview
        2. Financial Overview
        3. Types Offered
        4. Key Developments
        5. SWOT Analysis
        6. Key Strategies
      13. Tedia
        1. Company Overview
        2. Financial Overview
        3. Types Offered
        4. Key Developments
        5. SWOT Analysis
        6. Key Strategies
      14. Mitsubishi Chemical Corporation
        1. Company Overview
        2. Financial Overview
        3. Types Offered
        4. Key Developments
        5. SWOT Analysis
        6. Key Strategies
      15. Akzo Nobel N.V.
        1. Company Overview
        2. Financial Overview
        3. Types Offered
        4. Key Developments
        5. SWOT Analysis
        6. Key Strategies
    15. APPENDIX
      1. References
      2. Related Reports
    16. List of Tables and Figures
      1. LIST OF TABLES
      2. TABLE 1 GLOBAL HIGH PURITY SOLVENTS MARKET, SYNOPSIS, 2018-2032
      3. TABLE 2 GLOBAL HIGH PURITY SOLVENTS MARKET, ESTIMATES & FORECAST, 2018-2032 (USD BILLION)
      4. TABLE 3 GLOBAL HIGH PURITY SOLVENTS MARKET, BY TYPE, 2018-2032 (USD BILLION)
      5. TABLE 4 GLOBAL HIGH PURITY SOLVENTS MARKET, BY GRADE, 2018-2032 (USD BILLION)
      6. TABLE 5 GLOBAL HIGH PURITY SOLVENTS MARKET, BY CATEGORY, 2018-2032 (USD BILLION)
      7. TABLE 6 GLOBAL HIGH PURITY SOLVENTS MARKET, BY APPLICATION, 2018-2032 (USD BILLION)
      8. TABLE 7 GLOBAL HIGH PURITY SOLVENTS MARKET, BY END-USER, 2018-2032 (USD BILLION)
      9. TABLE 8 NORTH AMERICA HIGH PURITY SOLVENTS MARKET, BY TYPE, 2018-2032 (USD BILLION)
      10. TABLE 9 NORTH AMERICA HIGH PURITY SOLVENTS MARKET, BY GRADE, 2018-2032 (USD BILLION)
      11. TABLE 10 NORTH AMERICA HIGH PURITY SOLVENTS MARKET, BY CATEGORY, 2018-2032 (USD BILLION)
      12. TABLE 11 NORTH AMERICA HIGH PURITY SOLVENTS MARKET, BY APPLICATION, 2018-2032 (USD BILLION)
      13. TABLE 12 NORTH AMERICA HIGH PURITY SOLVENTS MARKET, BY END-USER, 2018-2032 (USD BILLION)
      14. TABLE 13 NORTH AMERICA HIGH PURITY SOLVENTS MARKET, BY COUNTRY, 2018-2032 (USD BILLION)
      15. TABLE 14 U.S. HIGH PURITY SOLVENTS MARKET, BY TYPE, 2018-2032 (USD BILLION)
      16. TABLE 15 U.S. HIGH PURITY SOLVENTS MARKET, BY GRADE, 2018-2032 (USD BILLION)
      17. TABLE 16 U.S. HIGH PURITY SOLVENTS MARKET, BY CATEGORY, 2018-2032 (USD BILLION)
      18. TABLE 17 U.S. HIGH PURITY SOLVENTS MARKET, BY APPLICATION, 2018-2032 (USD BILLION)
      19. TABLE 18 U.S. HIGH PURITY SOLVENTS MARKET, BY END-USER, 2018-2032 (USD BILLION)
      20. TABLE 19 CANADA HIGH PURITY SOLVENTS MARKET, BY TYPE, 2018-2032 (USD BILLION)
      21. TABLE 20 CANADA HIGH PURITY SOLVENTS MARKET, BY GRADE, 2018-2032 (USD BILLION)
      22. TABLE 21 CANADA HIGH PURITY SOLVENTS MARKET, BY CATEGORY, 2018-2032 (USD BILLION)
      23. TABLE 22 CANADA HIGH PURITY SOLVENTS MARKET, BY APPLICATION, 2018-2032 (USD BILLION)
      24. TABLE 23 CANADA HIGH PURITY SOLVENTS MARKET, BY END-USER, 2018-2032 (USD BILLION)
      25. TABLE 24 EUROPE HIGH PURITY SOLVENTS MARKET, BY TYPE, 2018-2032 (USD BILLION)
      26. TABLE 25 EUROPE HIGH PURITY SOLVENTS MARKET, BY GRADE, 2018-2032 (USD BILLION)
      27. TABLE 26 EUROPE HIGH PURITY SOLVENTS MARKET, BY CATEGORY, 2018-2032 (USD BILLION)
      28. TABLE 27 EUROPE HIGH PURITY SOLVENTS MARKET, BY APPLICATION, 2018-2032 (USD BILLION)
      29. TABLE 28 EUROPE HIGH PURITY SOLVENTS MARKET, BY END-USER, 2018-2032 (USD BILLION)
      30. TABLE 29 EUROPE HIGH PURITY SOLVENTS MARKET, BY COUNTRY, 2018-2032 (USD BILLION)
      31. TABLE 30 GERMANY HIGH PURITY SOLVENTS MARKET, BY TYPE, 2018-2032 (USD BILLION)
      32. TABLE 31 GERMANY HIGH PURITY SOLVENTS MARKET, BY GRADE, 2018-2032 (USD BILLION)
      33. TABLE 32 GERMANY HIGH PURITY SOLVENTS MARKET, BY CATEGORY, 2018-2032 (USD BILLION)
      34. TABLE 33 GERMANY HIGH PURITY SOLVENTS MARKET, BY APPLICATION, 2018-2032 (USD BILLION)
      35. TABLE 34 GERMANY HIGH PURITY SOLVENTS MARKET, BY END-USER, 2018-2032 (USD BILLION)
      36. TABLE 35 FRANCE HIGH PURITY SOLVENTS MARKET, BY TYPE, 2018-2032 (USD BILLION)
      37. TABLE 36 FRANCE HIGH PURITY SOLVENTS MARKET, BY GRADE, 2018-2032 (USD BILLION)
      38. TABLE 37 FRANCE HIGH PURITY SOLVENTS MARKET, BY CATEGORY, 2018-2032 (USD BILLION)
      39. TABLE 38 FRANCE HIGH PURITY SOLVENTS MARKET, BY APPLICATION, 2018-2032 (USD BILLION)
      40. TABLE 39 FRANCE HIGH PURITY SOLVENTS MARKET, BY END-USER, 2018-2032 (USD BILLION)
      41. TABLE 40 U.K HIGH PURITY SOLVENTS MARKET, BY TYPE, 2018-2032 (USD BILLION)
      42. TABLE 41 U.K HIGH PURITY SOLVENTS MARKET, BY GRADE, 2018-2032 (USD BILLION)
      43. TABLE 42 U.K HIGH PURITY SOLVENTS MARKET, BY CATEGORY, 2018-2032 (USD BILLION)
      44. TABLE 43 U.K HIGH PURITY SOLVENTS MARKET, BY APPLICATION, 2018-2032 (USD BILLION)
      45. TABLE 44 U.K HIGH PURITY SOLVENTS MARKET, BY END-USER, 2018-2032 (USD BILLION)
      46. TABLE 45 ITALY HIGH PURITY SOLVENTS MARKET, BY TYPE, 2018-2032 (USD BILLION)
      47. TABLE 46 ITALY HIGH PURITY SOLVENTS MARKET, BY GRADE, 2018-2032 (USD BILLION)
      48. TABLE 47 ITALY HIGH PURITY SOLVENTS MARKET, BY CATEGORY, 2018-2032 (USD BILLION)
      49. TABLE 48 ITALY HIGH PURITY SOLVENTS MARKET, BY APPLICATION, 2018-2032 (USD BILLION)
      50. TABLE 49 ITALY HIGH PURITY SOLVENTS MARKET, BY END-USER, 2018-2032 (USD BILLION)
      51. TABLE 50 SPAIN HIGH PURITY SOLVENTS MARKET, BY TYPE, 2018-2032 (USD BILLION)
      52. TABLE 51 SPAIN HIGH PURITY SOLVENTS MARKET, BY GRADE, 2018-2032 (USD BILLION)
      53. TABLE 52 SPAIN HIGH PURITY SOLVENTS MARKET, BY CATEGORY, 2018-2032 (USD BILLION)
      54. TABLE 53 SPAIN HIGH PURITY SOLVENTS MARKET, BY APPLICATION, 2018-2032 (USD BILLION)
      55. TABLE 54 SPAIN HIGH PURITY SOLVENTS MARKET, BY END-USER, 2018-2032 (USD BILLION)
      56. TABLE 55 REST OF EUROPE HIGH PURITY SOLVENTS MARKET, BY TYPE, 2018-2032 (USD BILLION)
      57. TABLE 56 REST OF EUROPE HIGH PURITY SOLVENTS MARKET, BY GRADE, 2018-2032 (USD BILLION)
      58. TABLE 57 REST OF EUROPE HIGH PURITY SOLVENTS MARKET, BY CATEGORY, 2018-2032 (USD BILLION)
      59. TABLE 58 REST OF EUROPE HIGH PURITY SOLVENTS MARKET, BY APPLICATION, 2018-2032 (USD BILLION)
      60. TABLE 59 REST OF EUROPE HIGH PURITY SOLVENTS MARKET, BY END-USER, 2018-2032 (USD BILLION)
      61. TABLE 60 ASIA PACIFIC HIGH PURITY SOLVENTS MARKET, BY TYPE, 2018-2032 (USD BILLION)
      62. TABLE 61 ASIA PACIFIC HIGH PURITY SOLVENTS MARKET, BY GRADE, 2018-2032 (USD BILLION)
      63. TABLE 62 ASIA PACIFIC HIGH PURITY SOLVENTS MARKET, BY CATEGORY, 2018-2032 (USD BILLION)
      64. TABLE 63 ASIA PACIFIC HIGH PURITY SOLVENTS MARKET, BY APPLICATION, 2018-2032 (USD BILLION)
      65. TABLE 64 ASIA PACIFIC HIGH PURITY SOLVENTS MARKET, BY END-USER, 2018-2032 (USD BILLION)
      66. TABLE 65 ASIA PACIFIC HIGH PURITY SOLVENTS MARKET, BY COUNTRY, 2018-2032 (USD BILLION)
      67. TABLE 66 CHINA HIGH PURITY SOLVENTS MARKET, BY TYPE, 2018-2032 (USD BILLION)
      68. TABLE 67 CHINA HIGH PURITY SOLVENTS MARKET, BY GRADE, 2018-2032 (USD BILLION)
      69. TABLE 68 CHINA HIGH PURITY SOLVENTS MARKET, BY CATEGORY, 2018-2032 (USD BILLION)
      70. TABLE 69 CHINA HIGH PURITY SOLVENTS MARKET, BY APPLICATION, 2018-2032 (USD BILLION)
      71. TABLE 70 CHINA HIGH PURITY SOLVENTS MARKET, BY END-USER, 2018-2032 (USD BILLION)
      72. TABLE 71 JAPAN HIGH PURITY SOLVENTS MARKET, BY TYPE, 2018-2032 (USD BILLION)
      73. TABLE 72 JAPAN HIGH PURITY SOLVENTS MARKET, BY GRADE, 2018-2032 (USD BILLION)
      74. TABLE 73 JAPAN HIGH PURITY SOLVENTS MARKET, BY CATEGORY, 2018-2032 (USD BILLION)
      75. TABLE 74 JAPAN HIGH PURITY SOLVENTS MARKET, BY APPLICATION, 2018-2032 (USD BILLION)
      76. TABLE 75 JAPAN HIGH PURITY SOLVENTS MARKET, BY END-USER, 2018-2032 (USD BILLION)
      77. TABLE 76 INDIA HIGH PURITY SOLVENTS MARKET, BY TYPE, 2018-2032 (USD BILLION)
      78. TABLE 77 INDIA HIGH PURITY SOLVENTS MARKET, BY GRADE, 2018-2032 (USD BILLION)
      79. TABLE 78 INDIA HIGH PURITY SOLVENTS MARKET, BY CATEGORY, 2018-2032 (USD BILLION)
      80. TABLE 79 INDIA HIGH PURITY SOLVENTS MARKET, BY APPLICATION, 2018-2032 (USD BILLION)
      81. TABLE 80 INDIA HIGH PURITY SOLVENTS MARKET, BY END-USER, 2018-2032 (USD BILLION)
      82. TABLE 81 SOUTH KOREA HIGH PURITY SOLVENTS MARKET, BY TYPE, 2018-2032 (USD BILLION)
      83. TABLE 82 SOUTH KOREA HIGH PURITY SOLVENTS MARKET, BY GRADE, 2018-2032 (USD BILLION)
      84. TABLE 83 SOUTH KOREA HIGH PURITY SOLVENTS MARKET, BY CATEGORY, 2018-2032 (USD BILLION)
      85. TABLE 84 SOUTH KOREA HIGH PURITY SOLVENTS MARKET, BY APPLICATION, 2018-2032 (USD BILLION)
      86. TABLE 85 SOUTH KOREA HIGH PURITY SOLVENTS MARKET, BY END-USER, 2018-2032 (USD BILLION)
      87. TABLE 86 AUSTRALIA HIGH PURITY SOLVENTS MARKET, BY TYPE, 2018-2032 (USD BILLION)
      88. TABLE 87 AUSTRALIA HIGH PURITY SOLVENTS MARKET, BY GRADE, 2018-2032 (USD BILLION)
      89. TABLE 88 AUSTRALIA HIGH PURITY SOLVENTS MARKET, BY CATEGORY, 2018-2032 (USD BILLION)
      90. TABLE 89 AUSTRALIA HIGH PURITY SOLVENTS MARKET, BY APPLICATION, 2018-2032 (USD BILLION)
      91. TABLE 90 AUSTRALIA HIGH PURITY SOLVENTS MARKET, BY END-USER, 2018-2032 (USD BILLION)
      92. TABLE 91 REST OF ASIA PACIFIC HIGH PURITY SOLVENTS MARKET, BY TYPE, 2018-2032 (USD BILLION)
      93. TABLE 92 REST OF ASIA PACIFIC HIGH PURITY SOLVENTS MARKET, BY GRADE, 2018-2032 (USD BILLION)
      94. TABLE 93 REST OF ASIA PACIFIC HIGH PURITY SOLVENTS MARKET, BY CATEGORY, 2018-2032 (USD BILLION)
      95. TABLE 94 REST OF ASIA PACIFIC HIGH PURITY SOLVENTS MARKET, BY APPLICATION, 2018-2032 (USD BILLION)
      96. TABLE 95 REST OF ASIA PACIFIC HIGH PURITY SOLVENTS MARKET, BY END-USER, 2018-2032 (USD BILLION)
      97. TABLE 96 REST OF THE WORLD HIGH PURITY SOLVENTS MARKET, BY TYPE, 2018-2032 (USD BILLION)
      98. TABLE 97 REST OF THE WORLD HIGH PURITY SOLVENTS MARKET, BY GRADE, 2018-2032 (USD BILLION)
      99. TABLE 98 REST OF THE WORLD HIGH PURITY SOLVENTS MARKET, BY CATEGORY, 2018-2032 (USD BILLION)
      100. TABLE 99 REST OF THE WORLD HIGH PURITY SOLVENTS MARKET, BY APPLICATION, 2018-2032 (USD BILLION)
      101. TABLE 100 REST OF THE WORLD HIGH PURITY SOLVENTS MARKET, BY END-USER, 2018-2032 (USD BILLION)
      102. TABLE 101 REST OF THE WORLD HIGH PURITY SOLVENTS MARKET, BY COUNTRY, 2018-2032 (USD BILLION)
      103. TABLE 102 MIDDLE EAST HIGH PURITY SOLVENTS MARKET, BY TYPE, 2018-2032 (USD BILLION)
      104. TABLE 103 MIDDLE EAST HIGH PURITY SOLVENTS MARKET, BY GRADE, 2018-2032 (USD BILLION)
      105. TABLE 104 MIDDLE EAST HIGH PURITY SOLVENTS MARKET, BY CATEGORY, 2018-2032 (USD BILLION)
      106. TABLE 105 MIDDLE EAST HIGH PURITY SOLVENTS MARKET, BY APPLICATION, 2018-2032 (USD BILLION)
      107. TABLE 106 MIDDLE EAST HIGH PURITY SOLVENTS MARKET, BY END-USER, 2018-2032 (USD BILLION)
      108. TABLE 107 AFRICA HIGH PURITY SOLVENTS MARKET, BY TYPE, 2018-2032 (USD BILLION)
      109. TABLE 108 AFRICA HIGH PURITY SOLVENTS MARKET, BY GRADE, 2018-2032 (USD BILLION)
      110. TABLE 109 AFRICA HIGH PURITY SOLVENTS MARKET, BY CATEGORY, 2018-2032 (USD BILLION)
      111. TABLE 110 AFRICA HIGH PURITY SOLVENTS MARKET, BY APPLICATION, 2018-2032 (USD BILLION)
      112. TABLE 111 AFRICA HIGH PURITY SOLVENTS MARKET, BY END-USER, 2018-2032 (USD BILLION)
      113. TABLE 112 LATIN AMERICA HIGH PURITY SOLVENTS MARKET, BY TYPE, 2018-2032 (USD BILLION)
      114. TABLE 113 LATIN AMERICA HIGH PURITY SOLVENTS MARKET, BY GRADE, 2018-2032 (USD BILLION)
      115. TABLE 114 LATIN AMERICA HIGH PURITY SOLVENTS MARKET, BY CATEGORY, 2018-2032 (USD BILLION)
      116. TABLE 115 LATIN AMERICA HIGH PURITY SOLVENTS MARKET, BY APPLICATION, 2018-2032 (USD BILLION)
      117. TABLE 116 LATIN AMERICA HIGH PURITY SOLVENTS MARKET, BY END-USER, 2018-2032 (USD BILLION)   LIST OF FIGURES
      118. FIGURE 1 RESEARCH PROCESS
      119. FIGURE 2 MARKET STRUCTURE FOR THE GLOBAL HIGH PURITY SOLVENTS MARKET
      120. FIGURE 3 MARKET DYNAMICS FOR THE GLOBAL HIGH PURITY SOLVENTS MARKET
      121. FIGURE 4 GLOBAL HIGH PURITY SOLVENTS MARKET, SHARE (%), BY TYPE, 2022
      122. FIGURE 5 GLOBAL HIGH PURITY SOLVENTS MARKET, SHARE (%), BY GRADE, 2022
      123. FIGURE 6 GLOBAL HIGH PURITY SOLVENTS MARKET, SHARE (%), BY CATEGORY, 2022
      124. FIGURE 7 GLOBAL HIGH PURITY SOLVENTS MARKET, SHARE (%), BY APPLICATION, 2022
      125. FIGURE 8 GLOBAL HIGH PURITY SOLVENTS MARKET, SHARE (%), BY END-USER, 2022
      126. FIGURE 9 GLOBAL HIGH PURITY SOLVENTS MARKET, SHARE (%), BY REGION, 2022
      127. FIGURE 10 NORTH AMERICA: HIGH PURITY SOLVENTS MARKET, SHARE (%), BY REGION, 2022
      128. FIGURE 11 EUROPE: HIGH PURITY SOLVENTS MARKET, SHARE (%), BY REGION, 2022
      129. FIGURE 12 ASIA-PACIFIC: HIGH PURITY SOLVENTS MARKET, SHARE (%), BY REGION, 2022
      130. FIGURE 13 REST OF THE WORLD: HIGH PURITY SOLVENTS MARKET, SHARE (%), BY REGION, 2022
      131. FIGURE 14 GLOBAL HIGH PURITY SOLVENTS MARKET: COMPANY SHARE ANALYSIS, 2022 (%)
      132. FIGURE 15 EXXON MOBIL CORPORATION.: FINANCIAL OVERVIEW SNAPSHOT
      133. FIGURE 16 EXXON MOBIL CORPORATION.: SWOT ANALYSIS
      134. FIGURE 17 BASF SE: FINANCIAL OVERVIEW SNAPSHOT
      135. FIGURE 18 BASF SE: SWOT ANALYSIS
      136. FIGURE 19 ASAHI KASEI CORPORATION: FINANCIAL OVERVIEW SNAPSHOT
      137. FIGURE 20 ASAHI KASEI CORPORATION: SWOT ANALYSIS
      138. FIGURE 21 LINDE.: FINANCIAL OVERVIEW SNAPSHOT
      139. FIGURE 22 LINDE.: SWOT ANALYSIS
      140. FIGURE 23 THERMO FISHER SCIENTIFIC INC..: FINANCIAL OVERVIEW SNAPSHOT
      141. FIGURE 24 THERMO FISHER SCIENTIFIC INC..: SWOT ANALYSIS
      142. FIGURE 25 HIGH PURITY LABORATORY CHEMICALS PVT. LTD.: FINANCIAL OVERVIEW SNAPSHOT
      143. FIGURE 26 HIGH PURITY LABORATORY CHEMICALS PVT. LTD.: SWOT ANALYSIS
      144. FIGURE 27 DOW: FINANCIAL OVERVIEW SNAPSHOT
      145. FIGURE 28 DOW: SWOT ANALYSIS
      146. FIGURE 29 APCHEM PVT. LTD..: FINANCIAL OVERVIEW SNAPSHOT
      147. FIGURE 30 APCHEM PVT. LTD..: SWOT ANALYSIS
      148. FIGURE 31 EVONIK INDUSTRIES AG: FINANCIAL OVERVIEW SNAPSHOT
      149. FIGURE 32 EVONIK INDUSTRIES AG: SWOT ANALYSIS
      150. FIGURE 33 MERCK KGAA: FINANCIAL OVERVIEW SNAPSHOT
      151. FIGURE 34 MERCK KGAA: SWOT ANALYSIS
      152. FIGURE 35 SPECTRUM CHEMICAL MANUFACTURING CORP: FINANCIAL OVERVIEW SNAPSHOT
      153. FIGURE 36 SPECTRUM CHEMICAL MANUFACTURING CORP: SWOT ANALYSIS
      154. FIGURE 37 CENTRAL DRUG HOUSE: FINANCIAL OVERVIEW SNAPSHOT
      155. FIGURE 38 CENTRAL DRUG HOUSE: SWOT ANALYSIS
      156. FIGURE 39 TEDIA: FINANCIAL OVERVIEW SNAPSHOT
      157. FIGURE 40 TEDIA: SWOT ANALYSIS
      158. FIGURE 41 MITSUBISHI CHEMICAL CORPORATION : FINANCIAL OVERVIEW SNAPSHOT
      159. FIGURE 42 MITSUBISHI CHEMICAL CORPORATION : SWOT ANALYSIS
      160. FIGURE 43 AKZO NOBEL N.V. : FINANCIAL OVERVIEW SNAPSHOT
      161. FIGURE 44 AKZO NOBEL N.V. : SWOT ANALYSIS

    High Purity Solvents Market Segmentation

    Market Segmentation Overview

    • Detailed segmentation data will be available in the full report
    • Comprehensive analysis by multiple parameters
    • Regional and country-level breakdowns
    • Market size forecasts by segment
    Infographic

    Free Sample Request

    Kindly complete the form below to receive a free sample of this Report

    Get Free Sample

    Customer Strories

    “I am very pleased with how market segments have been defined in a relevant way for my purposes (such as "Portable Freezers & refrigerators" and "last-mile"). In general the report is well structured. Thanks very much for your efforts.”

    Victoria Milne

    Founder
    Case Study
    Chemicals and Materials