ID: MRFR/MED/4952-HCR | February 2021 | Region: Global | 100 pages
Market Scenario
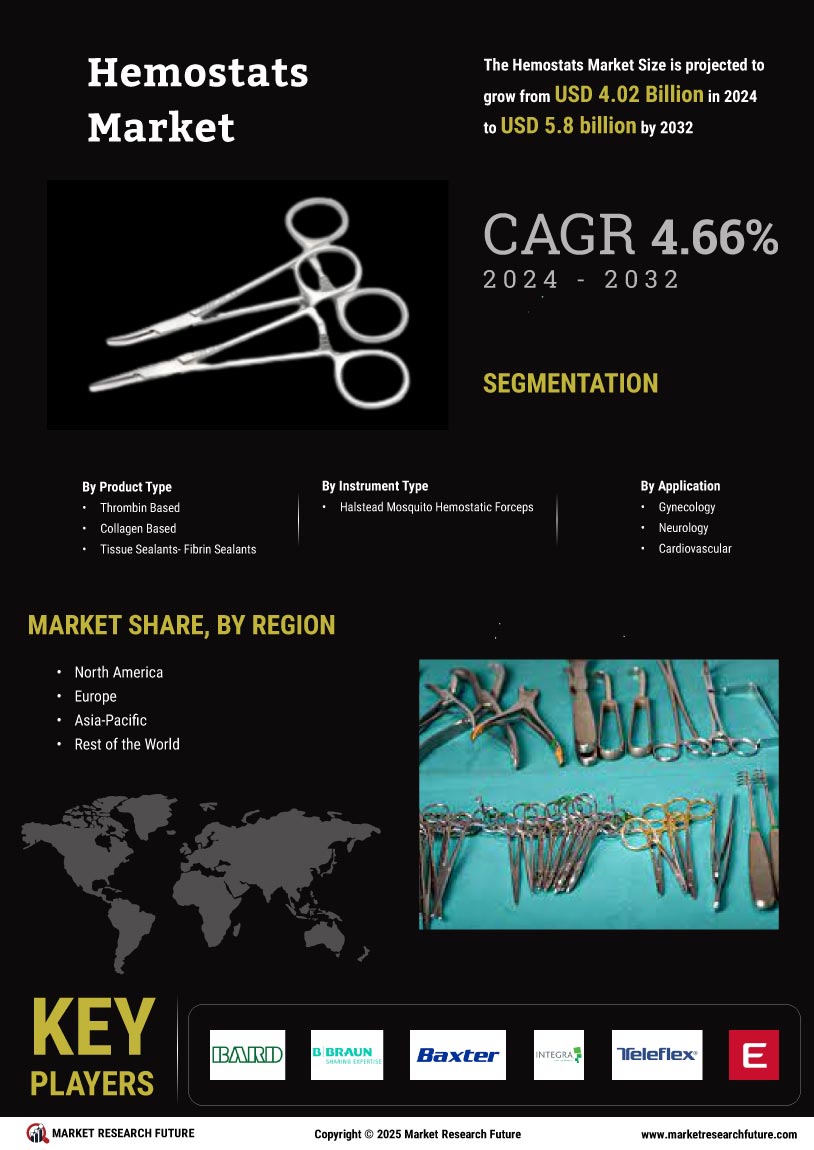
The global hemostats market is expected to register a 6.4% growth during the forecast period (2018–2023).
Blood loss occurs in surgeries due to the damage of blood vessels. It is vital to coalesce the blood to avoid too much of blood loss. The formation of blood clots at the site of injury is called hemostasis. Hemostats are surgical tools that are used during surgeries to control the bleeding of the patient. These surgical instruments help to temporarily form blood clots to control bleeding. The hemostat is also known as a hemostatic clamp and arterial forceps. It is fundamentally used in the early phases of surgery for a preliminary incision that closes blood vessels till ligation. Tissue sealants and tissue adhesion agents are very helpful for the application of hemostats.
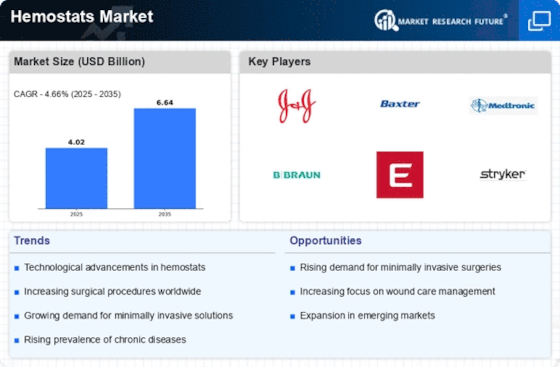
The growing number of surgical procedures, continuous progression in products range, rising incidences of sports-related damages, spinal disorders, technological advancements and increasing focus on effective blood loss management in patients during surgeries are the chief factors to boosts the hemostats market. Also, the emerging markets and rise in the number of hospitals and surgical centers are anticipated to offer added growth opportunities for players operating in the hemostats market. However, the high cost of hemostats, government’s rules and regulations and lack of skilled professionals is expected to hamper the growth of hemostats market.
Segmentation
The global hemostats market has been segmented on the basis of product type, instrument type, application, and end-user.
On the basis of product type, the market has been classified as thrombin-based, combination based, oxidized regenerated cellulose-based, gelatin based, collagen-based hemostat, tissue sealants, cyanoacrylate-based tissue adhesives, adhesion prevention products. The tissue sealants have been segmented into fibrin sealants, protein-based sealants.
On the basis of instrument type, the market has been classified as halstead mosquito hemostatic forceps, kelly and crile hemostatic forceps, and rochester-carmalt hemostatic forceps.
On the basis of application, the market has been classified as cardiovascular surgery, general surgery, gynecological surgery, reconstructive surgery, neurological surgery, orthopedic surgery, and other surgeries.
On the basis of end-users, the market has been classified as hospitals, clinics, ambulatory surgery centers, community healthcare, and others.
On the basis of region, the market is segmented into the Americas, Europe, Asia-Pacific, and the Middle East and Africa. The Americas has been further segmented into North America and South America, with the North American market divided into the US and Canada.
The European hemostats market has been segmented into Western Europe and Eastern Europe. Western Europe has further been classified as Germany, France, the UK, Italy, Spain, and the rest of Western Europe.
The hemostats market in Asia-Pacific has been segmented into Japan, China, India, South Korea, Australia, and the rest of Asia-Pacific. The hemostats market in the Middle East and Africa has been segmented into the Middle East and Africa.
Regional Market Summary
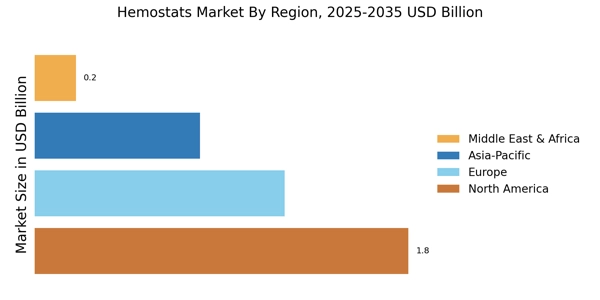
Global Hemostats Market Share, by Region, 2017 (%)
Source: MRFR Analysis
In the hemostats market, North America is anticipated to account for the largest market share due to the early adoption of advanced medical technologies, the rise in awareness, the rise in growth of the healthcare sector, and due to favorable compensation setting for many surgical procedures. According to the National Health Statistics Report by the Centers of Disease Control & Prevention, in 2014, about 201,748.3 million surgical procedures were carried out in the U.S. The statistics also showed that 28.6 million appointments to ambulatory surgery cases were informed in the U.S.
The European market is expected to hold the second largest market share. The market growth in this region can be attributed to growing frequency of cardiovascular disorders, increasing number of surgeries and rising demand for advanced treatment procedures are boosting the European market.
The market share in Asia-Pacific is also projected to experience growth in the near future due to access to optimal treatment facilities and growing demand for advanced technology, better adoption rate, increase in disposable income, and rising medical tourism.
The market in the Middle East and Africa is expected to account for the smallest share of the global hemostats market due to an underdeveloped healthcare sector, lack of technical knowledge, and poor medical facilities.
Key Players
Some of the key players in the global hemostats market are CR Bard, Inc. (US), B. Braun Melsungen AG (Germany), Baxter International, Inc. (US), Integra LifeSciences (US), Marine Polymer Technologies, Inc. (US), Teleflex (US), Ethicon, Inc. (US), Pfizer, Inc. (US), Z-Medica LLC (US), and Gelita Medical GmbH (Germany), Anika Therapeutics, Inc. (US), Stryker (US), and Integra Lifesciences Corporation(US).
Global Hemostats Market, by Product Type
Global Hemostats Market, by Instrument Type
Global Hemostats Market, by Application Type
Global Hemostats Market, by End-Users
Global Hemostats Market, by Region
Intended Audience
Frequently Asked Questions (FAQ) :
Hemostats are surgical tools that are used during surgeries to control the bleeding of the patient.
The Hemostats Market is expected to exhibit a strong 6.4% CAGR over the forecast period from 2018 to 2023.
Growing number of surgical procedures around the world is the major driver for the hemostats market.
Americas hold the major share in the hemostats market, followed by Europe.
Leading players in the Hemostats Market include C.R. Bard, Stryker, and Pfizer, among others.
Table of Contents:
Chapter 1. Report Prologue
Chapter 2. Market Introduction
2.1 Definition
2.2 Scope of the Study
2.2.1 Research Objective
2.2.2 Assumptions
2.2.3 Limitations
Chapter 3. Research Methodology
3.1 Introduction
3.2 Primary Research
3.3 Secondary Research
3.4 Market Size Estimation
Chapter 4. Market Dynamics
4.1 Drivers
4.2 Restraints
4.3 Opportunities
4.4 Challenges
4.5 Macroeconomic Indicators
4.6 Technology Trends & Assessment
Chapter 5. Market Factor Analysis
5.1 Porter’s Five Forces Analysis
5.1.1 Bargaining Power of Suppliers
5.1.2 Bargaining Power of Buyers
5.1.3 Threat of New Entrants
5.1.4 Threat of Substitutes
5.1.5 Intensity of Rivalry
5.2 Value Chain Analysis
5.3 Investment Feasibility Analysis
5.4 Pricing Analysis
Chapter 6. Global Hemostats Market, by Product Type
6.1 Introduction
6.2 Thrombin based
Market Estimates & Forecast, by Region, 2018–2023
Market Estimates & Forecast, by Country, 2018–2023
6.3 Combination based
Market Estimates & Forecast, by Region, 2018–2023
Market Estimates & Forecast, by Country, 2018–2023
6.4 Oxidized regenerated cellulose based
Market Estimates & Forecast, by Region, 2018–2023
Market Estimates & Forecast, by Country, 2018–2023
6.5 Gelatin based
Market Estimates & Forecast, by Region, 2018–2023
Market Estimates & Forecast, by Country, 2018–2023
6.6 Collagen-based
Market Estimates & Forecast, by Region, 2018–2023
Market Estimates & Forecast, by Country, 2018–2023
6.7 Tissue sealant
6.7.1 Fibrin sealants
Market Estimates & Forecast, by Region, 2018–2023
Market Estimates & Forecast, by Country, 2018–2023
6.7.2 Protein-based sealants
Market Estimates & Forecast, by Region, 2018–2023
Market Estimates & Forecast, by Country, 2018–2023
6.8 Cyanoacrylate-based tissue adhesives
Market Estimates & Forecast, by Region, 2018–2023
Market Estimates & Forecast, by Country, 2018–2023
6.9 Adhesion prevention products
Market Estimates & Forecast, by Region, 2018–2023
Market Estimates & Forecast, by Country, 2018–2023
Chapter 7. Global Hemostats Market, by Instrument Type
7.1 Introduction
7.2 Halstead mosquito hemostatic forceps
Market Estimates & Forecast, by Region, 2018–2023
Market Estimates & Forecast, by Country, 2018–2023
7.3 Kelly and Crile hemostatic forceps
Market Estimates & Forecast, by Region, 2018–2023
Market Estimates & Forecast, by Country, 2018–2023
7.4 Rochester-carmalt hemostatic forceps
Market Estimates & Forecast, by Region, 2018–2023
Market Estimates & Forecast, by Country, 2018–2023
Chapter 8. Global Hemostats Market, by Application
8.1 Introduction
8.2 Cardiovascular surgery
Market Estimates & Forecast, by Region, 2018–2023
Market Estimates & Forecast, by Country, 2018–2023
8.3 General surgery
Market Estimates & Forecast, by Region, 2018–2023
Market Estimates & Forecast, by Country, 2018–2023
8.4 Gynecological surgery
Market Estimates & Forecast, by Region, 2018–2023
Market Estimates & Forecast, by Country, 2018–2023
8.5 Reconstructive surgery
Market Estimates & Forecast, by Region, 2018–2023
Market Estimates & Forecast, by Country, 2018–2023
8.6 Neurological surgery
Market Estimates & Forecast, by Region, 2018–2023
Market Estimates & Forecast, by Country, 2018–2023
8.7 Orthopedic surgeries
Market Estimates & Forecast, by Region, 2018–2023
Market Estimates & Forecast, by Country, 2018–2023
8.8 Other surgeries
Market Estimates & Forecast, by Region, 2018–2023
Market Estimates & Forecast, by Country, 2018–2023
Chapter 9. Global Hemostats Market, by End-Users
9.1 Introduction
9.2 Hospitals
Market Estimates & Forecast, by Region, 2018–2023
Market Estimates & Forecast, by Country, 2018–2023
9.3 Clinics
Market Estimates & Forecast, by Region, 2018–2023
Market Estimates & Forecast, by Country, 2018–2023
9.4 Ambulatory Surgery Centers
Market Estimates & Forecast, by Region, 2018–2023
Market Estimates & Forecast, by Country, 2018–2023
9.5 Community healthcare
Market Estimates & Forecast, by Region, 2018–2023
Market Estimates & Forecast, by Country, 2018–2023
9.6 Others
Market Estimates & Forecast, by Region, 2018–2023
Market Estimates & Forecast, by Country, 2018–2023
Chapter 10. Global Hemostats Market, by Region
10.1 Introduction
10.2 Americas
10.2.1 North America
10.2.1.1 US
10.2.1.2 Canada
10.2.2 South America
10.3 Europe
10.3.1 Western Europe
10.3.1.1 Germany
10.3.1.2 France
10.3.1.3 Italy
10.3.1.4 Spain
10.3.1.5 UK
10.3.1.6 Rest of Western Europe
10.3.2 Eastern Europe
10.4 Asia-Pacific
10.4.1 Japan
10.4.2 China
10.4.3 India
10.4.4 Australia
10.4.5 South Korea
10.4.6 Rest of Asia-Pacific
10.5 Middle East & Africa
10.5.1 Middle East
10.5.2 Africa
Chapter 11. Company Landscape
11.1 Introduction
11.2 Market Share Analysis
11.3 Key Development & Strategies
Chapter 12. Company Profiles
12.1 CR Bard, Inc.
12.1.1 Company Overview
12.1.2 Product Type Overview
12.1.3 Financials Overview
12.1.4 Key Developments
12.1.5 SWOT Analysis
12.2 B. Braun Melsungen AG
12.2.1 Company Overview
12.2.2 Product Type Overview
12.2.3 Financial Overview
12.2.4 Key Developments
12.2.5 SWOT Analysis
12.3 Baxter International, Inc.
12.3.1 Company Overview
12.3.2 Product Type Overview
12.3.3 Financial Overview
12.3.4 Key Development
12.3.5 SWOT Analysis
12.4 Integra LifeSciences
12.4.1 Company Overview
12.4.2 Technology/Business Segment Overview
12.4.3 Financial Overview
12.4.4 Key Development
12.4.5 SWOT Analysis
12.5 Marine Polymer Technologies, Inc.
12.5.1 Company Overview
12.5.2 Product Type Overview
12.5.3 Financial overview
12.5.4 Key Developments
12.5.5 SWOT Analysis
12.6 Teleflex
12.6.1 Company Overview
12.6.2 Product Type Overview
12.6.3 Financial Overview
12.6.4 Key Developments
12.6.5 SWOT Analysis
12.7 Ethicon, Inc.
12.7.1 Overview
12.7.2 Product Type Overview
12.7.3 Financial Overview
12.7.4 Key Developments
12.7.5 SWOT Analysis
12.8 Pfizer, Inc.
12.8.1 Overview
12.8.2 Product Type/ Technology Overview
12.8.3 Financials
12.8.4 Key Developments
12.8.5 SWOT Analysis
12.9 Z-Medica LLC
12.9.1 Overview
12.9.2 Product Type Overview
12.9.3 Financials
12.9.4 Key Developments
12.9.5 SWOT Analysis
12.10 Gelita Medical GmbH
12.10.1 Overview
12.10.2 Product Type Overview
12.10.3 Financials
12.10.4 Key Developments
12.10.5 SWOT Analysis
12.12 Anika Therapeutics, Inc.
12.12.1 Overview
12.12.2 Product Type Overview
12.12.3 Financials
12.12.4 Key Developments
12.12.5 SWOT Analysis
12.12 Stryker
12.12.1 Overview
12.12.2 Product Type Overview
12.12.3 Financials
12.12.4 Key Developments
12.12.5 SWOT Analysis
Chapter 13 MRFR Conclusion
13.1 Key Findings
13.1.1 From CEO’s Viewpoint
13.1.2 Unmet Needs of the Market
13.2 Key Companies to Watch
13.3 Predictions for the Global Hemostats Market Industry
Chapter 14. Appendix
LIST OF TABLES
Table 1 Global Hemostats Market Synopsis, 2018–2023
Table 2 Global Hemostats Market Estimates and Forecast, 2018–2023 (USD Million)
Table 3 Global Hemostats Market, by Region, 2018–2023 (USD Million)
Table 4 Global Hemostats Market, by Product Type, 2018–2023 (USD Million)
Table 5 Global Hemostats Market, by Instrument Type, 2018–2023 (USD Million)
Table 6 Global Hemostats Market, by Application, 2018–2023 (USD Million)
Table 7 Global Hemostats Market, by End-users, 2018–2023 (USD Million)
Table 8 North America: Global Hemostats Market, by Product Type, 2018–2023 (USD
Million)
Table 9 North America: Global Hemostats Market, by Instrument Type, 2018–2023 (USD
Million)
Table 10 North America: Global Hemostats Market, by Application, 2018–2023 (USD
Million)
Table 11 North America: Global Hemostats Market, by End-users, 2018–2023 (USD Million)
Table 12 US: Global Hemostats Market, by Product Type, 2018–2023 (USD Million)
Table 13 US: Global Hemostats Market, by Instrument Type, 2018–2023 (USD Million)
Table 14 US: Global Hemostats Market, by Application, 2018–2023 (USD Million)
Table 15 US: Global Hemostats Market, by End-users, 2018–2023 (USD Million)
Table 16 Canada: Global Hemostats Market, by Product Type, 2018–2023 (USD Million)
Table 17 Canada: Global Hemostats Market, by Instrument Type, 2018–2023 (USD Million)
Table 18 Canada: Global Hemostats Market, by Application, 2018–2023 (USD
Million)
Table 19 Canada Global Hemostats Market, by End-users, 2018–2023 (USD Million)
Table 20 South America: Global Hemostats Market, by Product Type, 2018–2023 (USD
Million)
Table 21 South America: Global Hemostats Market, by Instrument Type, 2018–2023 (USD
Million)
Table 22 South America: Global Hemostats Market, by Application, 2018–2023 (USD
Million)
Table 23 South America: Global Hemostats Market, by End-users, 2018–2023 (USD Million)
Table 24 Europe: Global Hemostats Market, by Product Type, 2018–2023 (USD Million)
Table 25 Europe: Global Hemostats Market, by Instrument Type, 2018–2023 (USD Million)
Table 26 Europe: Global Hemostats Market, by Application, 2018–2023 (USD Million)
Table 27 Europe: Global Hemostats Market, by End-users, 2018–2023 (USD Million)
Table 28 Western Europe: Global Hemostats Market, by Product Type, 2018–2023 (USD
Million)
Table 29 Western Europe: Global Hemostats Market, by Instrument Type, 2018–2023 (USD
Million)
Table 30 Western Europe: Global Hemostats Market, by Application, 2018–2023
(USD Million)
Table 31 Western Europe: Global Hemostats Market, by End-users, 2018–2023 (USD Million)
Table 32 Eastern Europe: Global Hemostats Market, by Product Type, 2018–2023 (USD
Million)
Table 33 Eastern Europe: Global Hemostats Market, by Instrument Type, 2018–2023 (USD
Million)
Table 34 Eastern Europe: Global Hemostats Market, by Application, 2018–2023
(USD Million)
Table 35 Eastern Europe: Global Hemostats Market, by End-users, 2018–2023 (USD Million)
Table 36 Asia-Pacific: Global Hemostats Market, by Product Type, 2018–2023 (USD
Million)
Table 37 Asia-Pacific: Global Hemostats Market, by Instrument Type, 2018–2023 (USD
Million)
Table 38 Asia-Pacific: Global Hemostats Market, by Application, 2018–2023 (USD
Million)
Table 39 Asia-Pacific: Global Hemostats Market, by End-users, 2018–2023 (USD Million)
Table 40 Middle East & Africa: Global Hemostats Market, by Product Type, 2018–2023
(USD Million)
Table 41 Middle East & Africa: Global Hemostats Market, by Instrument Type, 2018–2023
(USD Million)
Table 42 Middle East & Africa: Global Hemostats Market, by Application, 2018–2023
(USD Million)
Table 43 Middle East & Africa: Global Hemostats Market, by End-users, 2018–2023 (USD Million)
LIST OF FIGURES
Figure 1 Research Process
Figure 2 Segmentation for Global Hemostats Market
Figure 3 Segmentation Market Dynamics for Global Hemostats Market
Figure 4 Global Hemostats Market Share, by Product Type, 2017
Figure 5 Global Hemostats Market Share, by Instrument Type, 2017
Figure 6 Global Hemostats Market Share, by Application, 2017
Figure 7 Global Absorbable Surgical Sutures, by End-users, 2018–2023 (USD Million)
Figure 8 Global Hemostats Market Share, by Region, 2017
Figure 9 North America: Global Hemostats Market Share, by Country, 2017
Figure 10 Europe: Global Hemostats Market Share, by Country, 2017
Figure 11 Asia-Pacific: Global Hemostats Market Share, by Country, 2017
Figure 12 Middle East & Africa: Global Hemostats Market Share, by Country, 2017
Figure 13 Global Hemostats Market: Company Share Analysis, 2017 (%)
Figure 14 CR Bard, Inc.: Key Financials
Figure 15 CR Bard, Inc.: Segmental Revenue
Figure 16 CR Bard, Inc.: Geographical Revenue
Figure 17 B. Braun Melsungen AG: Key Financials
Figure 18 B. Braun Melsungen: Segmental Revenue
Figure 19 B. Braun Melsungen: Geographical Revenue
Figure 20 Baxter International, Inc.: Key Financials
Figure 21 Baxter International, Inc.: Segmental Revenue
Figure 22 Baxter International, Inc.: Geographical Revenue
Figure 23 Integra LifeSciences: Key Financials
Figure 24 Integra LifeSciences: Segmental Revenue
Figure 25 Integra LifeSciences: Geographical Revenue
Figure 26 Marine Polymer Technologies, Inc.: Key Financials
Figure 27 Marine Polymer Technologies, Inc.: Segmental Revenue
Figure 28 Marine Polymer Technologies, Inc.: Geographical Revenue
Figure 29 Teleflex: Key Financials
Figure 30 Teleflex: Segmental Revenue
Figure 31 Teleflex: Geographical Revenue
Figure 32 Ethicon, Inc.: Key Financials
Figure 33 Ethicon, Inc.: Segmental Revenue
Figure 34 Ethicon, Inc.: Geographical Revenue
Figure 35 Pfizer, Inc.: Key Financials
Figure 36 Pfizer, Inc.: Segmental Revenue
Figure 37 Pfizer, Inc.: Geographical Revenue
Figure 38 Z-Medica LLC: Key Financials
Figure 39 Z-Medica LLC: Segmental Revenue
Figure 40 Z-Medica LLC: Geographical Revenue
Figure 41 Gelita Medical GmbH: Key Financials
Figure 42 Gelita Medical GmbH: Segmental Revenue
Figure 43 Gelita Medical GmbH: Geographical Revenue
Figure 44 Anika Therapeutics, Inc.: Key Financials
Figure 45 Anika Therapeutics, Inc.: Segmental Revenue
Figure 46 Anika Therapeutics, Inc.: Geographical Revenue
Figure 47 Stryker: Key Financials
Figure 48 Stryker: Segmental Revenue
Figure 49 Stryker: Geographical Revenue