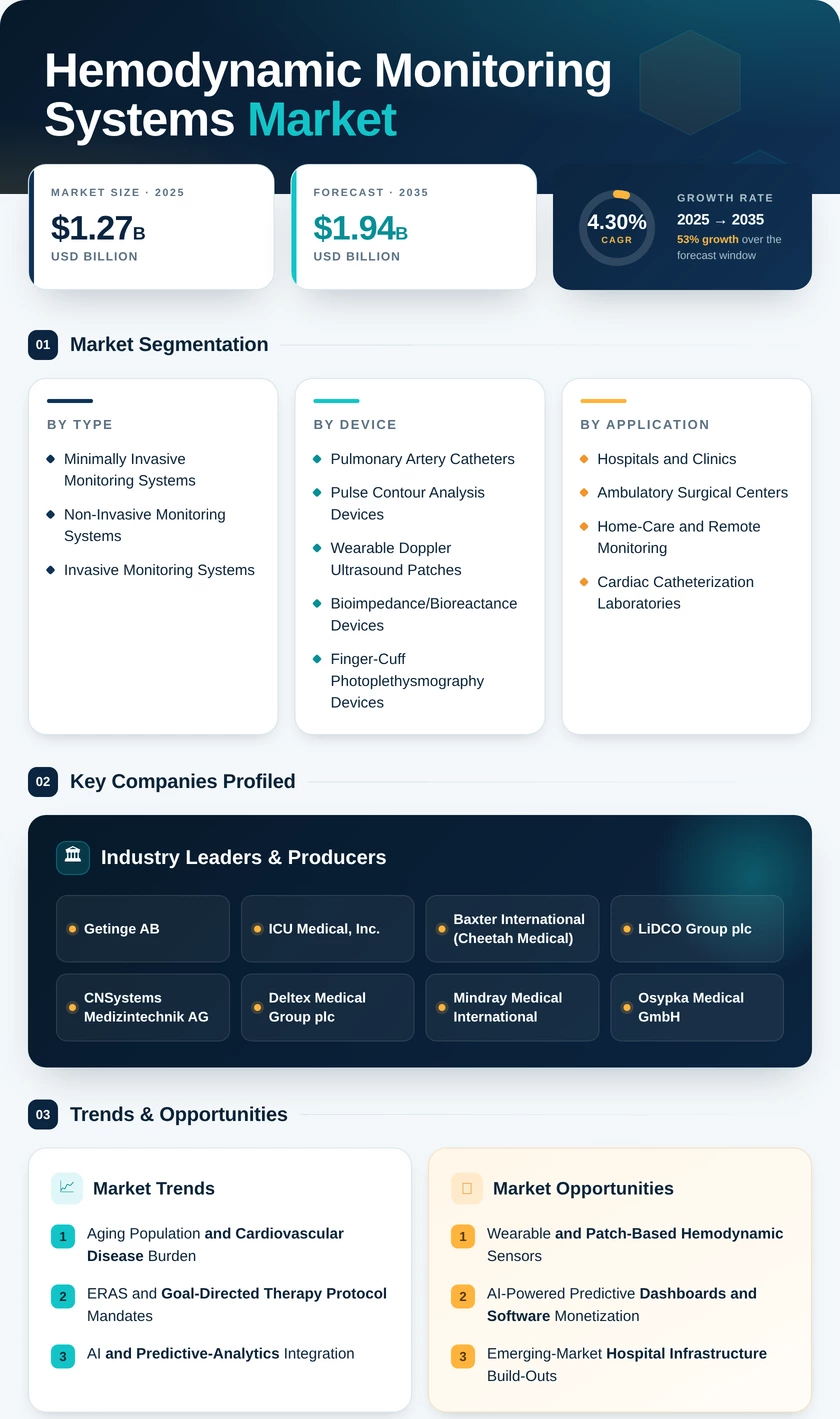
Hemodynamic Monitoring Systems Market (2026 - 2035)

ID: MRFR/MED/5215-CR
200 Pages
Rahul Gotadki
Last Updated: July 12, 2026
Hemodynamic Monitoring System Market Research Report By Product Type (Invasive Monitoring Systems, Minimally Invasive Monitoring Systems, Non-Invasive Monitoring Systems), By Application (Critical Care, Cardiac Care, Emergency Medicine, Post-operative Care), By End Use (Hospitals, Ambulatory Surgical Centers, Home Care Settings), By Component (Monitors, Sensors, Software, Accessories) and By Regional (North America, Europe, South America, Asia Pacific, Middle East and Africa) - Growth & Industry Forecast 2025 To 2035
Hemodynamic Monitoring Systems Market
Market Size
Forecast Period2026-2035
CAGR (2026-2035)4.30%
2025 Market SizeUSD 1.27 Billion
2035 Market SizeUSD 1.94 Billion
Key Players
Getinge AB
ICU Medical, Inc.
Baxter International
LiDCO Group plc
CNSystems Medizintechnik AG
Deltex Medical Group plc
Opportunities
  • Wearable and Patch-Based Hemodynamic Sensors
  • AI-Powered Predictive Dashboards and Software Monetization
  • Emerging-Market Hospital Infrastructure Build-Outs
  1. 1 Market Overview |
    1. 1.1 Study Assumptions & Market Definition |
    2. 1.2 Scope of the Study |
    3. 1.3 Research Methodology
  2. 2 Market Summary & Key Takeaways
  3. 3 Market Dynamics |
    1. 3.1 Market Drivers Analysis | |
      1. 3.1.1 Aging Population and Rising Cardiovascular Disease Burden | |
      2. 3.1.2 ERAS and Goal-Directed Therapy Protocol Mandates | |
      3. 3.1.3 AI and Predictive-Analytics Integration | |
      4. 3.1.4 Hospital-at-Home and Remote Monitoring Expansion | |
      5. 3.1.5 ICU Bed Capacity Build-Outs in Emerging Economies | |
      6. 3.1.6 Reimbursement Reforms for Non-Invasive Hemodynamics | |
      7. 3.1.7 Post-Acquisition Platform Consolidation |
    2. 3.2 Market Restraints Analysis | |
      1. 3.2.1 High Capital Cost of Advanced Monitoring Platforms | |
      2. 3.2.2 Clinical Inertia Favoring Traditional Catheter Techniques | |
      3. 3.2.3 Reimbursement Gaps for Non-Invasive Monitoring Codes | |
      4. 3.2.4 Cybersecurity and Data-Privacy Concerns for Connected Devices | |
      5. 3.2.5 Shortage of Trained Perfusionists and Critical-Care Nurses |
    3. 3.3 Market Opportunity Analysis | |
      1. 3.3.1 Wearable and Patch-Based Hemodynamic Sensors | |
      2. 3.3.2 AI-Powered Predictive Dashboards and Software Monetization | |
      3. 3.3.3 Emerging-Market Hospital Infrastructure Build-Outs | |
      4. 3.3.4 Perioperative and Ambulatory Surgical Center Expansion | |
      5. 3.3.5 Data Monetization Through Clinical Registries |
    4. 3.4 Industry Value Chain Analysis |
    5. 3.5 Porter's Five Forces Analysis
  4. 4 Global Hemodynamic Monitoring System Market Size & Forecast (2021–2035) |
    1. 4.1 Historical Market Size (2021–2025) |
    2. 4.2 Current & Forecast Market Size (2026–2035) |
    3. 4.3 Market Size by Revenue (USD Billion) |
    4. 4.4 Year-over-Year Growth Analysis
  5. 5 Segmentation Analysis |
    1. 5.1 By System Type | |
      1. 5.1.1 Minimally Invasive Monitoring Systems | |
      2. 5.1.2 Non-Invasive Monitoring Systems | |
      3. 5.1.3 Invasive Monitoring Systems |
    2. 5.2 By Device | |
      1. 5.2.1 Pulmonary Artery Catheters | |
      2. 5.2.2 Pulse Contour Analysis Devices | |
      3. 5.2.3 Wearable Doppler Ultrasound Patches | |
      4. 5.2.4 Bioimpedance/Bioreactance Devices | |
      5. 5.2.5 Finger-Cuff Photoplethysmography Devices | |
      6. 5.2.6 Other Devices |
    3. 5.3 By End User | |
      1. 5.3.1 Hospitals and Clinics | |
      2. 5.3.2 Ambulatory Surgical Centers | |
      3. 5.3.3 Home-Care and Remote Monitoring | |
      4. 5.3.4 Cardiac Catheterization Laboratories
  6. 6 Regional Analysis |
    1. 6.1 North America | |
      1. 6.1.1 United States | |
      2. 6.1.2 Canada | |
      3. 6.1.3 Mexico |
    2. 6.2 Europe | |
      1. 6.2.1 Germany | |
      2. 6.2.2 United Kingdom | |
      3. 6.2.3 France | |
      4. 6.2.4 Italy | |
      5. 6.2.5 Spain | |
      6. 6.2.6 Nordic Countries | |
      7. 6.2.7 Russia | |
      8. 6.2.8 Rest of Europe |
    3. 6.3 Asia-Pacific | |
      1. 6.3.1 China | |
      2. 6.3.2 India | |
      3. 6.3.3 Japan | |
      4. 6.3.4 South Korea | |
      5. 6.3.5 ASEAN | |
      6. 6.3.6 Rest of Asia-Pacific |
    4. 6.4 South America | |
      1. 6.4.1 Brazil | |
      2. 6.4.2 Argentina | |
      3. 6.4.3 Rest of South America |
    5. 6.5 Middle East & Africa | |
      1. 6.5.1 Saudi Arabia | |
      2. 6.5.2 UAE | |
      3. 6.5.3 South Africa | |
      4. 6.5.4 Egypt | |
      5. 6.5.5 Rest of MEA
  7. 7 Competitive Landscape |
    1. 7.1 Market Share Analysis (2025) |
    2. 7.2 Competitive Benchmarking Matrix |
    3. 7.3 Company Profiles | |
      1. 7.3.1 Becton, Dickinson and Company (BD) | |
      2. 7.3.2 Getinge AB | |
      3. 7.3.3 ICU Medical, Inc. | |
      4. 7.3.4 Baxter International (Cheetah Medical) | |
      5. 7.3.5 LiDCO Group plc | |
      6. 7.3.6 CNSystems Medizintechnik AG | |
      7. 7.3.7 Deltex Medical Group plc | |
      8. 7.3.8 Mindray Medical International | |
      9. 7.3.9 Osypka Medical GmbH | |
      10. 7.3.10 Uscom Ltd
  8. 8 Future Outlook & Strategic Recommendations (2026–2035) |
    1. 8.1 AI-Autonomous Clinical Decision Support |
    2. 8.2 Platform Economics and Subscription-Based Revenue Models |
    3. 8.3 Miniaturization and Ambulatory Continuous Monitoring |
    4. 8.4 ESG, Sustainability, and Disposable Reduction
  9. 9 Recent Developments & News
  10. 10 Frequently Asked Questions (FAQs)
  11. 11 Report Scope & Methodology |
    1. 11.1 Study Period & Base Year |
    2. 11.2 Data Sources & Citations |
    3. 11.3 Abbreviations
  12. 12 LIST OF TABLES |
  13. TABLE 1 Global Hemodynamic Monitoring System Market Size & Forecast, by Revenue (USD Billion), 2021–2035 |
  14. TABLE 2 Global Hemodynamic Monitoring System Market — Year-over-Year Growth Analysis, 2021–2035 |
  15. TABLE 3 Market Driver Impact Analysis — Hemodynamic Monitoring System Market |
  16. TABLE 4 Market Restraint Impact Analysis — Hemodynamic Monitoring System Market |
  17. TABLE 5 Global Hemodynamic Monitoring System Market Size, by System Type, 2021–2035 (USD Billion) |
  18. TABLE 6 Global Hemodynamic Monitoring System Market Size, by Device, 2021–2035 (USD Billion) |
  19. TABLE 7 Global Hemodynamic Monitoring System Market Size, by End User, 2021–2035 (USD Billion) |
  20. TABLE 8 Global Hemodynamic Monitoring System Market Size, by Region, 2021–2035 (USD Billion) |
  21. TABLE 9 North America Hemodynamic Monitoring System Market Size, by Country, 2021–2035 (USD Billion) |
  22. TABLE 10 Europe Hemodynamic Monitoring System Market Size, by Country, 2021–2035 (USD Billion) |
  23. TABLE 11 Asia-Pacific Hemodynamic Monitoring System Market Size, by Country, 2021–2035 (USD Billion) |
  24. TABLE 12 South America Hemodynamic Monitoring System Market Size, by Country, 2021–2035 (USD Billion) |
  25. TABLE 13 Middle East & Africa Hemodynamic Monitoring System Market Size, by Country, 2021–2035 (USD Billion) |
  26. TABLE 14 Competitive Benchmarking Matrix — Global Hemodynamic Monitoring System Market, 2025 |
  27. TABLE 15 Company Profiles — Key Players, Hemodynamic Monitoring System Market |
  28. TABLE 16 Recent Developments & Strategic Announcements, 2023–2025 |
  29. TABLE 17 Report Scope & Methodology Summary |
  30. TABLE 18 Detailed Sources and Citations |
  31. TABLE 19 North America Hemodynamic Monitoring System Market Size, by System Type, 2021–2035 (USD Billion) |
  32. TABLE 20 North America Hemodynamic Monitoring System Market Size, by Device, 2021–2035 (USD Billion) |
  33. TABLE 21 North America Hemodynamic Monitoring System Market Size, by End User, 2021–2035 (USD Billion) |
  34. TABLE 22 Europe Hemodynamic Monitoring System Market Size, by System Type, 2021–2035 (USD Billion) |
  35. TABLE 23 Europe Hemodynamic Monitoring System Market Size, by Device, 2021–2035 (USD Billion) |
  36. TABLE 24 Europe Hemodynamic Monitoring System Market Size, by End User, 2021–2035 (USD Billion) |
  37. TABLE 25 Asia-Pacific Hemodynamic Monitoring System Market Size, by System Type, 2021–2035 (USD Billion) |
  38. TABLE 26 Asia-Pacific Hemodynamic Monitoring System Market Size, by Device, 2021–2035 (USD Billion) |
  39. TABLE 27 Asia-Pacific Hemodynamic Monitoring System Market Size, by End User, 2021–2035 (USD Billion) |
  40. TABLE 28 South America Hemodynamic Monitoring System Market Size, by System Type, 2021–2035 (USD Billion) |
  41. TABLE 29 South America Hemodynamic Monitoring System Market Size, by Device, 2021–2035 (USD Billion) |
  42. TABLE 30 South America Hemodynamic Monitoring System Market Size, by End User, 2021–2035 (USD Billion) |
  43. TABLE 31 Middle East & Africa Hemodynamic Monitoring System Market Size, by System Type, 2021–2035 (USD Billion) |
  44. TABLE 32 Middle East & Africa Hemodynamic Monitoring System Market Size, by Device, 2021–2035 (USD Billion) |
  45. TABLE 33 Middle East & Africa Hemodynamic Monitoring System Market Size, by End User, 2021–2035 (USD Billion)
  46. 13 LIST OF FIGURES |
  47. FIGURE 1 Hemodynamic Monitoring System Market Dynamics — Drivers, Restraints, and Opportunities |
  48. FIGURE 2 Value Chain Analysis — Hemodynamic Monitoring System Market |
  49. FIGURE 3 Porter's Five Forces Analysis — Hemodynamic Monitoring System Market |
  50. FIGURE 4 Global Hemodynamic Monitoring System Market Size Trend (USD Billion), 2021–2035 |
  51. FIGURE 5 Hemodynamic Monitoring System Market Share, by System Type (%), 2025 |
  52. FIGURE 6 Hemodynamic Monitoring System Market Share, by Device (%), 2025 |
  53. FIGURE 7 Hemodynamic Monitoring System Market Share, by End User (%), 2025 |
  54. FIGURE 8 Hemodynamic Monitoring System Market Share, by Region (%), 2025 |
  55. FIGURE 9 North America Hemodynamic Monitoring System Market Share, by Country (%), 2025 |
  56. FIGURE 10 Europe Hemodynamic Monitoring System Market Share, by Country (%), 2025 |
  57. FIGURE 11 Asia-Pacific Hemodynamic Monitoring System Market Share, by Country (%), 2025 |
  58. FIGURE 12 South America Hemodynamic Monitoring System Market Share, by Country (%), 2025 |
  59. FIGURE 13 Middle East & Africa Hemodynamic Monitoring System Market Share, by Country (%), 2025 |
  60. FIGURE 14 Competitive Landscape — Hemodynamic Monitoring System Market Revenue Share Matrix, 2025

Segmentation Quick Reference

DimensionSub-SegmentsDominant SegmentFastest Growing Segment
By System TypeMinimally Invasive Monitoring Systems; Non-Invasive Monitoring Systems; Invasive Monitoring SystemsMinimally Invasive Monitoring Systems (~46% share, 2025)Non-Invasive Monitoring Systems (5.35% CAGR)
By DevicePulmonary Artery Catheters; Pulse Contour Analysis Devices; Wearable Doppler Ultrasound Patches; Bioimpedance/Bioreactance Devices; Finger-Cuff Photoplethysmography Devices; Other DevicesPulmonary Artery Catheters (~31% share, 2025)Wearable Doppler Ultrasound Patches (8.05% CAGR)
By End UserHospitals and Clinics; Ambulatory Surgical Centers; Home-Care and Remote Monitoring; Cardiac Catheterization LaboratoriesHospitals and Clinics (~55% share, 2025)Ambulatory Surgical Centers (5.60% CAGR)
By GeographyNorth America; Europe; Asia-Pacific; South America; Middle East & AfricaNorth America (~43% share, 2025)Asia-Pacific (6.50% CAGR)


Market Segmentation Overview

By System Type

Sub-SegmentKey Trend
Minimally Invasive Monitoring SystemsPulse-contour and transpulmonary thermodilution platforms replacing traditional PA catheters in general ICU settings
Non-Invasive Monitoring SystemsFinger-cuff photoplethysmography and bioimpedance technologies gaining acceptance for perioperative and ambulatory use
Invasive Monitoring SystemsRetained in high-acuity indications — cardiac transplant, ECMO, and complex valvular surgery — where direct intracardiac pressure data remains clinically essential


The system-type segmentation reflects a clear adoption curve away from fully invasive catheter technologies toward platforms that deliver comparable hemodynamic data with lower procedural risk and reduced nursing workload.

By Device

Sub-SegmentKey Trend
Pulmonary Artery CathetersVolume stable in transplant and LVAD programs; declining in general critical care as minimally invasive alternatives gain evidence
Pulse Contour Analysis DevicesAnchored by BD FloTrac and Getinge PiCCO platforms; growth tied to ERAS surgical protocol expansion
Wearable Doppler Ultrasound PatchesEmerging disruptive form factor enabling ambulatory and transport monitoring without arterial lines
Bioimpedance/Bioreactance DevicesGaining traction in step-down units and emergency departments due to rapid, nurse-driven setup
Finger-Cuff Photoplethysmography DevicesCNSystems CNAP and Finapres NOVA driving adoption in European perioperative settings
Other DevicesIncludes esophageal Doppler and electrical velocimetry for neonatal and pediatric ICU applications


The device landscape is diversifying rapidly, with wearable patches and finger-cuff technologies creating addressable segments that did not exist a decade ago and expanding the total market beyond the traditional ICU footprint.

By End User

Sub-SegmentKey Trend
Hospitals and ClinicsCore demand anchor; ICU bed expansion and surgical suite upgrades sustain replacement and new-installation cycles
Ambulatory Surgical CentersERAS compliance driving first-time adoption of compact hemodynamic monitors for outpatient surgical procedures
Home-Care and Remote MonitoringCMS Hospital-at-Home waiver and EU telemedicine mandates opening a new geographic demand layer
Cardiac Catheterization LaboratoriesInterventional cardiology procedure volumes support steady but moderate demand for catheter-based monitoring


End-user diversification beyond the hospital ICU represents the most structurally significant shift in the market, as ambulatory and home-care settings convert from zero monitoring to continuous monitoring at scale.

By Geography

Sub-SegmentKey Trend
North AmericaMature market driven by value-based care incentives, AI algorithm adoption, and the BD–Edwards consolidation
EuropeERAS protocol leadership and EU4Health digital infrastructure grants sustaining steady growth
Asia-PacificGovernment-funded hospital construction in China and India creating large-volume procurement opportunities
South AmericaSUS public-hospital cardiology upgrades in Brazil leading regional demand
Middle East & AfricaVision 2030 mega-hospital projects in Saudi Arabia and medical-tourism construction in the UAE


Regional dynamics reflect a combination of demographic need, infrastructure investment, and reimbursement policy — with Asia-Pacific offering the largest incremental growth opportunity through the forecast period.


 

Download PDF ×

We do not share your information with anyone. However, we may send you emails based on your report interest from time to time. You may contact us at any time to opt-out.