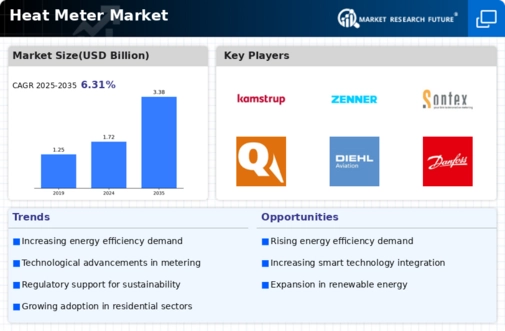
Global Heat Meter Market Overview:
Heat Meter Market Size was valued at USD 1.6 Billion in 2023. The Heat Meter Market industry is projected to grow from USD 1.72 Billion in 2024 to USD 2.81 Billion by 2032, exhibiting a compound annual growth rate (CAGR) of 6.31% during the forecast period (2024 - 2032). Customers' knowledge is rapidly increasing, and the number of heat meter installations by individuals is increasing are the key market drivers enhancing the market growth.

Source: Secondary Research, Primary Research, Market Research Future Database and Analyst Review
Heat Meter Market Trends
-
Increased Concerns about Warming to Drive Market Growth
Market CAGR for heat meter is being driven by the increased concerns about warming. Today, numerous governments have made tremendous efforts to manage the temperature of the air. These laws and regulations play a critical role in shaping the worldwide industry. Furthermore, as a result of the energy flood occuring in various emerging countries, governments around the world are establishing laws to improve the use of heat energy. According to the International Energy Efficiency (IEE) regulatory criteria, for example, the installation of Heat Metre Market plays a critical role in carbonisation. Furthermore, low carbon temperatures that allow greater flexibility can be removed by installing Heat Metre Market, another aspect leading to worldwide market expansion.
Furthermore, rising warming concerns have driven governments to incentivize citizens and industries to minimise and monitor their use of thermal energy in order to mitigate the consequences of climate change induced by human activity. This has boosted the need for the Heat Metre Market in a variety of industries. Furthermore, the rise in energy-related concerns, as well as applicable government rules and regulations pertaining to energy efficiency, are likely to fuel market expansion.
Heaters have made amazing technological improvements in recent years. These technological advancements were mostly highlighted by rising consumer demand for long-lasting products that deliver higher performance at a reduced cost. Furthermore, the sensor in the temperature meter has been greatly enhanced. For example, attempts are being made to develop image-sensing sensors that can correctly measure the composition of fuel and oxidants in industrial systems. This is related to the greater digitalisation of electrical resource generation and the growing usage of regional heating systems. Furthermore, rising demand for accurate and dependable thermal measurement systems, as well as rapid development in the commercial and residential sectors, contribute to market expansion.
Furthermore, larger savings from heat conservation and a statutory requirement to install heat meters are expected to drive market growth in the coming years. Static meters come in a variety of flow rates and are used in building technology, automation, and district heating. Static meters, too, rely on the fluidic oscillator theory to provide accurate flow and energy readings.
Heat Meter Market Segment Insights:
Heat Meter Type Insights
The Heat Meter Market segmentation, based on type includes mechanical, static. In 2022, static category is likely to remain the dominating technology type in the market. Because of considerable utilisation benefits such as accurate data measurement and adaptive and dependable operations, the adoption of effective and sustainable heat management systems that enable real-time data monitoring will drive the market for static heat meters. This technology also provides decreased energy consumption, dependable functioning, and automated billing systems. Consumers' strong preference for smart meters is projected to fuel demand for static heat meter technology.
Heat Meter Connectivity Insights
The Heat Meter Market segmentation, based on connectivity, includes wired, wireless. The wired segment dominated the market in 2022. Wireless heat meters use a number of wireless ways to read the meter, including, among other things, a mobile radio receiver, a Bluetooth interface, and cloud-based technology. The use of radio-frequency modules known as Automatic Metre Reading (AMR) to collect data on heat measurement is a recent breakthrough in heat metering applications. A connected heat meter system provides accurate data readings and a long battery life.
Figure 1: Heat Meter Market, by Connectivity, 2024 & 2032 (USD Billion)

Source: Secondary Research, Primary Research, Market Research Future Database and Analyst Review
Heat Meter End-User Insights
The Heat Meter Market segmentation, based on End-User, includes residential, industrial, and commercial. In 2022, heat meters are used to measure the heat output of industrial equipment such as chillers and boilers. Companies utilise Heat Metres to control their energy costs and ensure that all equipment functions properly. Heat meters have lately been introduced to the design of district heating and cooling systems. Factors such as constantly increasing demand for home automation systems fuel the segment's expansion. Within the projected time range, the Industrial segment is likely to grow at the fastest compound annual growth rate (CAGR).
Heat Meter Regional Insights
By region, the study provides the market insights into North America, Europe, Asia-Pacific and Rest of the World. The North American Heat Meter Market area will dominate this market, owing to National and international organisations, as well as governments from many countries, are increasingly conscious of the need to reduce overall fossil fuel usage and boost energy efficiency. The region's Heat Metre market is expected to increase favorably as a result of the increasing use of district energy services in North America over the last several years.
Further, the major countries studied in the market report are The US, Canada, German, France, the UK, Italy, Spain, China, Japan, India, Australia, South Korea, and Brazil.
Figure 2: Heat Meter Market Share By Region 2022 (USD Billion)

Source: Secondary Research, Primary Research, Market Research Future Database and Analyst Review
Europe Heat Meter Market accounts for the second-largest market share owing to greater government measures for energy conservation through regulation implementation and increased investment in long-term projects. Further, the German Heat Meter Market held the largest market share, and the UK Heat Meter Market was the fastest growing market in the European region
The Asia-Pacific Heat Meter Market is expected to grow at the fastest CAGR from 2023 to 2032. This is because of the hot fluid being cycled via the pipes, which is projected to increase demand. Moreover, China’s Heat Meter Market held the largest market share, and the Indian Heat Meter Market was the fastest growing market in the Asia-Pacific region.
Heat Meter Key Market Players & Competitive Insights
Leading market players are investing heavily in R&D to expand their product lines, which will help the Heat Meter Market, grow even more. Market participants are also undertaking a variety of strategic activities to expand their footprint, with important market developments including new product launches, contractual agreements, mergers and acquisitions, higher investments, and collaboration with other organizations. To expand and survive in a more competitive and rising market climate, Heat Meter industry must offer cost-effective items.
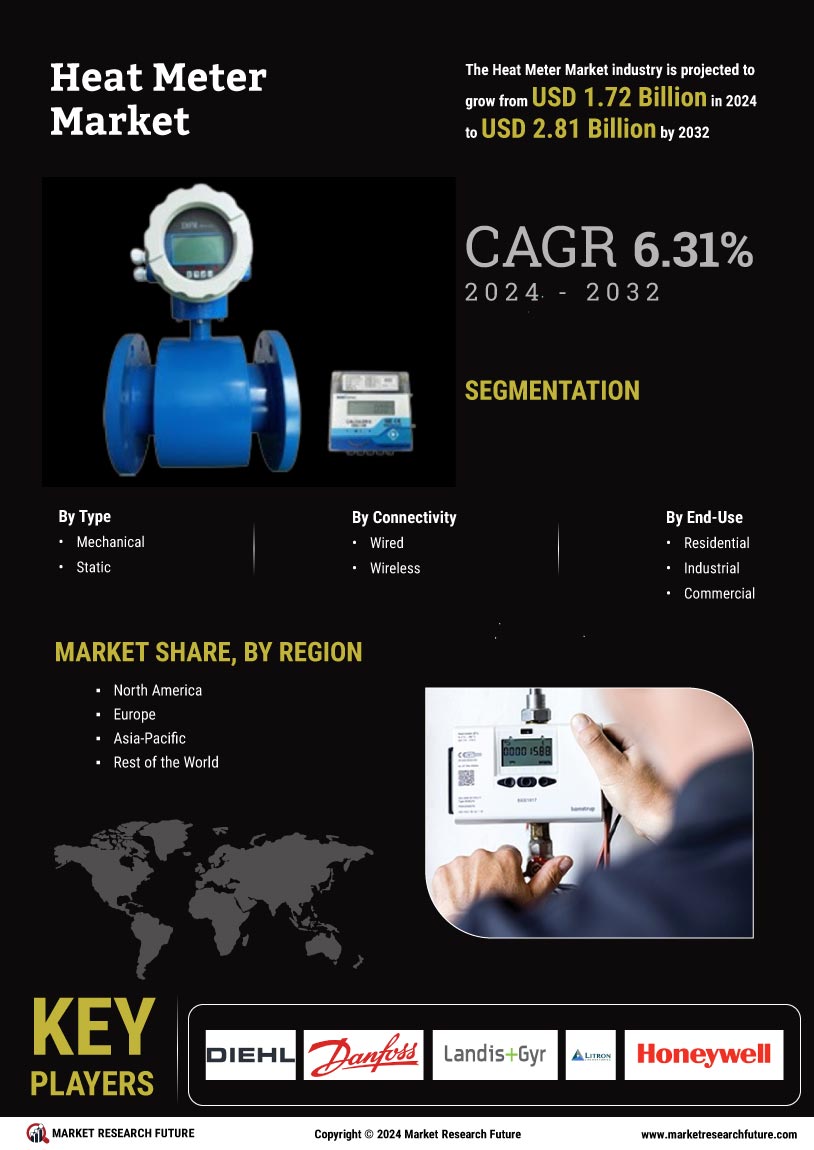
Manufacturing locally to minimize operational costs is one of the key business tactics used by manufacturers in the Heat Meter industry to benefit clients and increase the market sector. In recent years, the Heat Meter industry has offered some of the most significant advantages to medicine. Major players in the Heat Meter Market, including Honeywell Elster (US). Kamstrup (Denmark), Zenner (US), Sontex (Switzerland), Qundis (Germany), and Siemens AG (Germany) and others, are attempting to increase market demand by investing in R&D operations.
Siemens is a German multinational conglomerate and Europe's largest industrial manufacturing firm. Its headquarters are in Munich, and it has a number of foreign branch offices. The company's primary divisions are Digital Industries, Smart Infrastructure, Mobility, Healthcare (named Siemens Healthineers), and Financial Services. The firm is a notable manufacturer of medical diagnostics equipment; its medical health-care segment, which accounts for around 12% of total revenues, is the corporation's second-most lucrative unit after the industrial automation division. It is considered as a pioneer in this field and the corporation with the largest revenue in the world. In July 2020, Siemens India has agreed to buy Delhi-based electrical and electronic equipment maker C&S Electric for Rs 2,100 crore in cash, making it the company's largest acquisition in the nation outside of the group. This will assist Siemens in strengthening their position as the country's provider of low-voltage power distribution and electrical installation technology.
Danfoss is a Danish multinational corporation headquartered in Denmark that employs about 41,928 people worldwide. Engineer Mads Clausen founded Danfoss in 1933. Danfoss has 41,928 employees globally, with its headquarters in Nordborg, Denmark. Danfoss joined the United Nations Compact in 2002, which consists of nine principles relating to social and environmental responsibility. Bitten Clausen established the Bitten og Mads Clausens Fond as a self-governing institution in 1971. The foundation is now the company's largest stakeholder. Mads Clausen (1905-1966) created Dansk Kleautomatik- og Apparatfabrik in 1933; the firm name was changed to Danfoss in 1946. After analysing imported valves from the United States, the first product was developed: an expansion valve for refrigeration systems. In May 2019, The Danfoss team in charge of the research, manufacture, and sales of Heat Metres and Automatic Metre Reading systems has announced the successful completion of a test with narrowband Internet of Things (NB-loT) wireless data transmission.
Key Companies in the Heat Meter market include
Heat Meter Market Industry Developments
-
Q2 2025: Hailin Launches Ultrasonic Heat Meter for Smart Buildings Hailin announced the launch of its HUA series ultrasonic heat meters, designed for smart building applications to optimize energy consumption and provide intelligent solutions using innovative technologies.
Report Attribute/Metric |
Details |
Market Size 2023 |
USD 1.6 Billion |
Market Size 2024 |
USD 1.72 Billion |
Market Size 2032 |
USD 2.8 Billion |
Compound Annual Growth Rate (CAGR) |
6.31% (2024-2032) |
Base Year |
2023 |
Market Forecast Period |
2024-2032 |
Historical Data |
2018- 2022 |
Market Forecast Units |
Value (USD Billion) |
Report Coverage |
Revenue Forecast, Market Competitive Landscape, Growth Factors, and Trends |
Segments Covered |
Type, Connectivity, End-User and Region |
Geographies Covered |
North America, Europe, Asia Pacific, and the Rest of the World |
Countries Covered |
The US, Canada, German, France, the UK, Italy, Spain, China, Japan, India, Australia, South Korea, and Brazil |
Key Companies Profiled |
Diehl (Germany), Danfoss (Denrnark), Landis+ Gyr (Switzerland), Iron (US), Honeywell Elster (US). Kamstrup (Denmark), Zenner (US), Sontex (Switzerland), Qundis (Germany), and Siemens AG (Germany). |
Key Market Opportunities |
Product releases and R&D by significant critical players. |
Key Market Dynamics |
Heat metres are required by law to be installed. |
Heat Meter Market Highlights:
Frequently Asked Questions (FAQ):
The Heat Meter Market size was valued at USD 1.6 Billion in 2023.
The market is projected to grow at a CAGR of 6.31% during the forecast period, 2024-2032.
North America had the largest share in the market
The key players in the market are Honeywell Elster (US). Kamstrup (Denmark), Zenner (US), Sontex (Switzerland), Qundis (Germany), and Siemens AG (Germany).
The Wireless category dominated the market in 2022.
The industrial had the largest share in the market.
Table of content
1 Executive Summary
2 Scope of the Report
2.1 Market Definition
2.2 Scope of the Study
2.2.1 Definition
2.2.2 Research Objective
2.2.3 Assumptions
2.2.4 Limitations
2.3 Research Process
2.3.1 Primary Research
2.3.2 Secondary Research
2.4 Market size Estimation
2.5 Forecast Model
3 Market Landscape
3.1 Porter’s Five Forces Analysis
3.1.1 Threat of New Entrants
3.1.2 Bargaining power of buyers
3.1.3 Bargaining power of suppliers
3.1.4 Threat of substitutes
3.1.5 Segment rivalry
3.2 Value Chain/Supply Chain Analysis
4 Market Dynamics
4.1 Introduction
4.2 Market Drivers
4.3 Market Restraints
4.4 Market Opportunities
4.5 Market Trends
5 Global Market, By Type
5.1 Introduction
5.2 Mechanical Heat Meter
5.2.1 Market Estimates & Forecast, 2023-2032
5.2.2 Market Estimates & Forecast by Region, 2023-2032
5.3 Static Heat Meter
5.3.1 Market Estimates & Forecast, 2023-2032
5.3.2 Market Estimates & Forecast by Region, 2023-2032
6 Global Market, By Connectivity
6.1 Introduction
6.2 Wired Connection
6.2.1 Market Estimates & Forecast, 2023-2032
6.2.2 Market Estimates & Forecast by Region, 2023-2032
6.3 Wireless Connection
6.3.1 Market Estimates & Forecast, 2023-2032
6.3.2 Market Estimates & Forecast by Region, 2023-2032
7 Global Market, By End-User
7.1 Introduction
7.2 Residential
7.2.1 Market Estimates & Forecast, 2023-2032
7.2.2 Market Estimates & Forecast by Region, 2023-2032
7.3 Industrial
7.3.1 Market Estimates & Forecast, 2023-2032
7.3.2 Market Estimates & Forecast by Region, 2023-2032
7.4 Commercial
7.4.1 Market Estimates & Forecast, 2023-2032
7.4.2 Market Estimates & Forecast by Region, 2023-2032
7.5 Others
7.4.1 Market Estimates & Forecast, 2023-2032
7.4.2 Market Estimates & Forecast by Region, 2023-2032
8 Global Market, By Region
8.1 Introduction
8.2 North America
8.2.1 Market Estimates & Forecast, 2023-2032
8.2.2 Market Estimates & Forecast by Type, 2023-2032
8.2.3 Market Estimates & Forecast by Connectivity, 2023-2032
8.2.4 Market Estimates & Forecast by End-User, 2023-2032
8.2.5 US
8.2.5.1 Market Estimates & Forecast, 2023-2032
8.2.5.2 Market Estimates & Forecast by Type, 2023-2032
8.2.5.3 Market Estimates & Forecast by Connectivity, 2023-2032
8.2.5.4 Market Estimates & Forecast by End-Use, 2023-2032
8.2.6 Canada
8.2.6.1 Market Estimates & Forecast, 2023-2032
8.2.6.2 Market Estimates & Forecast by Type, 2023-2032
8.2.6.3 Market Estimates & Forecast by Connectivity, 2023-2032
8.2.6.4 Market Estimates & Forecast by End-Use, 2023-2032
8.3 Europe
8.3.1 Market Estimates & Forecast, 2023-2032
8.3.2 Market Estimates & Forecast by Type, 2023-2032
8.3.3 Market Estimates & Forecast by Connectivity, 2023-2032
8.3.4 Market Estimates & Forecast by End-Use, 2023-2032
8.3.5 U.K.
8.3.5.1 Market Estimates & Forecast, 2023-2032
8.3.5.2 Market Estimates & Forecast by Type, 2023-2032
8.3.5.3 Market Estimates & Forecast by Connectivity, 2023-2032
8.3.5.4 Market Estimates & Forecast by End-Use, 2023-2032
8.3.6 Germany
8.3.6.1 Market Estimates & Forecast, 2023-2032
8.3.6.2 Market Estimates & Forecast by Type, 2023-2032
8.3.6.3 Market Estimates & Forecast by Connectivity, 2023-2032
8.3.6.4 Market Estimates & Forecast by End-Use, 2023-2032
8.3.7 France
8.3.7.1 Market Estimates & Forecast, 2023-2032
8.3.7.2 Market Estimates & Forecast by Type, 2023-2032
8.3.7.3 Market Estimates & Forecast by Connectivity, 2023-2032
8.3.7.4 Market Estimates & Forecast by End-Use, 2023-2032
8.3.8 Italy
8.3.8.1 Market Estimates & Forecast, 2023-2032
8.3.8.2 Market Estimates & Forecast by Type, 2023-2032
8.3.8.3 Market Estimates & Forecast by Connectivity, 2023-2032
8.3.8.4 Market Estimates & Forecast by End-Use, 2023-2032
8.3.9 Rest of Europe
8.3.9.1 Market Estimates & Forecast, 2023-2032
8.3.9.2 Market Estimates & Forecast by Type, 2023-2032
8.3.9.3 Market Estimates & Forecast by Connectivity, 2023-2032
8.3.9.4 Market Estimates & Forecast by End-Use, 2023-2032
8.4 Asia-Pacific
8.4.1 Market Estimates & Forecast, 2023-2032
8.4.2 Market Estimates & Forecast by Type, 2023-2032
8.4.3 Market Estimates & Forecast by Connectivity, 2023-2032
8.4.4 Market Estimates & Forecast by End-Use, 2023-2032
8.4.5 China
8.4.5.1 Market Estimates & Forecast, 2023-2032
8.4.5.2 Market Estimates & Forecast by Type, 2023-2032
8.4.5.3 Market Estimates & Forecast by Connectivity, 2023-2032
8.4.5.4 Market Estimates & Forecast by End-Use, 2023-2032
8.4.6 Japan
8.4.6.1 Market Estimates & Forecast, 2023-2032
8.4.6.2 Market Estimates & Forecast by Type, 2023-2032
8.4.6.3 Market Estimates & Forecast by Connectivity, 2023-2032
8.4.6.4 Market Estimates & Forecast by End-Use, 2023-2032
8.4.7 India
8.4.7.1 Market Estimates & Forecast, 2023-2032
8.4.7.2 Market Estimates & Forecast by Type, 2023-2032
8.4.7.3 Market Estimates & Forecast by Connectivity, 2023-2032
8.4.7.4 Market Estimates & Forecast by End-Use, 2023-2032
8.4.8 Rest of Asia-Pacific
8.4.8.1 Market Estimates & Forecast, 2023-2032
8.4.8.2 Market Estimates & Forecast by Type, 2023-2032
8.4.8.3 Market Estimates & Forecast by Connectivity, 2023-2032
8.4.8.4 Market Estimates & Forecast by End-Use, 2023-2032
8.5 Middle East & Africa
8.5.1 Market Estimates & Forecast, 2023-2032
8.5.2 Market Estimates & Forecast by Type, 2023-2032
8.5.3 Market Estimates & Forecast by Connectivity, 2023-2032
8.5.4 Market Estimates & Forecast by End-Use, 2023-2032
8.5.5 Saudi Arabia
8.5.5.1 Market Estimates & Forecast, 2023-2032
8.5.5.2 Market Estimates & Forecast by Type, 2023-2032
8.5.5.3 Market Estimates & Forecast by Connectivity, 2023-2032
8.5.5.4 Market Estimates & Forecast by End-Use, 2023-2032
8.5.6 South Africa
8.5.6.1 Market Estimates & Forecast, 2023-2032
8.5.6.2 Market Estimates & Forecast by Type, 2023-2032
8.5.6.3 Market Estimates & Forecast by Connectivity, 2023-2032
8.5.6.4 Market Estimates & Forecast by End-Use, 2023-2032
8.5.7 UAE
8.5.7.1 Market Estimates & Forecast, 2023-2032
8.5.7.2 Market Estimates & Forecast by Type, 2023-2032
8.5.7.3 Market Estimates & Forecast by Connectivity, 2023-2032
8.5.7.4 Market Estimates & Forecast by End-Use, 2023-2032
8.5.8 Rest of Middle East & Africa
8.5.8.1 Market Estimates & Forecast, 2023-2032
8.5.8.2 Market Estimates & Forecast by Type, 2023-2032
8.5.8.3 Market Estimates & Forecast by Connectivity, 2023-2032
8.5.8.4 Market Estimates & Forecast by End-Use, 2023-2032
8.6 South America
8.6.1 Market Estimates & Forecast, 2023-2032
8.6.2 Market Estimates & Forecast by Type, 2023-2032
8.6.3 Market Estimates & Forecast by Connectivity, 2023-2032
8.6.4 Market Estimates & Forecast by End-Use, 2023-2032
8.6.5 Brazil
8.6.5.1 Market Estimates & Forecast, 2023-2032
8.6.5.2 Market Estimates & Forecast by Type, 2023-2032
8.6.5.3 Market Estimates & Forecast by Connectivity, 2023-2032
8.6.5.4 Market Estimates & Forecast by End-Use, 2023-2032
8.6.6 Argentina
8.6.6.1 Market Estimates & Forecast, 2023-2032
8.6.6.2 Market Estimates & Forecast by Type, 2023-2032
8.6.6.3 Market Estimates & Forecast by Connectivity, 2023-2032
8.6.6.4 Market Estimates & Forecast by End-Use, 2023-2032
8.6.8 Rest of South America
8.6.8.1 Market Estimates & Forecast, 2023-2032
8.6.8.2 Market Estimates & Forecast by Type, 2023-2032
8.6.8.3 Market Estimates & Forecast by Connectivity, 2023-2032
8.6.8.4 Market Estimates & Forecast by End-Use, 2023-2032
9 Competitive Landscape
10 Company Profile
10.1 Diehl (Germany)
10.1.1 Company Overview
10.1.2 Product/Services Offering
10.1.3 Financial Overview
10.1.4 Key Developments
10.1.5 Strategy
10.1.6 SWOT Analysis
10.2 Danfoss (Denmark)
10.2.1 Company Overview
10.2.2 Product /Services Offering
10.2.3 Financial Overview
10.2.4 Key Developments
10.2.5 Strategy
10.2.6 SWOT Analysis
10.3 Landis+Gyr (Switzerland)
10.3.1 Company Overview
10.3.2 Product /Services Offering
10.3.3 Financial Overview
10.3.4 Key Developments
10.3.5 Strategy
10.3.6 SWOT Analysis
10.4 Itron (US)
10.4.1 Company Overview
10.4.2 Product /Services Offering
10.4.3 Financial Overview
10.4.4 Key Developments
10.4.5 Strategy
10.4.6 SWOT Analysis
10.5 Honeywell Elster (US)
10.5.1 Company Overview
10.5.2 Product /Services Offering
10.5.3 Financial Overview
10.5.4 Key Developments
10.5.5 Strategy
10.5.6 SWOT Analysis
10.6 Kamstrup (Denmark)
10.6.1 Company Overview
10.6.2 Product /Services Offering
10.6.3 Financial Overview
10.6.4 Key Developments
10.6.5 Strategy
10.6.6 SWOT Analysis
10.7 Zenner (US)
10.7.1 Company Overview
10.7.2 Product /Services Offering
10.7.3 Financial Overview
10.7.4 Key Developments
10.7.5 Strategy
10.7.6 SWOT Analysis
10.8 Sontex (Switzerland)
10.8.1 Company Overview
10.8.2 Product /Services Offering
10.8.3 Financial Overview
10.8.4 Key Developments
10.8.5 Strategy
10.8.6 SWOT Analysis
10.9 Qundis (Germany)
10.9.1 Company Overview
10.9.2 Product /Services Offering
10.9.3 Financial Overview
10.9.4 Key Developments
10.9.5 Strategy
10.9.6 SWOT Analysis
10.10 Siemens AG (Germany)
10.10.1 Company Overview
10.10.2 Product /Services Offering
10.10.3 Financial Overview
10.10.4 Key Developments
10.10.5 Strategy
10.10.6 SWOT Analysis
List of Tables
Table 1 Global Market: By Region, 2023-2032
Table 2 North America Market: By Country, 2023-2032
Table 3 Europe Market: By Country, 2023-2032
Table 4 Asia-Pacific Market: By Country, 2023-2032
Table 5 Middle East & Africa Market: By Country, 2023-2032
Table 7 South America Market: By Country, 2023-2032
Table 8 Global Market by Type: By Regions, 2023-2032
Table 9 North America Market by Type: By Country, 2023-2032
Table 10 Europe Market by Type: By Type, 2023-2032
Table 11 Asia-Pacific Market by Type: By Type, 2023-2032
Table 12 Middle East & Africa Market by Type: By Country, 2023-2032
Table 13 South America Market by Type: By Country, 2023-2032
Table 14 Global Market, by Type, By Regions, 2023-2032
Table 15 North America Market, by Type, By Country, 2023-2032
Table 16 Europe Market, by Type, By Country, 2023-2032
Table 17 Asia-Pacific Market, by Type, By Country, 2023-2032
Table 18 Middle East & Africa Market, by Type, By Country, 2023-2032
Table 19 South America Market, by Type, By Country, 2023-2032
Table 20 Global Market, by End-User, By Regions, 2023-2032
Table 21 North America Market, by End-User, By Country, 2023-2032
Table 22 Europe Market, by End-User, By Country, 2023-2032
Table 23 Asia-Pacific Market, by End-User, By Country, 2023-2032
Table 24 Middle East & Africa Market, by End-User, By Country, 2023-2032
Table 25 South America Market, by End-User, By Country, 2023-2032
Table 26 Global Market: By Region, 2023-2032
Table 27 North America Market, By Country
Table 28 North America Market, by Type
Table 29 North America Market, By Connectivity
Table 30 North America Market, By End-User
Table 31 Europe: Market, By Country
Table 32 Europe: Market, by Type
Table 33 Europe: Market, By Connectivity
Table 34 Europe: Market, By End-User
Table 35 Asia-Pacific: Market, By Country
Table 36 Asia-Pacific: Market, by Type
Table 37 Asia-Pacific: Market, By Connectivity
Table 38 Asia-Pacific: Market, By End-User
Table 39 Middle East & Africa: Market, By Country
Table 40 Middle East & Africa: Market, by Type
Table 41 Middle East & Africa: Market, By Connectivity
Table 42 Middle East & Africa: Market, By End-User
Table 43 South America: Market, By Country
Table 44 South America: Market, by Type
Table 45 South America: Market, By Connectivity
Table 46 South America: Market, By End-User
List of Figures
FIGURE 1 RESEARCH PROCESS OF MRFR
FIGURE 2 TOP DOWN & BOTTOM UP APPROACH
FIGURE 3 MARKET DYNAMICS
FIGURE 4 IMPACT ANALYSIS: MARKET DRIVERS
FIGURE 5 IMPACT ANALYSIS: MARKET RESTRAINTS
FIGURE 6 PORTER’S FIVE FORCES ANALYSIS
FIGURE 7 VALUE CHAIN ANALYSIS
FIGURE 8 GLOBAL MARKET SHARE, BY TYPE, 2023 (%)
FIGURE 9 GLOBAL MARKET, TYPE, 2023-2032 (USD MILLION)
FIGURE 10 GLOBAL MARKET SHARE, BY CONNECTIVITY, 2023 (%)
FIGURE 11 GLOBAL MARKET, BY CONNECTIVITY, 2023-2032 (USD MILLION)
FIGURE 12 GLOBAL MARKET SHARE (%), BY REGION, 2023
FIGURE 13 GLOBAL MARKET, BY REGION, 2023-2032 (USD MILLION)
FIGURE 14 NORTH AMERICA MARKET SHARE (%), 2023
FIGURE 15 NORTH AMERICA MARKET BY COUNTRY, 2023-2032 (USD MILLION)
FIGURE 16 EUROPE MARKETSHARE (%), 2023
FIGURE 17 EUROPE MARKETBY COUNTRY, 2023-2032 (USD MILLION)
FIGURE 18 ASIA-PACIFIC MARKETSHARE (%), 2023
FIGURE 19 ASIA-PACIFIC MARKETBY COUNTRY, 2023-2032 (USD MILLION)
FIGURE 20 MIDDLE EAST & AFRICA MARKETSHARE (%), 2023
FIGURE 21 MIDDLE EAST & AFRICA MARKETBY COUNTRY, 2023-2032 (USD MILLION)
FIGURE 22 SOUTH AMERICA MARKET SHARE (%), 2023
FIGURE 23 SOUTH AMERICA MARKETBY COUNTRY, 2023-2032 (USD MILLION)