ID: MRFR/F-B & N/3259-HCRR | April, 2018 | Region: Global | 110 pages | Half-Cooked Research Reports
Market Synopsis of Healthy Smoothies Market
Market Definition:
A smoothie is a thick beverage which is prepared by blending raw fruits or vegetables. Healthy smoothie is also similar to a smoothie which is rich in vitamins, fibers, and other nutrients. Healthy smoothies are usually prepared from fruits, vegetables and seeds. Healthy smoothies are extremely high in nutirtion, easy to prepare, and can be stored in the refrigerator for later consumption. Commericailly available healthy smoothies in the market have key ingredients as flax, chia seeds, papaya extract, and spinach. Healthy smoothies are a rich source of antioxidants, which attracts the consumers for its health benefits. However, the demand for blended healthy smoothies is increasing, owing to better taste and extra health benefits.
Market Scenario:
A healthy smoothie is a drink which is rich in vitamins, nutrients and other minerals. Healthy smoothies are prepared from rich sources like fruits such as papaya, pomegranate and banana. Banana is a rich source of potassium and promotes cardiovasular health and maintains normal blood pressue levels. Furthermore, smoothies prepared from vegetables like spinach, kale and ginger are good sources of antioxidants and serves as body detoxifier. However, ginger has anti-inflmmatory properties, which makes it suitable for consumers with inflamatory disorders. Healthy smoothies prepared by seeds like flax and chia are rich in fiber and Omega3 fatty acids which promotes heart health. Increasing urbanization, owing to high a demand for healthy drinks is majorly driving the growth of the global healthy smoothies market.
Rising incidences of diseases such as cholesterol, hypertension, and diabetes have surged the consumption of healthy smoothies and beverages owing to their health benefits and their role as an alternative for breakfast drink. However, high processing cost for healthy smoothies is expected to hinder the growth of the market.
Intended Audience:
Key Findings:
Segments:
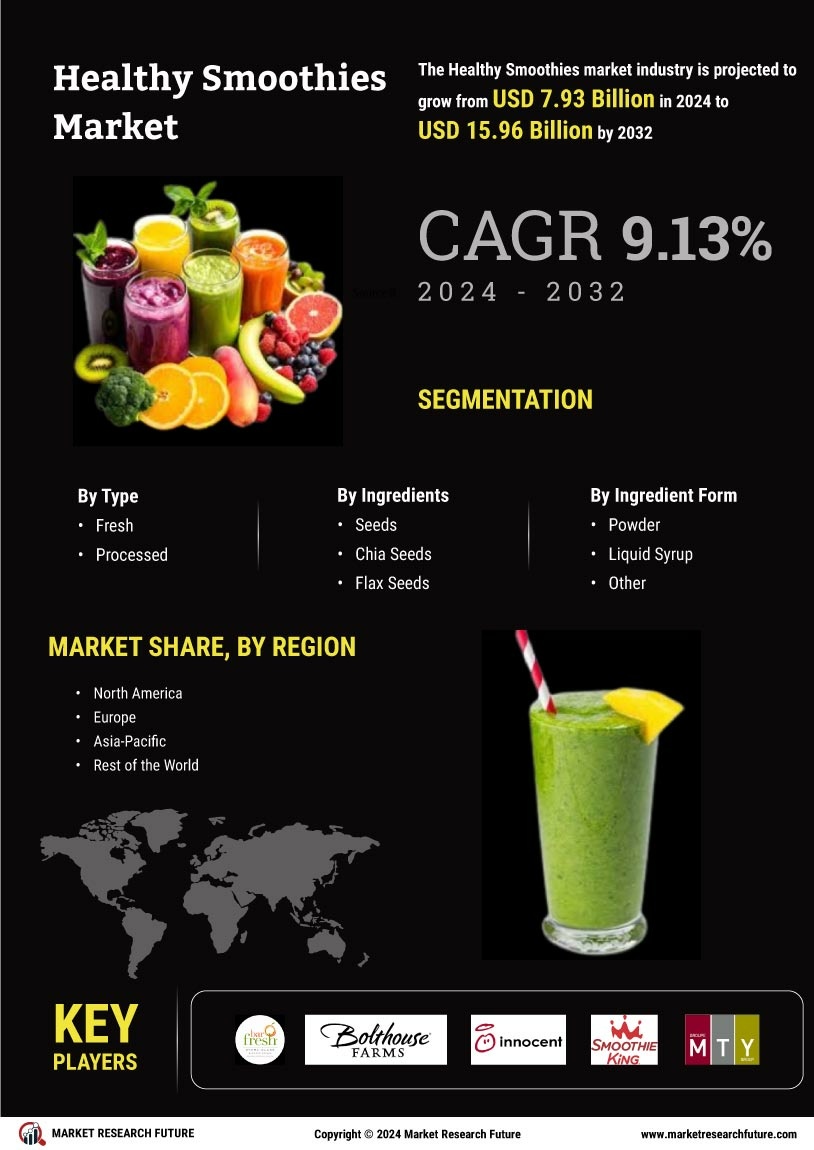
Healthy smoothies is segmented on the basis of the type which includes, fresh and processed healthy smoothies. In this segment, processed healthy smoothies is dominating the market. The processed healthy smoothies market is expected to grow substantially owing to higher shelf life over the forecast period. However, freshly prepared healthy smoothies is experiencing a high demand from consumers owing to absence of added preservatives and is expected to grow during the forecast period.
On the basis of functional ingredients, the healthy smoothies market is segmented in seeds, fruits, vegetables and others. Among all the functional ingredients, fruits and vegetables is dominating the market because of easy availability and high production. However, the demand for seeds based healthy drinks is expected to experience a high demand owing to a wide range health benefits like maintaining healthy cholesterol and blood pressure levels and preventing hypertension.
Furthermore, on the basis of ingredient form, the market is segmented into powder, liquid syrups and others. In this segment, liquid syrups is dominating the market owing consumer preference for pre-prepared drinks.
Regional Analysis:
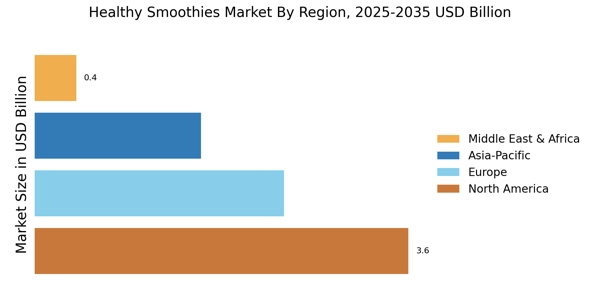
The global healthy smoothies market is segmented into North America, Europe, Asia Pacific, and rest of the world (RoW). The U.S. is dominating in the healthy smoothies market followed by Asia Pacific region. The U.S. has the major consumption of healthy smoothies ingredients, owing to busy lifestyle and deteriorating health conditions in this region.
Moreover, increasing health consciousness and busy life style has shifted the consumers for convenient food in countries like India and China, a healthy growth is expected in the healthy smoothies market in Asia Pacific region. Additionally, high focus on organic smoothies and high-fiber healthy smoothies with added health benefits over conventional smoothies is likely to uplift the market for healthy smoothies at the global level.
Key Players:
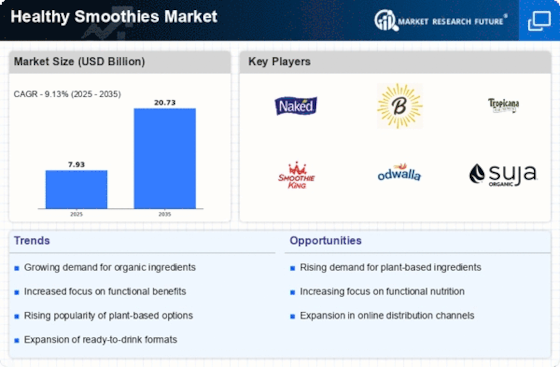
Some of the key players profiled in the global healthy smoothies marke include Bolthouse Farms, Inc. (U.S.), Barfresh Food Group (U.S.), Innocent Drinks (U.K.), Smoothie King (U.S.), MTY Food Group (Canada), Crussh Juice Bars (Australia), Freshens (U.S.)
The global healthy smoothies market is segmented under the following regions
North America
Europe
Asia Pacific
Rest of the world
The report for global healthy smoothies market of Market Research Future comprises of extensive primary research along with the detailed analysis of qualitative as well as quantitative aspects by various industry experts, key opinion leaders to gain the deeper insight of the market and industry performance. The report gives the clear picture of current market scenario which includes historical and projected market size in terms of value and volume, technological advancement, macro economical and governing factors in the market. The report provides details information and strategies of the top key players in the industry. The report also gives a broad study of the different markets segments and regions.
Table of Content
Chapter 1. Methodology and Scope
1.1. Research Methodology
1.1.1 Initial Data Exploration
1.1.2 Statistical Modelling and Forecast
1.1.3 Industry Insights and Validation
1.2. Data Types
Chapter 2. Executive Summary
2.1. Healthy Smoothies Agents Industry Market Synopsis, 2017-2023
2.1.1 Business Trends
2.1.2 Functional ingredients Trends
Chapter 3 Healthy Smoothies Agents Market Insights
3.1 Industry Segmentation
3.2 Industry Size and Forecast
3.3 Industry Ecosystem Analysis
3.4 Industry Impact forces
3.4.1 Growth Drivers
3.4.1.1 Surge in demand for healthy smoothies
3.4.1.2 Alternative to breakfast cereals
3.4.1.3 Natural detoxifier
3.4.2 Industry Pitfalls & Challenges
3.4.2.1 High processing cost
3.4.2.2 Lack of consumer awareness
3.5 Growth Potential Analysis
3.6 Company Market Share Analysis, 2016
3.7 Porter’s Analysis
3.8 PESTEL Analysis
Chapter 4 Healthy Smoothies Agents by Type Insights
4.1 Global Healthy Smoothies Agents Market Volume Share by Type, 2017-2023
4.1.1 Fresh
4.2.1.1 Market Estimates & Forecast, 2017-2023
4.1.2 Processed
4.1.2.1 Market Estimates & Forecast, 2017-2023
Chapter 5 Healthy Smoothies Agents by Functional Ingredients Insights
5.1 Global Healthy Smoothies Agents Market Volume Share by Functional Ingredients, 2017 & 2023
5.1.1 Seeds
5.1.1.1 Chia Seeds
5.1.1.1.1 Market Estimates & Forecast, 2017-2023
5.1.1.2 Flax Seeds
5.1.1.2.1 Market Estimates & Forecast, 2017-2023
5.1.1.3 Pumpkin Seeds
5.1.1.3.1 Market Estimates & Forecast, 2017-2023
5.1.1.4 Others
5.1.1.4.1 Market Estimates & Forecast, 2017-2023
5.1.2 Fruits
5.1.2.1 Papaya
5.1.2.1.1 Market Estimates & Forecast, 2017-2023
5.1.2.2 Banana
5.1.2.2.1 Market Estimates & Forecast, 2017-2023
5.1.2.3 Pomegranate
5.1.2.3.1 Market Estimates & Forecast, 2017-2023
5.1.2.4 Others
5.1.2.4.1 Market Estimates & Forecast, 2017-2023
5.1.3 Vegetables
5.1.3.1 Spinach
5.1.3.1.1 Market Estimates & Forecast, 2017-2023
5.1.3.2 Collards
5.1.3.2.1 Market Estimates & Forecast, 2017-2023
5.1.3.3 Kale
5.1.3.3.1 Market Estimates & Forecast, 2017-2023
5.1.3.4 Ginger
5.1.3.4.1 Market Estimates & Forecast, 2017-2023
5.1.3.5 Others
5.1.3.5.1 Market Estimates & Forecast, 2017-2023
5.1.4 Others
5.1.3.1 Market Estimates & Forecast, 2017-2023
Chapter 6 Healthy Smoothies Agents by Ingredient Form Insights
6.1 Global Healthy smoothies Market Volume Share by Ingredient Form, 2017 & 2023
6.1.1 Powder
6.1.1.1 Market Estimates & Forecast, 2017– 2023
6.1.2 Liquid Syrup
6.1.2.1 Market Estimates & Forecast, 2017 – 2023
6.1.3 Others
6.1.3.1 Market Estimates & Forecast, 2017 – 2023
Chapter 7 Healthy Smoothies Agents Regional Insights
7.1 Healthy Smoothies Agents Market Volume Share by Region, 2017 & 2023.
7.2 North America
7.2. A Market Estimates & Forecast, 2017-2023
7.2. B Market Estimates & Forecast, by Type, 2017-2023
7.2. C Market Estimates & Forecast, by Functional Ingredients, 2017-2023
7.2. D Market Estimates & Forecast, by Ingredient Form, 2017-2023
7.2.1 U.S.
7.2.1.1 Market Estimates & Forecast, 2017-2023
7.2.1.2 Market Estimates & Forecast, by Type, 2017-2023
7.2.1.3 Market Estimates & Forecast, by Functional Ingredients, 2017-2023
7.2.1.4 Market Estimates & Forecast, by Ingredient Form, 2017-2023
7.2.2 Canada
7.2.2.1 Market Estimates & Forecast, 2017-2023
7.2.2.2 Market Estimates & Forecast, by Type, 2017-2023
7.2.2.3 Market Estimates & Forecast, by Functional Ingredients, 2017-2023
7.2.2.4 Market Estimates & Forecast, by Ingredient Form, 2017-2023
7.2.3 Mexico
7.2.3.1 Market Estimates & Forecast, 2017-2023
7.2.3.2 Market Estimates & Forecast, by Type, 2017-2023
7.2.3.3 Market Estimates & Forecast, by Functional Ingredients, 2017-2023
7.2.3.4 Market Estimates & Forecast, by Ingredient Form, 2017-2023
7.3 Europe
7.3.1.1 Market Estimates & Forecast, 2017-2023
7.3.1.2 Market Estimates & Forecast, by Type, 2017-2023
7.3.1.3 Market Estimates & Forecast, by Functional Ingredients, 2017-2023
7.3.1.4 Market Estimates & Forecast, by Ingredient Form, 2017-2023
7.3.1 Germany
7.3.1.1 Market Estimates & Forecast, 2017-2023
7.3.1.2 Market Estimates & Forecast, by Type, 2017-2023
7.3.1.3 Market Estimates & Forecast, by Functional Ingredients, 2017-2023
7.3.1.4 Market Estimates & Forecast, by Ingredient Form, 2017-2023
7.3.2 UK
7.3.2.1 Market Estimates & Forecast, 2017-2023
7.3.2.2 Market Estimates & Forecast, by Type, 2017-2023
7.3.2.3 Market Estimates & Forecast, by Functional Ingredients, 2017-2023
7.3.2.4 Market Estimates & Forecast, by Ingredient Form, 2017-2023
7.3.3 France
7.3.3.1 Market Estimates & Forecast, 2017-2023
7.3.3.2 Market Estimates & Forecast, by Type, 2017-2023
7.3.3.3 Market Estimates & Forecast, by Functional Ingredients, 2017-2023
7.3.3.4 Market Estimates & Forecast, by Ingredient Form, 2017-2023
7.3.4 Italy
7.3.4.1 Market Estimates & Forecast, 2017-2023
7.3.4.2 Market Estimates & Forecast, by Type, 2017-2023
7.3.4.3 Market Estimates & Forecast, by Functional Ingredients, 2017-2023
7.3.4.4 Market Estimates & Forecast, by Ingredient Form, 2017-2023
7.4 Asia Pacific
7.4. A Market Estimates & Forecast, 2017-2023
7.4. B Market Estimates & Forecast, by Type, 2017-2023
7.4. C Market Estimates & Forecast, by Functional Ingredients, 2017-2023
7.4. D Market Estimates & Forecast, by Ingredient Form, 2017-2023
7.4.1 China
7.4.1.1 Market Estimates & Forecast, 2017-2023
7.4.1.2 Market Estimates & Forecast, by Type, 2017-2023
7.4.1.3 Market Estimates & Forecast, by Functional Ingredients, 2017-2023
7.4.1.4 Market Estimates & Forecast, by Ingredient Form, 2017-2023
7.4.2 India
7.4.2.1 Market Estimates & Forecast, 2017-2023
7.4.2.2 Market Estimates & Forecast, by Type, 2017-2023
7.4.2.3 Market Estimates & Forecast, by Functional Ingredients, 2017-2023
7.4.2.4 Market Estimates & Forecast, by Ingredient Form, 2017-2023
7.4.3 Japan
7.4.3.1 Market Estimates & Forecast, 2017-2023
7.4.3.2 Market Estimates & Forecast, by Type, 2017-2023
7.4.3.3 Market Estimates & Forecast, by Functional Ingredients, 2017-2023
7.4.3.4 Market Estimates & Forecast, by Ingredient Form, 2017-2023
7.5 RoW
7.5. A Market Estimates & Forecast, 2017-2023
7.5. B Market Estimates & Forecast, by Type, 2017-2023
7.5. C Market Estimates & Forecast, by Functional Ingredients, 2017-2023
7.5. D Market Estimates & Forecast, by Ingredient Form, 2017-2023
Chapter 8 Competitor Profile
8.1 Bolthouse Farms, Inc. (U.S.)
8.1.1 Business Overview
8.1.2 Financial Data
8.1.3 Product Landscape
8.1.4 Key Developments
8.1.5 Business Strategy
8.1.6 SWOT Analysis
8.2 Barfresh Food Group (U.S.)
8.2.1 Business Overview
8.2.2 Financial Data
8.2.3 Product Landscape
8.2.4 Key Developments
8.2.5 Business Strategy
8.2.6 SWOT Analysis
8.3 Innocent Drinks (U.K.)
8.3.1 Business Overview
8.3.2 Financial Data
8.3.3 Product Landscape
8.3.4 Key Developments
8.3.5 Business Strategy
8.3.6 SWOT Analysis
8.4 Smoothie King (U.S.)
8.4.1 Business Overview
8.4.2 Financial Data
8.4.3 Product Landscape
8.4.4 Key Developments
8.4.5 Business Strategy
8.4.6 SWOT Analysis
8.5 MTY Food Group (Canada)
8.5.1 Business Overview
8.5.2 Financial Data
8.5.3 Product Landscape
8.5.4 Key Developments
8.5.5 Business Strategy
8.5.6 SWOT Analysis
8.6 Crussh Juice Bars (Australia)
8.6.1 Business Overview
8.6.2 Financial Data
8.6.3 Product Landscape
8.6.4 Key Developments
8.6.5 Business Strategy
8.6.6 SWOT Analysis
8.7 Freshens (U.S.)
8.7.1 Business Overview
8.7.2 Financial Data
8.7.3 Product Landscape
8.7.4 Key Developments
8.7.5 Business Strategy
8.7.6 SWOT Analysis
Data Tables
TABLE 1 PESTLE ANALYSIS – U.S.
TABLE 2 PESTLE ANALYSIS- CANADA
TABLE 3 PESTLE ANALYSIS- CHINA
TABLE 4 PESTLE ANALYSIS- FRANCE
TABLE 5 PESTLE ANALYSIS- U.K.
TABLE 6 KEY SUPPLIERS OF HEALTHY SMOOTHIES AGENTS
TABLE 7 GLOBAL MARKET FOR HEALTHY SMOOTHIES AGENTS, BY TYPE, (2017-2023), USD MILLION
TABLE 8 GLOBAL MARKET FOR HEALTHY SMOOTHIES AGENTS, BY FUNCTIONAL INGREDIENTS, (2017-2023), USD MILLION
TABLE 9 GLOBAL MARKET FOR HEALTHY SMOOTHIES AGENTS, BY INGREDIENT FORM, (2017-2023), USD MILLION
TABLE 10 GLOBAL HEALTHY SMOOTHIES AGENTS SALES AND GROWTH RATE (2017-2023) USD MILLION
TABLE 11 GLOBAL MARKET FOR HEALTHY SMOOTHIES AGENTS TOP 5 COUNTRIES
TABLE 12 GLOBAL MARKET FOR HEALTHY SMOOTHIES AGENTS TOP COMPANIES-USD MILLION
TABLE 13 NORTH AMERICAN MARKET FOR HEALTHY SMOOTHIES AGENTS, BY TYPE, (2017-2023) USD MILLION
TABLE 14 NORTH AMERICAN MARKET FOR HEALTHY SMOOTHIES AGENTS, BY FUNCTIONAL INGREDIENTS, (2017-2023), USD MILLION
TABLE 15 NORTH AMERICAN MARKET FOR HEALTHY SMOOTHIES AGENTS, BY INGREDIENT FORM, (2017-2023), USD MILLION
TABLE 16 EUROPEAN MARKET FOR HEALTHY SMOOTHIES AGENTS, BY TYPE, (2017-2023) USD MILLION
TABLE 17 EUROPEAN MARKET FOR HEALTHY SMOOTHIES AGENTS, BY FUNCTIONAL INGREDIENTS, (2017-2023), USD MILLION
TABLE 18 EUROPEAN MARKET FOR HEALTHY SMOOTHIES AGENTS, BY INGREDIENT FORM, (2017-2023), USD MILLION
TABLE 19 APAC MARKET FOR HEALTHY SMOOTHIES AGENTS, BY TYPE, (2017-2023) USD MILLION
TABLE 20 APAC MARKET FOR HEALTHY SMOOTHIES AGENTS, BY FUNCTIONAL INGREDIENTS, (2017-2023), USD MILLION
TABLE 21 APAC MARKET FOR HEALTHY SMOOTHIES AGENTS, BY INGREDIENT FORM, (2017-2023), USD MILLION
TABLE 22 REST OF THE WORLD MARKET FOR HEALTHY SMOOTHIES AGENTS, BY TYPE, (2017-2023) USD MILLION
TABLE 23 REST OF THE WORLD MARKET FOR HEALTHY SMOOTHIES AGENTS, BY FUNCTIONAL INGREDIENTS, (2017-2023), USD MILLION
TABLE 24 REST OF THE WORLD MARKET FOR HEALTHY SMOOTHIES AGENTS, BY INGREDIENT FORM, (2017-2023), USD MILLION
TABLE 25 COMPETITIVE LANDSCAPING BASED ON FINACIALS DURING THE YEAR 2016
Charts & Figures
LIST OF FIGURES
FIGURE 1 RESEARCH METHODOLOGY
FIGURE 2 PRIMARY DATA ANALYSIS APPROACH
FIGURE 3 SECONDARY DATA ANALYSIS APPROACH
FIGURE 4 TRENDS IN HEALTHY SMOOTHIES AGENTS IMPORTS 2011-16
FIGURE 5 GROWTH RATE IN HEALTHY SMOOTHIES AGENTS IMPORTS 2011-16
FIGURE 6 HEALTHY SMOOTHIES AGENTS IMPORTS MARKET SHARE BY TOP 5 IMPORTERS (2011 VS 2016)
FIGURE 7 TRENDS IN HEALTHY SMOOTHIES AGENTS EXPORTS 2011-16
FIGURE 8 GROWTH RATE HEALTHY SMOOTHIES AGENTS EXPORTS 2011-16
FIGURE 9 HEALTHY SMOOTHIES AGENTS EXPORTS MARKET SHARE BY TOP 5 EXPORTERS (2011 VS 2016)
FIGURE 10 VALUE CHAIN ANALYSIS
FIGURE 11 COST ANALYSIS: HEALTHY SMOOTHIES AGENTS
FIGURE 12 PORTER’S FIVE FORCES ANALYSIS
FIGURE 13 GLOBAL MARKET FOR HEALTHY SMOOTHIES AGENTS TRENDS BY TYPE
FIGURE 14 GLOBAL MARKET FOR HEALTHY SMOOTHIES AGENTS TRENDS BY FUNCTIONAL INGREDIENTS
FIGURE 15 GLOBAL MARKET FOR HEALTHY SMOOTHIES AGENTS TRENDS BY INGREDIENT FORM
FIGURE 1 FINANCIALS