Healthcare Electronic Data Interchange Market (2026 - 2035)

ID: MRFR/HC/5869-HCR 90 Pages Vikita Thakur Last Updated: October 27, 2026
Healthcare Electronic Data Interchange (EDI) Market Research Report By Application (Claims Management, Payment Remittance, Order Processing, Eligibility Verification), By End Use (Healthcare Providers, Insurance Payers, Pharmaceutical Companies, Billing Services), By Deployment Type (On-Premises, Cloud-Based, Hybrid), By Transaction Type (Electronic Claims Submission, Electronic Remittance Advice, Patient Information Requests) and By Regional (North America, Europe, South America, Asia Pacific, Middle East and Africa) - Growth & Industry Forecast 2025 To 2035
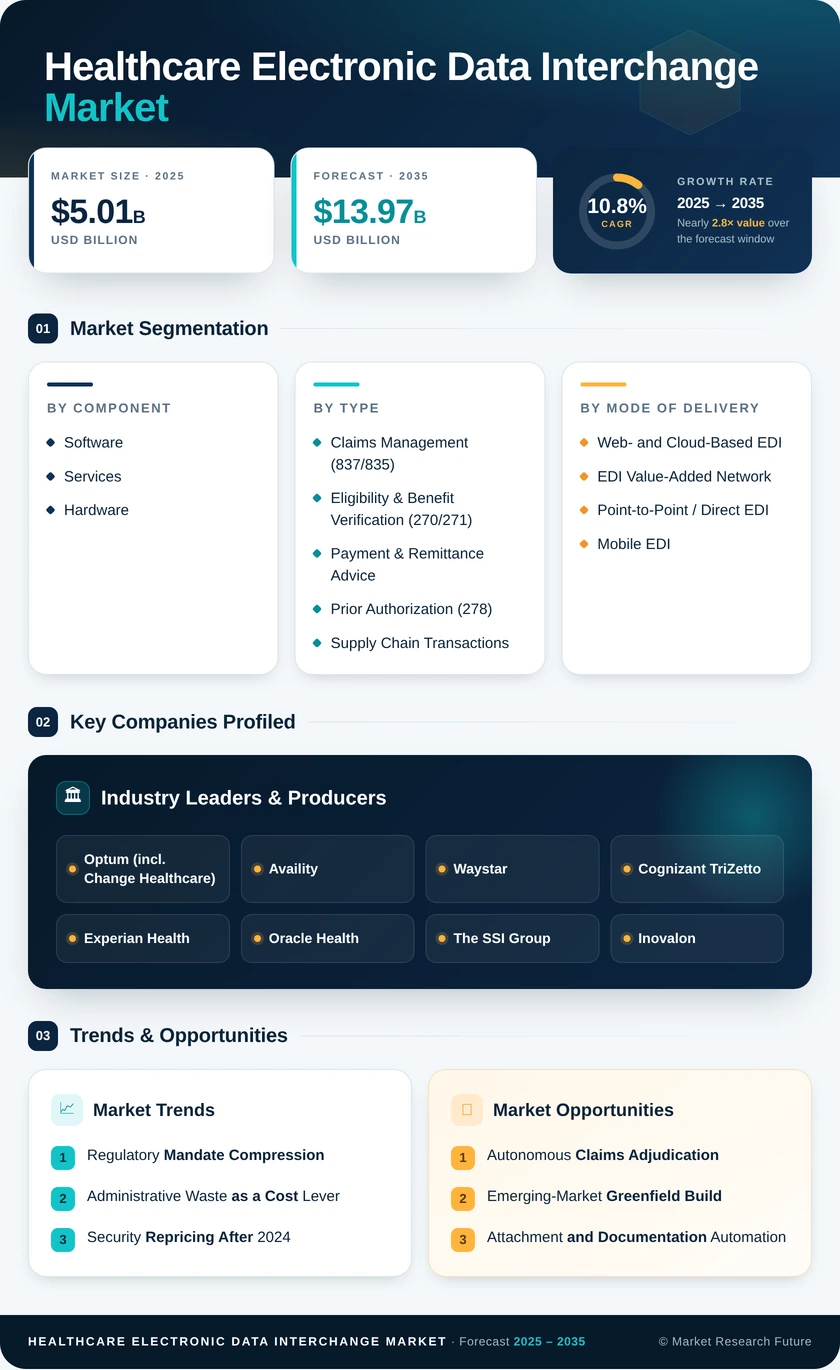
Healthcare Electronic Data Interchange Market
Market Size
Forecast Period2026-2035
CAGR (2026-2035)10.80%
2025 Market SizeUSD 5.01 Billion
2035 Market SizeUSD 13.97 Billion
Key Players
Optum
Availity
Waystar
Cognizant TriZetto
Experian Health
Oracle Health
Opportunities
  • Autonomous Claims Adjudication
  • Emerging-Market Greenfield Build
  • Attachment and Documentation Automation
  1. 1 Market Summary |
    1. 1.1 Study Assumptions & Market Definition |
    2. 1.2 Scope of the Study |
    3. 1.3 Research Methodology
  2. 2 Key Report Takeaways |
    1. 2.1 By Technology |
    2. 2.2 By Sector |
    3. 2.3 By Geography
  3. 3 Market Size & Forecast (2021–2035) |
    1. 3.1 Historical Market Size (2021–2025) |
    2. 3.2 Current & Forecast Market Size (2026–2035) |
    3. 3.3 Year-over-Year Growth Analysis
  4. 4 Driver Impact Analysis |
    1. 4.1 Regulatory Mandate Compression |
    2. 4.2 Administrative Waste as a Cost Lever |
    3. 4.3 Security Repricing After 2024 |
    4. 4.4 Cloud Economics
  5. 5 Restraints Impact Analysis |
    1. 5.1 Legacy Format Entrenchment and FHIR Transition Friction |
    2. 5.2 Payer Companion Guide Variability |
    3. 5.3 Implementation Cost and Talent Scarcity
  6. 6 Opportunities |
    1. 6.1 Autonomous Claims Adjudication |
    2. 6.2 Emerging-Market Greenfield Build |
    3. 6.3 Attachment and Documentation Automation |
    4. 6.4 Data Monetization and Insight Layers |
    5. 6.5 Life-Sciences Supply-Chain Convergence
  7. 7 Regional Market Share & Country-Level Analysis |
    1. 7.1 North America | |
      1. 7.1.1 US | |
      2. 7.1.2 Canada | |
      3. 7.1.3 Mexico |
    2. 7.2 Europe | |
      1. 7.2.1 Germany | |
      2. 7.2.2 UK | |
      3. 7.2.3 France | |
      4. 7.2.4 Italy | |
      5. 7.2.5 Spain | |
      6. 7.2.6 Nordic Countries | |
      7. 7.2.7 Russia | |
      8. 7.2.8 Rest of Europe |
    3. 7.3 Asia-Pacific | |
      1. 7.3.1 China | |
      2. 7.3.2 India | |
      3. 7.3.3 Japan | |
      4. 7.3.4 South Korea | |
      5. 7.3.5 ASEAN | |
      6. 7.3.6 Rest of Asia-Pacific |
    4. 7.4 South America | |
      1. 7.4.1 Brazil | |
      2. 7.4.2 Argentina | |
      3. 7.4.3 Rest of South America |
    5. 7.5 Middle East & Africa | |
      1. 7.5.1 Saudi Arabia | |
      2. 7.5.2 UAE | |
      3. 7.5.3 South Africa | |
      4. 7.5.4 Egypt | |
      5. 7.5.5 Rest of MEA
  8. 8 Future Outlook (2026–2035) |
    1. 8.1 Agentic Automation |
    2. 8.2 Platform Economics |
    3. 8.3 Payment Integration |
    4. 8.4 Trust Infrastructure
  9. 9 Market Segmentation Analysis |
    1. 9.1 By Component | |
      1. 9.1.1 Software | |
      2. 9.1.2 Hardware | |
      3. 9.1.3 Services |
    2. 9.2 By Transaction Type | |
      1. 9.2.1 Claims Management (837/835) | |
      2. 9.2.2 Eligibility & Benefit Verification (270/271) | |
      3. 9.2.3 Payment & Remittance Advice | |
      4. 9.2.4 Prior Authorization (278) | |
      5. 9.2.5 Supply Chain Transactions | |
      6. 9.2.6 Other Transactions |
    3. 9.3 By Mode of Delivery | |
      1. 9.3.1 Web- and Cloud-Based EDI | |
      2. 9.3.2 EDI Value-Added Network | |
      3. 9.3.3 Point-to-Point / Direct EDI | |
      4. 9.3.4 Mobile EDI |
    4. 9.4 By End User | |
      1. 9.4.1 Healthcare Providers | |
      2. 9.4.2 Healthcare Payers | |
      3. 9.4.3 Pharmaceutical & Medical Device Firms | |
      4. 9.4.4 Other End Users
  10. 10 Competitive Landscape |
    1. 10.1 Market Share Analysis (2026) |
    2. 10.2 Competitive Benchmarking Matrix |
    3. 10.3 Company Profiles | |
      1. 10.3.1 Optum (incl. Change Healthcare) | |
      2. 10.3.2 Availity | |
      3. 10.3.3 Waystar | |
      4. 10.3.4 Cognizant TriZetto | |
      5. 10.3.5 Experian Health | |
      6. 10.3.6 Oracle Health | |
      7. 10.3.7 The SSI Group | |
      8. 10.3.8 Inovalon | |
      9. 10.3.9 McKesson | |
      10. 10.3.10 Epic Systems | |
      11. 10.3.11 Quadax
  11. 11 Recent News & Developments
  12. 12 Report Scope & Methodology |
    1. 12.1 Study Period & Base Year |
    2. 12.2 Data Sources & Citations |
    3. 12.3 Abbreviations
  13. 13 Detailed Sources and Citations
  14. 14 Frequently Asked Questions
  15. 15 LIST OF TABLES |
  16. TABLE 1 Global Healthcare EDI Market Size & Forecast, by Revenue (USD Billion), 2021–2035 |
  17. TABLE 2 Global Healthcare EDI Market – Year-over-Year Growth Analysis, 2021–2035 |
  18. TABLE 3 Driver Impact Analysis Matrix, 2026–2035 |
  19. TABLE 4 Restraint Impact Analysis Matrix, 2026–2035 |
  20. TABLE 5 Global Healthcare EDI Market Size, by Region, 2021–2035 (USD Billion) |
  21. TABLE 6 North America Healthcare EDI Market Size, by Country, 2021–2035 (USD Billion) |
  22. TABLE 7 Europe Healthcare EDI Market Size, by Country, 2021–2035 (USD Billion) |
  23. TABLE 8 Asia-Pacific Healthcare EDI Market Size, by Country, 2021–2035 (USD Billion) |
  24. TABLE 9 South America Healthcare EDI Market Size, by Country, 2021–2035 (USD Billion) |
  25. TABLE 10 Middle East & Africa Healthcare EDI Market Size, by Country, 2021–2035 (USD Billion) |
  26. TABLE 11 Global Healthcare EDI Market Size, by Component, 2021–2035 (USD Billion) |
  27. TABLE 12 Global Healthcare EDI Market Size, by Transaction Type, 2021–2035 (USD Billion) |
  28. TABLE 13 Global Healthcare EDI Market Size, by Mode of Delivery, 2021–2035 (USD Billion) |
  29. TABLE 14 Global Healthcare EDI Market Size, by End User, 2021–2035 (USD Billion) |
  30. TABLE 15 North America Healthcare EDI Market Size, by Component and End User, 2021–2035 (USD Billion) |
  31. TABLE 16 Europe Healthcare EDI Market Size, by Transaction Type, 2021–2035 (USD Billion) |
  32. TABLE 17 Asia-Pacific Healthcare EDI Market Size, by Mode of Delivery, 2021–2035 (USD Billion) |
  33. TABLE 18 Competitive Benchmarking Matrix, 2026 |
  34. TABLE 19 Company Profiles – Key Players |
  35. TABLE 20 Recent Developments & Strategic Announcements, 2023–2025 |
  36. TABLE 21 Report Scope & Methodology Summary |
  37. TABLE 22 Detailed Sources and Citations Index
  38. 16 LIST OF FIGURES |
  39. FIGURE 1 Market Dynamics – Drivers, Restraints, and Opportunities Overview |
  40. FIGURE 2 Industry Value Chain Analysis |
  41. FIGURE 3 Porter's Five Forces Analysis |
  42. FIGURE 4 Global Market Size Trend, 2021–2035 (USD Billion) |
  43. FIGURE 5 Year-over-Year Growth Trajectory, 2022–2035 |
  44. FIGURE 6 Component Share Distribution, 2025 vs 2035 |
  45. FIGURE 7 Transaction Type Share Distribution, 2025 |
  46. FIGURE 8 Mode of Delivery Share Distribution, 2025 vs 2035 |
  47. FIGURE 9 End User Share Distribution, 2025 |
  48. FIGURE 10 Regional Share Distribution, 2025 |
  49. FIGURE 11 Regional CAGR Comparison, 2026–2035 |
  50. FIGURE 12 Country-Level Contribution, North America and Asia-Pacific |
  51. FIGURE 13 Competitive Landscape – Estimated Revenue Share Bands, 2026 |
  52. FIGURE 14 Vendor Positioning Matrix – Capability vs Scale

Segmentation Quick Reference

DimensionSub-SegmentsDominant SegmentFastest Growing Segment
By ComponentSoftware, Hardware, ServicesSoftwareServices
By Transaction TypeClaims Management (837/835), Eligibility & Benefit Verification (270/271), Payment & Remittance Advice, Prior Authorization (278), Supply Chain Transactions, Other TransactionsClaims Management (837/835)Prior Authorization (278)
By Mode of DeliveryWeb- and Cloud-Based EDI, EDI Value-Added Network, Point-to-Point / Direct EDI, Mobile EDIWeb- and Cloud-Based EDIMobile EDI
By End UserHealthcare Providers, Healthcare Payers, Pharmaceutical & Medical Device Firms, Other End UsersHealthcare ProvidersHealthcare Payers
By GeographyNorth America, Europe, Asia-Pacific, South America, Middle East & AfricaNorth AmericaAsia-Pacific


Market Segmentation Overview

By Component

Sub-SegmentKey Trend
SoftwareRules engines and companion-guide libraries becoming the primary switching cost
HardwareDeclining relevance as appliance-based translators retire
ServicesManaged operations and implementation demand tracking regulatory deadlines


Software retains the revenue centre while services absorb the compliance workload. Buyers increasingly separate the two contracts, licensing platform capability from one vendor and operational support from another to preserve negotiating leverage.

By Transaction Type

Sub-SegmentKey Trend
Claims Management (837/835)Volume-mature; competition shifting to first-pass acceptance rates
Eligibility & Benefit Verification (270/271)Real-time checks moving upstream into scheduling
Payment & Remittance AdviceConvergence with virtual card and ACH settlement rails
Prior Authorization (278)Regulatory mandate driving the steepest automation curve
Supply Chain TransactionsSerialization obligations extending messaging to dispensing sites
Other TransactionsEnrollment and referral flows gradually standardizing


Claims remain the volume backbone, but the strategic contest has moved to authorization and attachment workflows where manual handling still dominates and regulatory deadlines are firm.

By Mode of Delivery

Sub-SegmentKey Trend
Web- and Cloud-Based EDIConsumption pricing opening mid-market and small-practice segments
EDI Value-Added NetworkStable legacy communities with limited new logo growth
Point-to-Point / Direct EDIPreserved for highest-volume payer-provider pairs
Mobile EDIHome health, behavioural health, and emerging-market adoption


Delivery mode increasingly determines addressable customer size. Cloud economics have removed the historical floor on deal value, while mobile endpoints extend reach into care settings that never had a workstation.

By End User

Sub-SegmentKey Trend
Healthcare ProvidersPurchasing on measurable cash-flow and denial outcomes
Healthcare PayersRebuilding adjudication stacks for API compliance
Pharmaceutical & Medical Device FirmsTraceability and rebate processing integration
Other End UsersGovernment schemes and third-party administrators scaling adoption


Provider budgets fund the present, payer budgets shape the next five years. Vendors serving both sides gain visibility into the full transaction lifecycle, an advantage that increasingly translates into analytics revenue rather than throughput fees.




Download PDF ×

We do not share your information with anyone. However, we may send you emails based on your report interest from time to time. You may contact us at any time to opt-out.