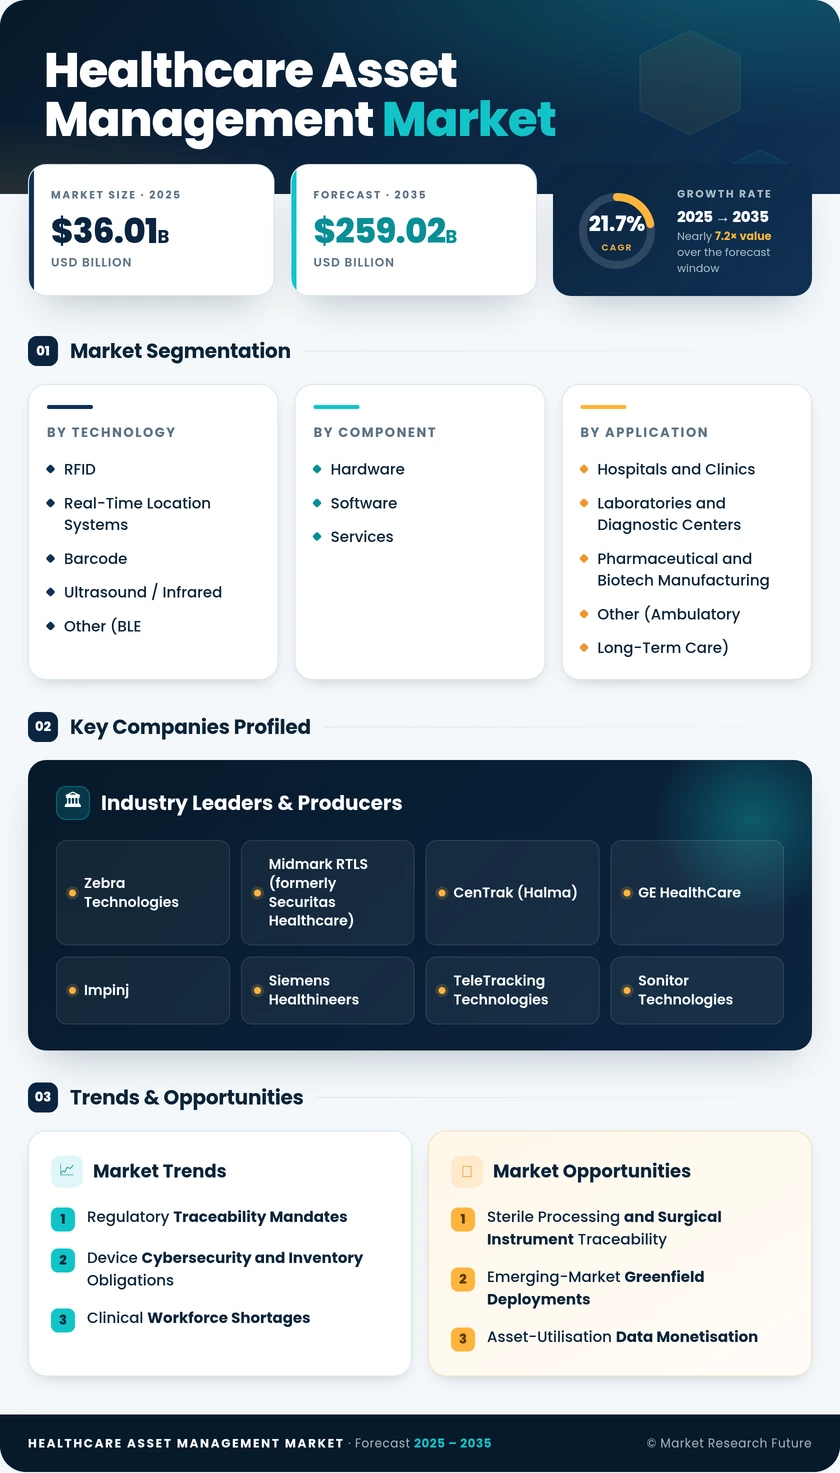
Healthcare Asset Management Market (2026 - 2035)

Healthcare Asset Management Market Research Report Information By Product (Radiofrequency Identification (RFID) Devices, and Others), By Application (Hospital Asset Management and Others), By End-User (Hospital, Laboratory, Pharmaceutical, and Others), And by Region (North America, Europe, Asia-Pacific, And Rest Of The World) โ€“Market Forecast Till 2035

Forecast Period
2026-2035
CAGR
21.7%
2025 Market Size
USD 36.01 Billion
2035 Market Size
USD 259.02 Billion
Healthcare Services โ— Updated August 24, 2026 Report ID: MRFR/HS/4874-HCR | Pages: 85 | Author: Rahul Gotadki, Nidhi Mandole
  1. 1 Market Summary |
    1. 1.1 Study Assumptions & Market Definition |
    2. 1.2 Scope of the Study |
    3. 1.3 Research Methodology
  2. 2 Key Report Takeaways |
    1. 2.1 By Technology |
    2. 2.2 By Sector |
    3. 2.3 By Geography
  3. 3 Market Size & Forecast (2021โ€“2035) |
    1. 3.1 Historical Market Size (2021โ€“2025) |
    2. 3.2 Current & Forecast Market Size (2026โ€“2035) |
    3. 3.3 Year-over-Year Growth Analysis
  4. 4 Driver Impact Analysis |
    1. 4.1 Regulatory Traceability Mandates |
    2. 4.2 Device Cybersecurity and Inventory Obligations |
    3. 4.3 Clinical Workforce Shortages |
    4. 4.4 Capital Equipment Utilisation Pressure
  5. 5 Restraints Impact Analysis |
    1. 5.1 Upfront Infrastructure Cost |
    2. 5.2 Integration Complexity |
    3. 5.3 Privacy Constraints on Staff Tracking
  6. 6 Opportunities |
    1. 6.1 Sterile Processing and Surgical Instrument Traceability |
    2. 6.2 Emerging-Market Greenfield Deployments |
    3. 6.3 Asset-Utilisation Data Monetisation |
    4. 6.4 Equipment-as-a-Service Financing |
    5. 6.5 Cold-Chain and Biologics Environmental Monitoring
  7. 7 Regional Market Share & Country-Level Analysis |
    1. 7.1 North America | |
      1. 7.1.1 US | |
      2. 7.1.2 Canada | |
      3. 7.1.3 Mexico |
    2. 7.2 Europe | |
      1. 7.2.1 Germany | |
      2. 7.2.2 UK | |
      3. 7.2.3 France | |
      4. 7.2.4 Italy | |
      5. 7.2.5 Spain | |
      6. 7.2.6 Nordic Countries | |
      7. 7.2.7 Russia | |
      8. 7.2.8 Rest of Europe |
    3. 7.3 Asia-Pacific | |
      1. 7.3.1 China | |
      2. 7.3.2 India | |
      3. 7.3.3 Japan | |
      4. 7.3.4 South Korea | |
      5. 7.3.5 ASEAN | |
      6. 7.3.6 Rest of Asia-Pacific |
    4. 7.4 South America | |
      1. 7.4.1 Brazil | |
      2. 7.4.2 Argentina | |
      3. 7.4.3 Rest of South America |
    5. 7.5 Middle East & Africa | |
      1. 7.5.1 Saudi Arabia | |
      2. 7.5.2 UAE | |
      3. 7.5.3 South Africa | |
      4. 7.5.4 Egypt | |
      5. 7.5.5 Rest of Middle East & Africa
  8. 8 Future Outlook (2026โ€“2035) |
    1. 8.1 AI-Driven Autonomous Operations |
    2. 8.2 Platform Economics and Consolidation |
    3. 8.3 Standards Convergence |
    4. 8.4 Sustainability and Circular Asset Reporting
  9. 9 Market Segmentation Analysis |
    1. 9.1 By Technology | |
      1. 9.1.1 RFID | |
      2. 9.1.2 Real-Time Location Systems | |
      3. 9.1.3 Barcode | |
      4. 9.1.4 Ultrasound / Infrared | |
      5. 9.1.5 Other (BLE, Wi-Fi, Ultra-Wideband) |
    2. 9.2 By Component | |
      1. 9.2.1 Hardware | |
      2. 9.2.2 Software | |
      3. 9.2.3 Services |
    3. 9.3 By Application | |
      1. 9.3.1 Equipment and Device Tracking | |
      2. 9.3.2 Inventory / Supply-Chain Management | |
      3. 9.3.3 Patient and Staff Tracking | |
      4. 9.3.4 Environmental Monitoring | |
      5. 9.3.5 Other Applications |
    4. 9.4 By End User | |
      1. 9.4.1 Hospitals and Clinics | |
      2. 9.4.2 Laboratories and Diagnostic Centers | |
      3. 9.4.3 Pharmaceutical and Biotech Manufacturing | |
      4. 9.4.4 Other (Ambulatory, Long-Term Care)
  10. 10 Competitive Landscape |
    1. 10.1 Market Concentration Analysis (2026) |
    2. 10.2 Competitive Benchmarking Matrix |
    3. 10.3 Company Profiles
  11. 11 Recent News & Developments
  12. 12 Report Scope & Methodology
  13. 13 Detailed Sources & Citations
  14. 14 Frequently Asked Questions
  15. 15 LIST OF TABLES |
  16. TABLE 1 Global Healthcare Asset Management Market Size & Forecast, by Revenue (USD Billion), 2021โ€“2035 |
  17. TABLE 2 Year-over-Year Growth Analysis, 2021โ€“2035 |
  18. TABLE 3 Driver Impact Analysis Matrix, 2026โ€“2035 |
  19. TABLE 4 Restraint Impact Analysis Matrix, 2026โ€“2035 |
  20. TABLE 5 Market Size by Region (USD Billion), 2021โ€“2035 |
  21. TABLE 6 North America Market Size, by Country (USD Billion), 2021โ€“2035 |
  22. TABLE 7 Europe Market Size, by Country (USD Billion), 2021โ€“2035 |
  23. TABLE 8 Asia-Pacific Market Size, by Country (USD Billion), 2021โ€“2035 |
  24. TABLE 9 South America Market Size, by Country (USD Billion), 2021โ€“2035 |
  25. TABLE 10 Middle East & Africa Market Size, by Country (USD Billion), 2021โ€“2035 |
  26. TABLE 11 Market Size, by Technology (USD Billion), 2021โ€“2035 |
  27. TABLE 12 Market Size, by Component (USD Billion), 2021โ€“2035 |
  28. TABLE 13 Market Size, by Application (USD Billion), 2021โ€“2035 |
  29. TABLE 14 Market Size, by End User (USD Billion), 2021โ€“2035 |
  30. TABLE 15 Regional Market Size, by Technology (USD Billion), 2021โ€“2035 |
  31. TABLE 16 Regional Market Size, by Component (USD Billion), 2021โ€“2035 |
  32. TABLE 17 Regional Market Size, by Application (USD Billion), 2021โ€“2035 |
  33. TABLE 18 Regional Market Size, by End User (USD Billion), 2021โ€“2035 |
  34. TABLE 19 Competitive Benchmarking Matrix, 2026 |
  35. TABLE 20 Company Profiles โ€” Key Players |
  36. TABLE 21 Recent Developments & Strategic Announcements, 2023โ€“2025 |
  37. TABLE 22 Report Scope & Methodology Summary |
  38. TABLE 23 Detailed Sources & Citations Index
  39. 16 LIST OF FIGURES |
  40. FIGURE 1 Market Dynamics โ€” Drivers, Restraints, Opportunities Overview |
  41. FIGURE 2 Industry Value Chain Analysis |
  42. FIGURE 3 Porter's Five Forces Analysis |
  43. FIGURE 4 Market Size Trend Line (USD Billion), 2021โ€“2035 |
  44. FIGURE 5 Year-over-Year Growth Curve, 2022โ€“2035 |
  45. FIGURE 6 Market Share by Technology, 2025 vs 2035 |
  46. FIGURE 7 Market Share by Component, 2025 vs 2035 |
  47. FIGURE 8 Market Share by Application, 2025 vs 2035 |
  48. FIGURE 9 Market Share by End User, 2025 vs 2035 |
  49. FIGURE 10 Regional Revenue Share Distribution, 2025 |
  50. FIGURE 11 Regional CAGR Comparison, 2026โ€“2035 |
  51. FIGURE 12 Country-Level Growth Heatmap |
  52. FIGURE 13 Competitive Landscape Positioning Quadrant, 2026 |
  53. FIGURE 14 Top-Five Vendor Share Evolution, 2021โ€“2035 |
  54. FIGURE 15 Driver Impact Contribution Chart

Segmentation Quick Reference

DimensionSub-SegmentsDominant SegmentFastest Growing Segment
By TechnologyRFID; Real-Time Location Systems; Barcode; Ultrasound / Infrared; Other (BLE, Wi-Fi, Ultra-Wideband)RFIDReal-Time Location Systems
By ComponentHardware; Software; ServicesHardwareServices
By ApplicationEquipment and Device Tracking; Inventory / Supply-Chain Management; Patient and Staff Tracking; Environmental Monitoring; Other ApplicationsEquipment and Device TrackingPatient and Staff Tracking
By End UserHospitals and Clinics; Laboratories and Diagnostic Centers; Pharmaceutical and Biotech Manufacturing; Other (Ambulatory, Long-Term Care)Hospitals and ClinicsPharmaceutical and Biotech Manufacturing
By GeographyNorth America; Europe; Asia-Pacific; South America; Middle East & AfricaNorth AmericaAsia-Pacific

ย 

Market Segmentation Overview

By Technology

Sub-SegmentKey Trend
RFIDPassive tag economics sustain leadership in high-volume item coverage
Real-Time Location SystemsClinical workflow use cases justify premium accuracy investment
BarcodeRetained for UDI compliance and low-cost consumable identification
Ultrasound / InfraredPreferred where room-level certainty must be guaranteed
Other (BLE, Wi-Fi, Ultra-Wideband)Infrastructure reuse lowers deployment barriers in retrofits

ย 

Technology selection is converging on hybrid estates rather than single-protocol standardisation. Providers deploy inexpensive identification broadly and reserve high-accuracy positioning for the handful of workflows where seconds and metres change clinical outcomes.

By Component

Sub-SegmentKey Trend
HardwareFalling unit costs compress share despite rising volumes
SoftwareAnalytics and workflow orchestration drive licence expansion
ServicesManaged deployment and integration become the growth engine

ย 

Revenue mix is rotating toward recurring streams. Vendors that once sold readers now sell outcomes, and the services layer captures the expertise gap that providers no longer attempt to staff internally.

By Application

Sub-SegmentKey Trend
Equipment and Device TrackingRental avoidance remains the clearest quantified return
Inventory / Supply-Chain ManagementExpiry and recall execution drive expansion beyond stockrooms
Patient and Staff TrackingThroughput and safety mandates accelerate adoption
Environmental MonitoringBiologics and cell therapy logistics extend sensor scope
Other ApplicationsWaste, linen, and bed management fill remaining white space

ย 

Application breadth grows as platforms prove their first use case. Equipment tracking typically funds the infrastructure, after which incremental modules face a far lower approval hurdle.

By End User

Sub-SegmentKey Trend
Hospitals and ClinicsAccreditation pressure and capital efficiency sustain dominance
Laboratories and Diagnostic CentersSample chain-of-custody requirements drive steady uptake
Pharmaceutical and Biotech ManufacturingGMP serialisation extends tracking into production equipment
Other (Ambulatory, Long-Term Care)Distributed fleets create demand for lightweight cloud tools

ย 

End-user expansion follows regulatory reach. Wherever an auditor asks for a chain of custody, an asset platform eventually appears.

By Geography

Sub-SegmentKey Trend
North AmericaCybersecurity register obligations dominate purchase rationale
EuropeMDR and UDI enforcement set a compliance floor
Asia-PacificGreenfield construction enables design-stage specification
South AmericaPrivate hospital groups lead ahead of public funding cycles
Middle East & AfricaFlagship national projects concentrate demand

ย 

Geographic momentum tracks enforcement intensity more than health spending. Markets with active traceability audits convert interest into contracts roughly two budget cycles faster than those without.


ย 

ย 

ย 

ย 

ย 

ย 

ย 

ย 

ย 

ย 

Download PDF ×

We do not share your information with anyone. However, we may send you emails based on your report interest from time to time. You may contact us at any time to opt-out.