×
  • Cat-intel
  • MedIntelliX
  • Resources
  • About Us
  • Hero Background
    English
    Chinese
    French
    Japanese
    Korean
    German
    Spanish

    HbA1c Testing Market Analysis

    ID: MRFR/HC/7045-CR
    134 Pages
    Kinjoll Dey
    October 2019

    HbA1c Testing  Market Research Report Information by Product (Instruments (Bench-Top Device and Handheld Device) and Reagents and Kits), By Technology (Ion-Exchange High-Performance Liquid Chromatography (HPLC), Turbidimetric Inhibition Immunoassay (TINIA), Enzymatic Assay and Others), By End User (Hospitals and Clinics, Diagnostic Laboratories and Others) and by Region (Americas, Europe, ...

    Share:
    Download PDF ×

    We do not share your information with anyone. However, we may send you emails based on your report interest from time to time. You may contact us at any time to opt-out.

    HbA1c Testing Market Infographic
    Purchase Options

    Market Analysis

    In-depth Analysis of HbA1c Testing Market Industry Landscape

    The global HbA1c market is characterized by the active participation of well-established players. These companies consistently engage in various strategic activities like research and development, mergers, acquisitions, and joint ventures to solidify their position in the market. An illustrative example of this trend is evident in the actions of EKF Diagnostics in April 2019. The company entered into a private label distribution agreement with McKesson Medical-Surgical Inc. for its hemoglobin analyzer, the DiaSpect Tm. This collaboration with McKesson, a key player that serves more than 50% of hospitals and 20% of physicians in the United States, showcases a deliberate effort by leading companies to expand their reach and influence in the market. By aligning with such influential distribution partners, companies aim to tap into a broader customer base and enhance their market presence.

    The significance of such strategic moves becomes apparent when considering their potential impact on increasing the demand for diagnostic tools in different countries. In the case of EKF Diagnostics, partnering with McKesson serves as a strategic maneuver to leverage the vast network and extensive reach of McKesson in the healthcare industry. This strategic alliance is anticipated to result in an increased adoption of the DiaSpect Tm hemoglobin analyzer in hospitals and among physicians, consequently contributing to the overall growth of the HbA1c market. The emphasis on research and development, mergers, acquisitions, and partnerships underscores the competitive nature of the HbA1c market. Companies recognize the need to continually innovate and collaborate to stay ahead in the dynamic landscape of diagnostic technologies. These strategic initiatives not only benefit the companies involved but also play a pivotal role in advancing healthcare outcomes by ensuring the availability and accessibility of advanced diagnostic tools.

    Author
    Kinjoll Dey
    Research Analyst Level I

    He is an extremely curious individual currently working in Healthcare and Medical Devices Domain. Kinjoll is comfortably versed in data centric research backed by healthcare educational background. He leverages extensive data mining and analytics tools such as Primary and Secondary Research, Statistical Analysis, Machine Learning, Data Modelling. His key role also involves Technical Sales Support, Client Interaction and Project management within the Healthcare team. Lastly, he showcases extensive affinity towards learning new skills and remain fascinated in implementing them.

    Leave a Comment

    FAQs

    At what CAGR is the HbA1c Testing Market projected to grow during the forecast period?

    HbA1c Testing Market is projected to grow at a 13.12% CAGR between 2024-2032.

    Which region is expected to dominate the HbA1c Testing Market?

    The Americas is expected to dominate the HbA1c Testing Market.

    What will be the value of the HbA1c Testing Market during the forecast period?

    HbA1c Testing Market is predicted to touch USD 4.56 Billion by 2032.

    Which end user segment will lead the HbA1c Testing Market?

    The hospitals and clinics segment will lead the HbA1c Testing Market.

    Which product segment will dominate the HbA1c Testing Market?

    The reagents & kits segment will dominate the HbA1c Testing Market.

    Market Summary

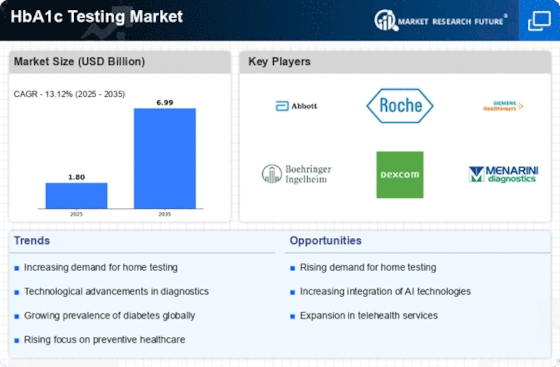
    As per MRFR analysis, the HbA1c Testing Market Size was estimated at 1.8 USD Billion in 2024. The HbA1c Testing industry is projected to grow from 2.036 in 2025 to 6.986 by 2035, exhibiting a compound annual growth rate (CAGR) of 13.12 during the forecast period 2025 - 2035.

    Key Market Trends & Highlights

    The HbA1c Testing Market is poised for substantial growth driven by technological advancements and increasing awareness.

    • North America remains the largest market for HbA1c testing, reflecting a robust healthcare infrastructure and high diabetes prevalence. The Asia-Pacific region is emerging as the fastest-growing market, fueled by rising healthcare investments and increasing diabetes cases. Ion-exchange HPLC continues to dominate the market, while the TINIA segment is experiencing rapid growth due to its innovative approach. Key market drivers include the rising prevalence of diabetes and regulatory support for diabetes management, which are shaping market dynamics.

    Market Size & Forecast

    2024 Market Size 1.8 (USD Billion)
    2035 Market Size 6.986 (USD Billion)
    CAGR (2025 - 2035) 13.12%
    Largest Regional Market Share in 2024 America

    Major Players

    <p>Abbott Laboratories (US), Roche Diagnostics (CH), Siemens Healthineers (DE), Boehringer Ingelheim (DE), Dexcom (US), A. Menarini Diagnostics (IT), Trinity Biotech (IE), HemoCue (SE), Arkray (JP)</p>

    Market Trends

    The HbA1c Testing Market is currently experiencing notable growth, driven by an increasing prevalence of diabetes worldwide. This rise in diabetes cases has led to a heightened demand for effective monitoring solutions, as healthcare providers and patients alike seek reliable methods to manage blood glucose levels. Furthermore, advancements in technology are facilitating the development of more accurate and user-friendly testing devices, which may enhance patient compliance and improve health outcomes. As awareness of diabetes management continues to expand, the HbA1c Testing Market is likely to evolve, incorporating innovative solutions that cater to diverse patient needs. In addition to technological advancements, regulatory support is playing a crucial role in shaping the HbA1c Testing Market. Governments and health organizations are increasingly recognizing the importance of regular monitoring for diabetes management, which could lead to favorable policies and funding for testing initiatives. This supportive environment may encourage further research and development, ultimately resulting in a wider array of testing options. As the market progresses, stakeholders must remain vigilant to emerging trends and adapt their strategies accordingly to capitalize on the evolving landscape of diabetes care.

    Technological Advancements

    The HbA1c Testing Market is witnessing a surge in technological innovations, with new devices and methodologies emerging to enhance testing accuracy and convenience. These advancements may lead to more efficient monitoring solutions, potentially improving patient adherence to testing protocols.

    Increased Awareness and Education

    There is a growing emphasis on diabetes education and awareness, which appears to be driving demand for HbA1c testing. As patients become more informed about the importance of regular monitoring, healthcare providers are likely to see an uptick in testing requests.

    Regulatory Support and Initiatives

    Government initiatives aimed at improving diabetes care are influencing the HbA1c Testing Market. Enhanced regulatory frameworks may promote the adoption of testing technologies, thereby facilitating better access to essential monitoring tools for patients.

    HbA1c Testing Market Market Drivers

    Increasing Health Expenditure

    Rising health expenditure across various regions is contributing to the expansion of the HbA1c Testing Market. As healthcare budgets increase, there is a greater allocation of resources towards diabetes management and prevention programs. This financial commitment enables healthcare facilities to invest in advanced testing technologies and improve access to HbA1c testing for patients. Furthermore, higher health expenditure often correlates with increased public awareness campaigns about diabetes, further driving demand for regular testing. As countries continue to prioritize healthcare spending, the HbA1c Testing Market is expected to benefit from enhanced accessibility and improved testing capabilities.

    Rising Prevalence of Diabetes

    The increasing incidence of diabetes worldwide is a primary driver for the HbA1c Testing Market. According to recent estimates, approximately 463 million adults are living with diabetes, a figure projected to rise significantly in the coming years. This surge in diabetes cases necessitates regular monitoring of blood glucose levels, making HbA1c testing essential for effective disease management. The HbA1c test provides a comprehensive view of average blood glucose levels over the past two to three months, thus aiding healthcare providers in making informed treatment decisions. As the population ages and lifestyle-related factors contribute to higher diabetes rates, the demand for HbA1c testing is expected to grow, further propelling the HbA1c Testing Market.

    Technological Innovations in Testing

    Technological advancements in HbA1c testing methodologies are transforming the HbA1c Testing Market. Innovations such as point-of-care testing devices and automated laboratory analyzers enhance the accuracy and efficiency of HbA1c measurements. These advancements not only reduce the time required for test results but also improve patient compliance by facilitating easier access to testing. The introduction of portable devices allows for testing in various settings, including home care, which is particularly appealing to patients managing diabetes. As technology continues to evolve, the HbA1c Testing Market is likely to witness increased adoption of these innovative solutions, thereby expanding its reach and improving patient outcomes.

    Growing Focus on Preventive Healthcare

    The shift towards preventive healthcare is significantly influencing the HbA1c Testing Market. Healthcare systems are increasingly emphasizing early detection and management of diabetes to mitigate complications associated with the disease. Regular HbA1c testing plays a crucial role in this preventive approach, enabling healthcare providers to identify at-risk individuals and implement timely interventions. This trend is supported by various health initiatives aimed at promoting awareness about diabetes and its management. As more individuals recognize the importance of regular monitoring, the demand for HbA1c testing is expected to rise, thereby driving growth in the HbA1c Testing Market.

    Regulatory Support for Diabetes Management

    Regulatory bodies are increasingly supporting initiatives aimed at improving diabetes management, which positively impacts the HbA1c Testing Market. Policies that promote regular screening and monitoring of diabetes patients are being implemented in various regions. For instance, guidelines recommending HbA1c testing at least twice a year for patients with diabetes are becoming standard practice. This regulatory support not only encourages healthcare providers to adopt HbA1c testing but also raises awareness among patients about the importance of monitoring their blood glucose levels. As these regulations become more widespread, the HbA1c Testing Market is likely to experience sustained growth.

    Market Segment Insights

    By Technology: Ion-exchange HPLC (Largest) vs. TINIA (Fastest-Growing)

    <p>In the HbA1c Testing Market, the Ion-exchange HPLC segment holds the largest market share, characterized by its robust reliability and accuracy in measuring HbA1c levels. Following closely is the <a href="https://www.marketresearchfuture.com/reports/tinea-corporis-market-6838">TINIA</a> technology, which has quickly gained traction due to its rapid testing capabilities and ease of use. Both of these technologies play significant roles in clinical settings, ensuring patients receive timely and accurate diagnoses. As the market evolves, understanding the dynamics between these technologies will be crucial for stakeholders.</p>

    <p>Technology: Ion-exchange HPLC (Dominant) vs. TINIA (Emerging)</p>

    <p>Ion-exchange HPLC represents the dominant technology in the HbA1c Testing Market. Its established reputation for precision makes it the preferred choice in many laboratories. In contrast, TINIA is an emerging technology, gaining momentum for its feature of providing results in a significantly shorter time-frame. This rapid turnaround is advantageous in primary care and point-of-care testing, where timely insights are critical for patient management. The adaptability of TINIA to various clinical environments signifies its potential to challenge traditional methods and reshape testing practices, expanding access to HbA1c testing.</p>

    By Product: Reagents & kits (Largest) vs. Instruments (Fastest-Growing)

    <p>In the HbA1c Testing Market, the market share distribution among product segments reveals that reagents and kits constitute the largest portion, catering to the ongoing demand for accurate HbA1c testing in various healthcare settings. This segment's dominance is fueled by the increasing prevalence of diabetes and the requisite for frequent monitoring, ensuring a steady demand for these vital tools. In contrast, instruments emerge as a rapidly growing segment, reflecting a shift in preference towards automated and advanced diagnostic technologies. The growing interest in point-of-care testing and enhanced laboratory efficiency is further contributing to the rising market presence of instruments.</p>

    <p>Reagents &amp; kits (Dominant) vs. Instruments (Emerging)</p>

    <p>Reagents and kits play a pivotal role in the HbA1c Testing Market, as they are essential for conducting reliable tests that help monitor diabetes management. These products are characterized by their diverse formats, including liquid reagents and ready-to-use kits, making them suitable for various testing scenarios. Their dominant market position is enhanced by continual innovations in formulation and efficiency. On the other hand, instruments are gaining traction as the fastest-growing segment, driven by technological advancements that enable quicker and more precise test results. The trend toward automation and integration within laboratory settings positions instruments as not merely adjuncts but as key players in enhancing testing workflows, ensuring quality control, and minimizing human error.</p>

    By End-user: Hospitals & Clinics (Largest) vs. Diagnostic Laboratories (Fastest-Growing)

    <p>In the HbA1c testing market, hospitals and clinics dominate the end-user segment, representing a significant portion of overall testing demands. Their established infrastructure, coupled with comprehensive patient care services, positions them as key players in HbA1c testing, catering primarily to diabetic patient management. Conversely, diagnostic laboratories are swiftly gaining traction, with an increased focus on specialized testing and accurate results leading to their rapid expansion in market presence.</p>

    <p>Hospitals &amp; Clinics (Dominant) vs. Diagnostic Laboratories (Emerging)</p>

    <p>Hospitals and clinics are the primary end-users in the HbA1c testing market, driven by their extensive resources and capabilities to manage chronic conditions like diabetes through regular monitoring. These establishments benefit from higher patient footfall and established trust within communities. On the other hand, diagnostic laboratories are emerging as a significant segment thanks to advancements in testing technologies and a growing preference for third-party testing. Their ability to provide faster turnaround times and specialized services makes them an attractive option in today’s market, catering to both hospitals and individual patients seeking precision in their diabetes management efforts.</p>

    Get more detailed insights about HbA1c Testing Market Research Report - Forecast till 2035

    Regional Insights

    Key Companies in the HbA1c Testing Market market include

    Industry Developments

    February 2023:Bio-Rad Laboratories, Inc. (US) launched the D-100 Hemoglobin A1c assay, a high-performance liquid chromatography (HPLC) method offering accurate and precise HbA1c measurement on their D-Series analyzers. 

    August 2022:Transasia Bio-Medicals (India) received approval from the Indian Council of Medical Research (ICMR) for their HbA1c self-testing kit, marking a significant step towards increased accessibility in India.

    October 2023:Abbott Laboratories (US) received FDA clearance for the FreeStyle Libre 3 system, a continuous glucose monitoring (CGM) device offering 14-day wear and improved accuracy. While not directly an HbA1c test, CGM data can be used to estimate HbA1c levels.

    Future Outlook

    HbA1c Testing Market Future Outlook

    <p>The HbA1c Testing Market is projected to grow at a 13.12% CAGR from 2024 to 2035, driven by technological advancements, increasing diabetes prevalence, and rising awareness.</p>

    New opportunities lie in:

    • <p>Development of portable HbA1c testing devices for home use.</p><p>Integration of AI-driven analytics for personalized diabetes management.</p><p>Expansion of telehealth services for remote HbA1c monitoring.</p>

    <p>By 2035, the HbA1c Testing Market is expected to be robust, reflecting substantial growth and innovation.</p>

    Market Segmentation

    HbA1c Testing Market Product Outlook

    • Reagents & kits
    • Instruments

    HbA1c Testing Market End-user Outlook

    • Hospitals & clinics
    • Diagnostic laboratories
    • Others

    HbA1c Testing Market Technology Outlook

    • Ion-exchange HPLC
    • TINIA
    • Enzymatic assay
    • Others

    Report Scope

    MARKET SIZE 20241.8(USD Billion)
    MARKET SIZE 20252.036(USD Billion)
    MARKET SIZE 20356.986(USD Billion)
    COMPOUND ANNUAL GROWTH RATE (CAGR)13.12% (2024 - 2035)
    REPORT COVERAGERevenue Forecast, Competitive Landscape, Growth Factors, and Trends
    BASE YEAR2024
    Market Forecast Period2025 - 2035
    Historical Data2019 - 2024
    Market Forecast UnitsUSD Billion
    Key Companies ProfiledMarket analysis in progress
    Segments CoveredMarket segmentation analysis in progress
    Key Market OpportunitiesIntegration of digital health technologies enhances patient engagement in the HbA1c Testing Market.
    Key Market DynamicsRising demand for point-of-care HbA1c testing drives innovation and competition among diagnostic manufacturers.
    Countries CoveredNorth America, Europe, APAC, South America, MEA

    FAQs

    At what CAGR is the HbA1c Testing Market projected to grow during the forecast period?

    HbA1c Testing Market is projected to grow at a 13.12% CAGR between 2024-2032.

    Which region is expected to dominate the HbA1c Testing Market?

    The Americas is expected to dominate the HbA1c Testing Market.

    What will be the value of the HbA1c Testing Market during the forecast period?

    HbA1c Testing Market is predicted to touch USD 4.56 Billion by 2032.

    Which end user segment will lead the HbA1c Testing Market?

    The hospitals and clinics segment will lead the HbA1c Testing Market.

    Which product segment will dominate the HbA1c Testing Market?

    The reagents &amp; kits segment will dominate the HbA1c Testing Market.

    1. SECTION I: EXECUTIVE SUMMARY AND KEY HIGHLIGHTS
      1. | 1.1 EXECUTIVE SUMMARY
      2. | | 1.1.1 Market Overview
      3. | | 1.1.2 Key Findings
      4. | | 1.1.3 Market Segmentation
      5. | | 1.1.4 Competitive Landscape
      6. | | 1.1.5 Challenges and Opportunities
      7. | | 1.1.6 Future Outlook
    2. SECTION II: SCOPING, METHODOLOGY AND MARKET STRUCTURE
      1. | 2.1 MARKET INTRODUCTION
      2. | | 2.1.1 Definition
      3. | | 2.1.2 Scope of the study
      4. | | | 2.1.2.1 Research Objective
      5. | | | 2.1.2.2 Assumption
      6. | | | 2.1.2.3 Limitations
      7. | 2.2 RESEARCH METHODOLOGY
      8. | | 2.2.1 Overview
      9. | | 2.2.2 Data Mining
      10. | | 2.2.3 Secondary Research
      11. | | 2.2.4 Primary Research
      12. | | | 2.2.4.1 Primary Interviews and Information Gathering Process
      13. | | | 2.2.4.2 Breakdown of Primary Respondents
      14. | | 2.2.5 Forecasting Model
      15. | | 2.2.6 Market Size Estimation
      16. | | | 2.2.6.1 Bottom-Up Approach
      17. | | | 2.2.6.2 Top-Down Approach
      18. | | 2.2.7 Data Triangulation
      19. | | 2.2.8 Validation
    3. SECTION III: QUALITATIVE ANALYSIS
      1. | 3.1 MARKET DYNAMICS
      2. | | 3.1.1 Overview
      3. | | 3.1.2 Drivers
      4. | | 3.1.3 Restraints
      5. | | 3.1.4 Opportunities
      6. | 3.2 MARKET FACTOR ANALYSIS
      7. | | 3.2.1 Value chain Analysis
      8. | | 3.2.2 Porter's Five Forces Analysis
      9. | | | 3.2.2.1 Bargaining Power of Suppliers
      10. | | | 3.2.2.2 Bargaining Power of Buyers
      11. | | | 3.2.2.3 Threat of New Entrants
      12. | | | 3.2.2.4 Threat of Substitutes
      13. | | | 3.2.2.5 Intensity of Rivalry
      14. | | 3.2.3 COVID-19 Impact Analysis
      15. | | | 3.2.3.1 Market Impact Analysis
      16. | | | 3.2.3.2 Regional Impact
      17. | | | 3.2.3.3 Opportunity and Threat Analysis
    4. SECTION IV: QUANTITATIVE ANALYSIS
      1. | 4.1 Healthcare, BY Technology (USD Billion)
      2. | | 4.1.1 Ion-exchange HPLC
      3. | | 4.1.2 TINIA
      4. | | 4.1.3 Enzymatic assay
      5. | | 4.1.4 Others
      6. | 4.2 Healthcare, BY Product (USD Billion)
      7. | | 4.2.1 Reagents & kits
      8. | | 4.2.2 Instruments
      9. | 4.3 Healthcare, BY End-user (USD Billion)
      10. | | 4.3.1 Hospitals & clinics
      11. | | 4.3.2 Diagnostic laboratories
      12. | | 4.3.3 Others
      13. | 4.4 Healthcare, BY Region (USD Billion)
      14. | | 4.4.1 North America
      15. | | | 4.4.1.1 US
      16. | | | 4.4.1.2 Canada
      17. | | 4.4.2 Europe
      18. | | | 4.4.2.1 Germany
      19. | | | 4.4.2.2 UK
      20. | | | 4.4.2.3 France
      21. | | | 4.4.2.4 Russia
      22. | | | 4.4.2.5 Italy
      23. | | | 4.4.2.6 Spain
      24. | | | 4.4.2.7 Rest of Europe
      25. | | 4.4.3 APAC
      26. | | | 4.4.3.1 China
      27. | | | 4.4.3.2 India
      28. | | | 4.4.3.3 Japan
      29. | | | 4.4.3.4 South Korea
      30. | | | 4.4.3.5 Malaysia
      31. | | | 4.4.3.6 Thailand
      32. | | | 4.4.3.7 Indonesia
      33. | | | 4.4.3.8 Rest of APAC
      34. | | 4.4.4 South America
      35. | | | 4.4.4.1 Brazil
      36. | | | 4.4.4.2 Mexico
      37. | | | 4.4.4.3 Argentina
      38. | | | 4.4.4.4 Rest of South America
      39. | | 4.4.5 MEA
      40. | | | 4.4.5.1 GCC Countries
      41. | | | 4.4.5.2 South Africa
      42. | | | 4.4.5.3 Rest of MEA
    5. SECTION V: COMPETITIVE ANALYSIS
      1. | 5.1 Competitive Landscape
      2. | | 5.1.1 Overview
      3. | | 5.1.2 Competitive Analysis
      4. | | 5.1.3 Market share Analysis
      5. | | 5.1.4 Major Growth Strategy in the Healthcare
      6. | | 5.1.5 Competitive Benchmarking
      7. | | 5.1.6 Leading Players in Terms of Number of Developments in the Healthcare
      8. | | 5.1.7 Key developments and growth strategies
      9. | | | 5.1.7.1 New Product Launch/Service Deployment
      10. | | | 5.1.7.2 Merger & Acquisitions
      11. | | | 5.1.7.3 Joint Ventures
      12. | | 5.1.8 Major Players Financial Matrix
      13. | | | 5.1.8.1 Sales and Operating Income
      14. | | | 5.1.8.2 Major Players R&D Expenditure. 2023
      15. | 5.2 Company Profiles
      16. | | 5.2.1 Abbott Laboratories (US)
      17. | | | 5.2.1.1 Financial Overview
      18. | | | 5.2.1.2 Products Offered
      19. | | | 5.2.1.3 Key Developments
      20. | | | 5.2.1.4 SWOT Analysis
      21. | | | 5.2.1.5 Key Strategies
      22. | | 5.2.2 Roche Diagnostics (CH)
      23. | | | 5.2.2.1 Financial Overview
      24. | | | 5.2.2.2 Products Offered
      25. | | | 5.2.2.3 Key Developments
      26. | | | 5.2.2.4 SWOT Analysis
      27. | | | 5.2.2.5 Key Strategies
      28. | | 5.2.3 Siemens Healthineers (DE)
      29. | | | 5.2.3.1 Financial Overview
      30. | | | 5.2.3.2 Products Offered
      31. | | | 5.2.3.3 Key Developments
      32. | | | 5.2.3.4 SWOT Analysis
      33. | | | 5.2.3.5 Key Strategies
      34. | | 5.2.4 Boehringer Ingelheim (DE)
      35. | | | 5.2.4.1 Financial Overview
      36. | | | 5.2.4.2 Products Offered
      37. | | | 5.2.4.3 Key Developments
      38. | | | 5.2.4.4 SWOT Analysis
      39. | | | 5.2.4.5 Key Strategies
      40. | | 5.2.5 Dexcom (US)
      41. | | | 5.2.5.1 Financial Overview
      42. | | | 5.2.5.2 Products Offered
      43. | | | 5.2.5.3 Key Developments
      44. | | | 5.2.5.4 SWOT Analysis
      45. | | | 5.2.5.5 Key Strategies
      46. | | 5.2.6 A. Menarini Diagnostics (IT)
      47. | | | 5.2.6.1 Financial Overview
      48. | | | 5.2.6.2 Products Offered
      49. | | | 5.2.6.3 Key Developments
      50. | | | 5.2.6.4 SWOT Analysis
      51. | | | 5.2.6.5 Key Strategies
      52. | | 5.2.7 Trinity Biotech (IE)
      53. | | | 5.2.7.1 Financial Overview
      54. | | | 5.2.7.2 Products Offered
      55. | | | 5.2.7.3 Key Developments
      56. | | | 5.2.7.4 SWOT Analysis
      57. | | | 5.2.7.5 Key Strategies
      58. | | 5.2.8 HemoCue (SE)
      59. | | | 5.2.8.1 Financial Overview
      60. | | | 5.2.8.2 Products Offered
      61. | | | 5.2.8.3 Key Developments
      62. | | | 5.2.8.4 SWOT Analysis
      63. | | | 5.2.8.5 Key Strategies
      64. | | 5.2.9 Arkray (JP)
      65. | | | 5.2.9.1 Financial Overview
      66. | | | 5.2.9.2 Products Offered
      67. | | | 5.2.9.3 Key Developments
      68. | | | 5.2.9.4 SWOT Analysis
      69. | | | 5.2.9.5 Key Strategies
      70. | 5.3 Appendix
      71. | | 5.3.1 References
      72. | | 5.3.2 Related Reports
    6. LIST OF FIGURES
      1. | 6.1 MARKET SYNOPSIS
      2. | 6.2 NORTH AMERICA MARKET ANALYSIS
      3. | 6.3 US MARKET ANALYSIS BY TECHNOLOGY
      4. | 6.4 US MARKET ANALYSIS BY PRODUCT
      5. | 6.5 US MARKET ANALYSIS BY END-USER
      6. | 6.6 CANADA MARKET ANALYSIS BY TECHNOLOGY
      7. | 6.7 CANADA MARKET ANALYSIS BY PRODUCT
      8. | 6.8 CANADA MARKET ANALYSIS BY END-USER
      9. | 6.9 EUROPE MARKET ANALYSIS
      10. | 6.10 GERMANY MARKET ANALYSIS BY TECHNOLOGY
      11. | 6.11 GERMANY MARKET ANALYSIS BY PRODUCT
      12. | 6.12 GERMANY MARKET ANALYSIS BY END-USER
      13. | 6.13 UK MARKET ANALYSIS BY TECHNOLOGY
      14. | 6.14 UK MARKET ANALYSIS BY PRODUCT
      15. | 6.15 UK MARKET ANALYSIS BY END-USER
      16. | 6.16 FRANCE MARKET ANALYSIS BY TECHNOLOGY
      17. | 6.17 FRANCE MARKET ANALYSIS BY PRODUCT
      18. | 6.18 FRANCE MARKET ANALYSIS BY END-USER
      19. | 6.19 RUSSIA MARKET ANALYSIS BY TECHNOLOGY
      20. | 6.20 RUSSIA MARKET ANALYSIS BY PRODUCT
      21. | 6.21 RUSSIA MARKET ANALYSIS BY END-USER
      22. | 6.22 ITALY MARKET ANALYSIS BY TECHNOLOGY
      23. | 6.23 ITALY MARKET ANALYSIS BY PRODUCT
      24. | 6.24 ITALY MARKET ANALYSIS BY END-USER
      25. | 6.25 SPAIN MARKET ANALYSIS BY TECHNOLOGY
      26. | 6.26 SPAIN MARKET ANALYSIS BY PRODUCT
      27. | 6.27 SPAIN MARKET ANALYSIS BY END-USER
      28. | 6.28 REST OF EUROPE MARKET ANALYSIS BY TECHNOLOGY
      29. | 6.29 REST OF EUROPE MARKET ANALYSIS BY PRODUCT
      30. | 6.30 REST OF EUROPE MARKET ANALYSIS BY END-USER
      31. | 6.31 APAC MARKET ANALYSIS
      32. | 6.32 CHINA MARKET ANALYSIS BY TECHNOLOGY
      33. | 6.33 CHINA MARKET ANALYSIS BY PRODUCT
      34. | 6.34 CHINA MARKET ANALYSIS BY END-USER
      35. | 6.35 INDIA MARKET ANALYSIS BY TECHNOLOGY
      36. | 6.36 INDIA MARKET ANALYSIS BY PRODUCT
      37. | 6.37 INDIA MARKET ANALYSIS BY END-USER
      38. | 6.38 JAPAN MARKET ANALYSIS BY TECHNOLOGY
      39. | 6.39 JAPAN MARKET ANALYSIS BY PRODUCT
      40. | 6.40 JAPAN MARKET ANALYSIS BY END-USER
      41. | 6.41 SOUTH KOREA MARKET ANALYSIS BY TECHNOLOGY
      42. | 6.42 SOUTH KOREA MARKET ANALYSIS BY PRODUCT
      43. | 6.43 SOUTH KOREA MARKET ANALYSIS BY END-USER
      44. | 6.44 MALAYSIA MARKET ANALYSIS BY TECHNOLOGY
      45. | 6.45 MALAYSIA MARKET ANALYSIS BY PRODUCT
      46. | 6.46 MALAYSIA MARKET ANALYSIS BY END-USER
      47. | 6.47 THAILAND MARKET ANALYSIS BY TECHNOLOGY
      48. | 6.48 THAILAND MARKET ANALYSIS BY PRODUCT
      49. | 6.49 THAILAND MARKET ANALYSIS BY END-USER
      50. | 6.50 INDONESIA MARKET ANALYSIS BY TECHNOLOGY
      51. | 6.51 INDONESIA MARKET ANALYSIS BY PRODUCT
      52. | 6.52 INDONESIA MARKET ANALYSIS BY END-USER
      53. | 6.53 REST OF APAC MARKET ANALYSIS BY TECHNOLOGY
      54. | 6.54 REST OF APAC MARKET ANALYSIS BY PRODUCT
      55. | 6.55 REST OF APAC MARKET ANALYSIS BY END-USER
      56. | 6.56 SOUTH AMERICA MARKET ANALYSIS
      57. | 6.57 BRAZIL MARKET ANALYSIS BY TECHNOLOGY
      58. | 6.58 BRAZIL MARKET ANALYSIS BY PRODUCT
      59. | 6.59 BRAZIL MARKET ANALYSIS BY END-USER
      60. | 6.60 MEXICO MARKET ANALYSIS BY TECHNOLOGY
      61. | 6.61 MEXICO MARKET ANALYSIS BY PRODUCT
      62. | 6.62 MEXICO MARKET ANALYSIS BY END-USER
      63. | 6.63 ARGENTINA MARKET ANALYSIS BY TECHNOLOGY
      64. | 6.64 ARGENTINA MARKET ANALYSIS BY PRODUCT
      65. | 6.65 ARGENTINA MARKET ANALYSIS BY END-USER
      66. | 6.66 REST OF SOUTH AMERICA MARKET ANALYSIS BY TECHNOLOGY
      67. | 6.67 REST OF SOUTH AMERICA MARKET ANALYSIS BY PRODUCT
      68. | 6.68 REST OF SOUTH AMERICA MARKET ANALYSIS BY END-USER
      69. | 6.69 MEA MARKET ANALYSIS
      70. | 6.70 GCC COUNTRIES MARKET ANALYSIS BY TECHNOLOGY
      71. | 6.71 GCC COUNTRIES MARKET ANALYSIS BY PRODUCT
      72. | 6.72 GCC COUNTRIES MARKET ANALYSIS BY END-USER
      73. | 6.73 SOUTH AFRICA MARKET ANALYSIS BY TECHNOLOGY
      74. | 6.74 SOUTH AFRICA MARKET ANALYSIS BY PRODUCT
      75. | 6.75 SOUTH AFRICA MARKET ANALYSIS BY END-USER
      76. | 6.76 REST OF MEA MARKET ANALYSIS BY TECHNOLOGY
      77. | 6.77 REST OF MEA MARKET ANALYSIS BY PRODUCT
      78. | 6.78 REST OF MEA MARKET ANALYSIS BY END-USER
      79. | 6.79 KEY BUYING CRITERIA OF HEALTHCARE
      80. | 6.80 RESEARCH PROCESS OF MRFR
      81. | 6.81 DRO ANALYSIS OF HEALTHCARE
      82. | 6.82 DRIVERS IMPACT ANALYSIS: HEALTHCARE
      83. | 6.83 RESTRAINTS IMPACT ANALYSIS: HEALTHCARE
      84. | 6.84 SUPPLY / VALUE CHAIN: HEALTHCARE
      85. | 6.85 HEALTHCARE, BY TECHNOLOGY, 2024 (% SHARE)
      86. | 6.86 HEALTHCARE, BY TECHNOLOGY, 2024 TO 2035 (USD Billion)
      87. | 6.87 HEALTHCARE, BY PRODUCT, 2024 (% SHARE)
      88. | 6.88 HEALTHCARE, BY PRODUCT, 2024 TO 2035 (USD Billion)
      89. | 6.89 HEALTHCARE, BY END-USER, 2024 (% SHARE)
      90. | 6.90 HEALTHCARE, BY END-USER, 2024 TO 2035 (USD Billion)
      91. | 6.91 BENCHMARKING OF MAJOR COMPETITORS
    7. LIST OF TABLES
      1. | 7.1 LIST OF ASSUMPTIONS
      2. | | 7.1.1
      3. | 7.2 North America MARKET SIZE ESTIMATES; FORECAST
      4. | | 7.2.1 BY TECHNOLOGY, 2025-2035 (USD Billion)
      5. | | 7.2.2 BY PRODUCT, 2025-2035 (USD Billion)
      6. | | 7.2.3 BY END-USER, 2025-2035 (USD Billion)
      7. | 7.3 US MARKET SIZE ESTIMATES; FORECAST
      8. | | 7.3.1 BY TECHNOLOGY, 2025-2035 (USD Billion)
      9. | | 7.3.2 BY PRODUCT, 2025-2035 (USD Billion)
      10. | | 7.3.3 BY END-USER, 2025-2035 (USD Billion)
      11. | 7.4 Canada MARKET SIZE ESTIMATES; FORECAST
      12. | | 7.4.1 BY TECHNOLOGY, 2025-2035 (USD Billion)
      13. | | 7.4.2 BY PRODUCT, 2025-2035 (USD Billion)
      14. | | 7.4.3 BY END-USER, 2025-2035 (USD Billion)
      15. | 7.5 Europe MARKET SIZE ESTIMATES; FORECAST
      16. | | 7.5.1 BY TECHNOLOGY, 2025-2035 (USD Billion)
      17. | | 7.5.2 BY PRODUCT, 2025-2035 (USD Billion)
      18. | | 7.5.3 BY END-USER, 2025-2035 (USD Billion)
      19. | 7.6 Germany MARKET SIZE ESTIMATES; FORECAST
      20. | | 7.6.1 BY TECHNOLOGY, 2025-2035 (USD Billion)
      21. | | 7.6.2 BY PRODUCT, 2025-2035 (USD Billion)
      22. | | 7.6.3 BY END-USER, 2025-2035 (USD Billion)
      23. | 7.7 UK MARKET SIZE ESTIMATES; FORECAST
      24. | | 7.7.1 BY TECHNOLOGY, 2025-2035 (USD Billion)
      25. | | 7.7.2 BY PRODUCT, 2025-2035 (USD Billion)
      26. | | 7.7.3 BY END-USER, 2025-2035 (USD Billion)
      27. | 7.8 France MARKET SIZE ESTIMATES; FORECAST
      28. | | 7.8.1 BY TECHNOLOGY, 2025-2035 (USD Billion)
      29. | | 7.8.2 BY PRODUCT, 2025-2035 (USD Billion)
      30. | | 7.8.3 BY END-USER, 2025-2035 (USD Billion)
      31. | 7.9 Russia MARKET SIZE ESTIMATES; FORECAST
      32. | | 7.9.1 BY TECHNOLOGY, 2025-2035 (USD Billion)
      33. | | 7.9.2 BY PRODUCT, 2025-2035 (USD Billion)
      34. | | 7.9.3 BY END-USER, 2025-2035 (USD Billion)
      35. | 7.10 Italy MARKET SIZE ESTIMATES; FORECAST
      36. | | 7.10.1 BY TECHNOLOGY, 2025-2035 (USD Billion)
      37. | | 7.10.2 BY PRODUCT, 2025-2035 (USD Billion)
      38. | | 7.10.3 BY END-USER, 2025-2035 (USD Billion)
      39. | 7.11 Spain MARKET SIZE ESTIMATES; FORECAST
      40. | | 7.11.1 BY TECHNOLOGY, 2025-2035 (USD Billion)
      41. | | 7.11.2 BY PRODUCT, 2025-2035 (USD Billion)
      42. | | 7.11.3 BY END-USER, 2025-2035 (USD Billion)
      43. | 7.12 Rest of Europe MARKET SIZE ESTIMATES; FORECAST
      44. | | 7.12.1 BY TECHNOLOGY, 2025-2035 (USD Billion)
      45. | | 7.12.2 BY PRODUCT, 2025-2035 (USD Billion)
      46. | | 7.12.3 BY END-USER, 2025-2035 (USD Billion)
      47. | 7.13 APAC MARKET SIZE ESTIMATES; FORECAST
      48. | | 7.13.1 BY TECHNOLOGY, 2025-2035 (USD Billion)
      49. | | 7.13.2 BY PRODUCT, 2025-2035 (USD Billion)
      50. | | 7.13.3 BY END-USER, 2025-2035 (USD Billion)
      51. | 7.14 China MARKET SIZE ESTIMATES; FORECAST
      52. | | 7.14.1 BY TECHNOLOGY, 2025-2035 (USD Billion)
      53. | | 7.14.2 BY PRODUCT, 2025-2035 (USD Billion)
      54. | | 7.14.3 BY END-USER, 2025-2035 (USD Billion)
      55. | 7.15 India MARKET SIZE ESTIMATES; FORECAST
      56. | | 7.15.1 BY TECHNOLOGY, 2025-2035 (USD Billion)
      57. | | 7.15.2 BY PRODUCT, 2025-2035 (USD Billion)
      58. | | 7.15.3 BY END-USER, 2025-2035 (USD Billion)
      59. | 7.16 Japan MARKET SIZE ESTIMATES; FORECAST
      60. | | 7.16.1 BY TECHNOLOGY, 2025-2035 (USD Billion)
      61. | | 7.16.2 BY PRODUCT, 2025-2035 (USD Billion)
      62. | | 7.16.3 BY END-USER, 2025-2035 (USD Billion)
      63. | 7.17 South Korea MARKET SIZE ESTIMATES; FORECAST
      64. | | 7.17.1 BY TECHNOLOGY, 2025-2035 (USD Billion)
      65. | | 7.17.2 BY PRODUCT, 2025-2035 (USD Billion)
      66. | | 7.17.3 BY END-USER, 2025-2035 (USD Billion)
      67. | 7.18 Malaysia MARKET SIZE ESTIMATES; FORECAST
      68. | | 7.18.1 BY TECHNOLOGY, 2025-2035 (USD Billion)
      69. | | 7.18.2 BY PRODUCT, 2025-2035 (USD Billion)
      70. | | 7.18.3 BY END-USER, 2025-2035 (USD Billion)
      71. | 7.19 Thailand MARKET SIZE ESTIMATES; FORECAST
      72. | | 7.19.1 BY TECHNOLOGY, 2025-2035 (USD Billion)
      73. | | 7.19.2 BY PRODUCT, 2025-2035 (USD Billion)
      74. | | 7.19.3 BY END-USER, 2025-2035 (USD Billion)
      75. | 7.20 Indonesia MARKET SIZE ESTIMATES; FORECAST
      76. | | 7.20.1 BY TECHNOLOGY, 2025-2035 (USD Billion)
      77. | | 7.20.2 BY PRODUCT, 2025-2035 (USD Billion)
      78. | | 7.20.3 BY END-USER, 2025-2035 (USD Billion)
      79. | 7.21 Rest of APAC MARKET SIZE ESTIMATES; FORECAST
      80. | | 7.21.1 BY TECHNOLOGY, 2025-2035 (USD Billion)
      81. | | 7.21.2 BY PRODUCT, 2025-2035 (USD Billion)
      82. | | 7.21.3 BY END-USER, 2025-2035 (USD Billion)
      83. | 7.22 South America MARKET SIZE ESTIMATES; FORECAST
      84. | | 7.22.1 BY TECHNOLOGY, 2025-2035 (USD Billion)
      85. | | 7.22.2 BY PRODUCT, 2025-2035 (USD Billion)
      86. | | 7.22.3 BY END-USER, 2025-2035 (USD Billion)
      87. | 7.23 Brazil MARKET SIZE ESTIMATES; FORECAST
      88. | | 7.23.1 BY TECHNOLOGY, 2025-2035 (USD Billion)
      89. | | 7.23.2 BY PRODUCT, 2025-2035 (USD Billion)
      90. | | 7.23.3 BY END-USER, 2025-2035 (USD Billion)
      91. | 7.24 Mexico MARKET SIZE ESTIMATES; FORECAST
      92. | | 7.24.1 BY TECHNOLOGY, 2025-2035 (USD Billion)
      93. | | 7.24.2 BY PRODUCT, 2025-2035 (USD Billion)
      94. | | 7.24.3 BY END-USER, 2025-2035 (USD Billion)
      95. | 7.25 Argentina MARKET SIZE ESTIMATES; FORECAST
      96. | | 7.25.1 BY TECHNOLOGY, 2025-2035 (USD Billion)
      97. | | 7.25.2 BY PRODUCT, 2025-2035 (USD Billion)
      98. | | 7.25.3 BY END-USER, 2025-2035 (USD Billion)
      99. | 7.26 Rest of South America MARKET SIZE ESTIMATES; FORECAST
      100. | | 7.26.1 BY TECHNOLOGY, 2025-2035 (USD Billion)
      101. | | 7.26.2 BY PRODUCT, 2025-2035 (USD Billion)
      102. | | 7.26.3 BY END-USER, 2025-2035 (USD Billion)
      103. | 7.27 MEA MARKET SIZE ESTIMATES; FORECAST
      104. | | 7.27.1 BY TECHNOLOGY, 2025-2035 (USD Billion)
      105. | | 7.27.2 BY PRODUCT, 2025-2035 (USD Billion)
      106. | | 7.27.3 BY END-USER, 2025-2035 (USD Billion)
      107. | 7.28 GCC Countries MARKET SIZE ESTIMATES; FORECAST
      108. | | 7.28.1 BY TECHNOLOGY, 2025-2035 (USD Billion)
      109. | | 7.28.2 BY PRODUCT, 2025-2035 (USD Billion)
      110. | | 7.28.3 BY END-USER, 2025-2035 (USD Billion)
      111. | 7.29 South Africa MARKET SIZE ESTIMATES; FORECAST
      112. | | 7.29.1 BY TECHNOLOGY, 2025-2035 (USD Billion)
      113. | | 7.29.2 BY PRODUCT, 2025-2035 (USD Billion)
      114. | | 7.29.3 BY END-USER, 2025-2035 (USD Billion)
      115. | 7.30 Rest of MEA MARKET SIZE ESTIMATES; FORECAST
      116. | | 7.30.1 BY TECHNOLOGY, 2025-2035 (USD Billion)
      117. | | 7.30.2 BY PRODUCT, 2025-2035 (USD Billion)
      118. | | 7.30.3 BY END-USER, 2025-2035 (USD Billion)
      119. | 7.31 PRODUCT LAUNCH/PRODUCT DEVELOPMENT/APPROVAL
      120. | | 7.31.1
      121. | 7.32 ACQUISITION/PARTNERSHIP
      122. | | 7.32.1

    HbA1c Testing Market Segmentation

    Market Segmentation Overview

    • Detailed segmentation data will be available in the full report
    • Comprehensive analysis by multiple parameters
    • Regional and country-level breakdowns
    • Market size forecasts by segment
    Infographic

    Free Sample Request

    Kindly complete the form below to receive a free sample of this Report

    Get Free Sample

    Customer Strories

    “I am very pleased with how market segments have been defined in a relevant way for my purposes (such as "Portable Freezers & refrigerators" and "last-mile"). In general the report is well structured. Thanks very much for your efforts.”

    Victoria Milne

    Founder
    Case Study
    Chemicals and Materials

    Compare Licence

    ×
    Features License Type
    Single User Multiuser License Enterprise User
    Price $4,950 $5,950 $7,250
    Maximum User Access Limit 1 User Upto 10 Users Unrestricted Access Throughout the Organization
    Free Customization
    Direct Access to Analyst
    Deliverable Format
    Platform Access
    Discount on Next Purchase 10% 15% 15%
    Printable Versions