×
  • Cat-intel
  • MedIntelliX
  • Resources
  • About Us
  • Hero Background
    English
    Chinese
    French
    Japanese
    Korean
    German
    Spanish

    Green Mining Market Size

    ID: MRFR/CnM/9876-HCR
    111 Pages
    Chitranshi Jaiswal
    October 2025

    Green Mining Market Research Report By Technology (Biomining, Hydrometallurgy, Recycling, Electromagnetic Separation), By Method (Open-Pit Mining, Underground Mining, In-Situ Mining), By Material Type (Precious Metals, Base Metals, Rare Earth Elements, Industrial Minerals), By End Use (Construction, Electronics, Automotive, Energy) and By Regional (North America, Europe, South America, Asia Pac...

    Share:
    Download PDF ×

    We do not share your information with anyone. However, we may send you emails based on your report interest from time to time. You may contact us at any time to opt-out.

    Green Mining Market Infographic
    Purchase Options

    Green Mining Size

    Green Mining Market Growth Projections and Opportunities

    Green Mining Market Size was valued at USD 10.5 Billion in 2022. The Green Mining industry is projected to grow from USD 11.6 Billion in 2023 to USD 25.8 Billion by 2032, exhibiting a compound annual growth rate (CAGR) of 10.50%

    Environmental Regulations and Compliance: Stringent environmental regulations imposed by governments and international bodies drive the adoption of green mining practices. Compliance with these regulations is essential for mining companies to operate legally and sustainably, influencing market dynamics.

    Technological Innovations: Advancements in technology, such as automated machinery, renewable energy sources, and advanced monitoring systems, are transforming the mining industry towards greener practices. Integration of these technologies enhances efficiency, reduces environmental impact, and fosters market growth.

    Resource Scarcity and Demand: Depletion of traditional resources and increasing demand for minerals necessitate the adoption of sustainable mining practices. Green mining offers solutions to address resource scarcity concerns while meeting the growing demand for essential minerals, influencing market dynamics.

    Cost Savings and Efficiency: Green mining practices, including energy efficiency measures and waste reduction initiatives, not only minimize environmental impact but also result in cost savings for mining companies. The potential for reduced operational costs drives the adoption of green mining practices and influences market trends.

    Investor Preferences and ESG Criteria: Investors increasingly prioritize environmental, social, and governance (ESG) criteria when making investment decisions. Mining companies that embrace green practices and demonstrate commitment to sustainability attract investment, influencing market dynamics and shaping industry standards.

    Community Engagement and Social Responsibility: Engagement with local communities and adherence to social responsibility principles are integral aspects of green mining initiatives. Mining companies that prioritize community well-being and environmental stewardship foster positive relationships, influencing market perception and competitiveness.

    Supply Chain Sustainability: Green mining extends beyond on-site operations to include sustainable practices throughout the entire supply chain. Collaboration with suppliers and partners to adopt environmentally friendly practices enhances market sustainability and resilience.

    Market Demand for Sustainable Products: Consumer demand for ethically sourced and environmentally sustainable products influences the mining industry. Green mining practices contribute to the production of sustainable raw materials, aligning with consumer preferences and driving market demand.

    Government Incentives and Support: Governments and regulatory bodies incentivize green mining initiatives through grants, subsidies, and tax incentives. Policy support for sustainable mining practices encourages industry-wide adoption and influences market dynamics.

    Risk Mitigation and Long-Term Viability: Green mining practices mitigate environmental risks and enhance the long-term viability of mining operations. Mining companies that prioritize sustainability are better positioned to withstand regulatory changes, market fluctuations, and environmental challenges, influencing market resilience.
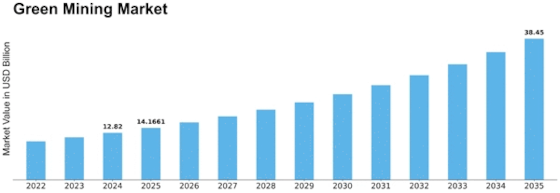
    Green Mining Market Size Graph
    Author
    Chitranshi Jaiswal
    Research Analyst Level I

    In her 3 years of experience in the market research field, she has handled critical cross-domain projects. She has an in-depth knowledge of market estimation & analysis, problem-solving, primary as well as secondary research, and team management.She holds an engineering degree and is an MBA professional from a well-known university, capable of evaluating the market and competitive conditions. An exceptional strategist with excellent communication skills and a passion for delivering cutting-edge & practical insights for the market. Proficient in multi-tasking, and can successfully deal with competing demands, while maintaining complete confidentiality. Generated business through active client and project development, networking, and high-quality responses. Her knowledge and skills have helped in making solid business decisions, securing funding from investors, and avoiding business failures.

    Leave a Comment

    FAQs

    What is the current valuation of the Green Mining Market?

    As of 2024, the Green Mining Market was valued at 12.82 USD Billion.

    What is the projected market size for the Green Mining Market by 2035?

    The Green Mining Market is projected to reach a valuation of 38.45 USD Billion by 2035.

    What is the expected CAGR for the Green Mining Market during the forecast period?

    The expected CAGR for the Green Mining Market from 2025 to 2035 is 10.5%.

    Which technologies are driving growth in the Green Mining Market?

    Key technologies include Biomining, Hydrometallurgy, Recycling, and Electromagnetic Separation, with Recycling projected to grow from 4.0 to 12.0 USD Billion.

    What are the primary methods utilized in the Green Mining Market?

    The primary methods include Open-Pit Mining, Underground Mining, and In-Situ Mining, with Open-Pit Mining expected to grow from 4.5 to 13.5 USD Billion.

    What types of materials are being mined in the Green Mining sector?

    The sector focuses on Precious Metals, Base Metals, Rare Earth Elements, and Industrial Minerals, with Base Metals projected to grow from 4.0 to 12.0 USD Billion.

    What are the main end-use applications for products from the Green Mining Market?

    End-use applications include Construction, Electronics, Automotive, and Energy, with Energy expected to grow from 5.32 to 15.95 USD Billion.

    Who are the key players in the Green Mining Market?

    Key players include BHP, Rio Tinto, Vale, Anglo American, Newmont Corporation, Barrick Gold Corporation, Teck Resources Limited, Southern Copper Corporation, and Freeport-McMoRan.

    Market Summary

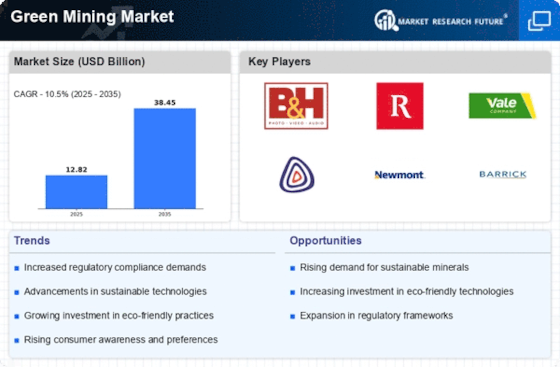
    As per MRFR analysis, the Green Mining Market Size was estimated at 12.82 USD Billion in 2024. The Green Mining industry is projected to grow from 14.16 USD Billion in 2025 to 38.45 USD Billion by 2035, exhibiting a compound annual growth rate (CAGR) of 10.5 during the forecast period 2025 - 2035.

    Key Market Trends & Highlights

    The Green Mining Market is poised for substantial growth driven by technological advancements and increasing consumer demand for sustainable practices.

    • North America remains the largest market for green mining, driven by stringent regulatory frameworks and a focus on sustainability.
    • Asia-Pacific is emerging as the fastest-growing region, with rapid advancements in mining technologies and increasing investments in sustainable practices.
    • Biomining continues to dominate as the largest segment, while hydrometallurgy is gaining traction as the fastest-growing segment due to its efficiency and lower environmental impact.
    • Technological advancements and rising consumer awareness are key drivers propelling the growth of green mining practices.

    Market Size & Forecast

    2024 Market Size 12.82 (USD Billion)
    2035 Market Size 38.45 (USD Billion)
    CAGR (2025 - 2035) 10.5%
    Largest Regional Market Share in 2024 North America

    Major Players

    <p>BHP (AU), Rio Tinto (GB), Vale (BR), Anglo American (GB), Newmont Corporation (US), Barrick Gold Corporation (CA), Teck Resources Limited (CA), Southern Copper Corporation (US), Freeport-McMoRan Inc. (US)</p>

    Market Trends

    The Green Mining Market is currently experiencing a transformative phase, driven by the increasing emphasis on sustainable practices within the mining sector. Stakeholders are progressively recognizing the necessity of minimizing environmental impacts while maximizing resource efficiency. This shift is largely influenced by regulatory frameworks and public awareness regarding ecological preservation. As a result, companies are adopting innovative technologies and methodologies that align with green principles, thereby enhancing their operational sustainability. Furthermore, the integration of renewable energy sources into mining operations is becoming more prevalent, suggesting a potential reduction in carbon footprints and operational costs. In addition to technological advancements, the Green Mining Market is witnessing a growing collaboration among industry players, governments, and research institutions. This collaborative approach appears to foster the development of best practices and standards that promote environmental stewardship. Moreover, the rising demand for ethically sourced minerals is likely to propel the market forward, as consumers increasingly prefer products that are mined responsibly. Overall, the Green Mining Market seems poised for substantial growth, driven by a collective commitment to sustainable development and resource management.

    Technological Innovation

    The Green Mining Market is characterized by a surge in technological advancements aimed at reducing environmental impacts. Innovations such as automated machinery, advanced mineral processing techniques, and waste recycling systems are becoming commonplace. These technologies not only enhance efficiency but also contribute to lower emissions and reduced resource consumption.

    Regulatory Influence

    Government regulations are playing a pivotal role in shaping the Green Mining Market. Stricter environmental policies and sustainability mandates are compelling mining companies to adopt greener practices. Compliance with these regulations is not merely a legal obligation; it is increasingly viewed as a competitive advantage in the marketplace.

    Consumer Demand for Sustainability

    There is a noticeable shift in consumer preferences towards sustainably sourced materials. The Green Mining Market is responding to this trend by ensuring that mining practices align with ethical standards. This growing demand for transparency and responsibility in sourcing is likely to drive companies to enhance their sustainability efforts.

    Green Mining Market Market Drivers

    Collaboration and Partnerships

    The Green Mining Market is increasingly characterized by collaboration and partnerships among various stakeholders, including mining companies, governments, and environmental organizations. These collaborations aim to promote sustainable mining practices and address environmental challenges associated with mining activities. For instance, partnerships between mining companies and research institutions are fostering the development of innovative technologies that minimize environmental impact. Additionally, joint initiatives focused on community engagement and environmental restoration are becoming more common. Such collaborations not only enhance the credibility of mining operations but also contribute to the overall sustainability of the industry. As these partnerships continue to grow, they are likely to play a crucial role in shaping the future of the Green Mining Market, fostering a more sustainable approach to resource extraction.

    Regulatory Frameworks and Policies

    The Green Mining Market is significantly influenced by evolving regulatory frameworks and policies aimed at promoting sustainable practices. Governments worldwide are implementing stricter environmental regulations that mandate mining companies to adopt greener technologies and methods. For example, regulations that require the reduction of greenhouse gas emissions and the management of waste materials are becoming more common. This regulatory pressure is compelling companies to invest in cleaner technologies, which, in turn, is expected to drive growth in the Green Mining Market. Additionally, incentives such as tax breaks for companies that demonstrate sustainable practices are further encouraging compliance. As these regulations become more stringent, the industry may witness a shift towards more responsible mining practices, ultimately benefiting the environment and society.

    Rising Consumer Awareness and Demand

    The Green Mining Market is witnessing a notable increase in consumer awareness regarding environmental issues and sustainability. As consumers become more informed about the ecological impacts of mining, there is a growing demand for responsibly sourced minerals and metals. This shift in consumer behavior is prompting companies to adopt sustainable practices in their operations. Market data indicates that approximately 70 percent of consumers are willing to pay a premium for products that are certified as environmentally friendly. Consequently, mining companies are increasingly focusing on transparency in their supply chains and implementing sustainable mining practices to meet this demand. This trend not only enhances brand reputation but also drives growth in the Green Mining Market, as companies strive to align their operations with consumer expectations.

    Technological Advancements in Mining

    The Green Mining Market is experiencing a surge in technological advancements that enhance efficiency and reduce environmental impact. Innovations such as automated machinery, real-time monitoring systems, and advanced data analytics are transforming traditional mining practices. For instance, the integration of artificial intelligence in resource extraction processes has shown to increase productivity by up to 30 percent while minimizing waste. Furthermore, the adoption of renewable energy sources, such as solar and wind, in mining operations is becoming more prevalent, leading to a decrease in carbon emissions. This shift not only aligns with sustainability goals but also appeals to investors who prioritize environmentally responsible practices. As these technologies continue to evolve, they are likely to play a pivotal role in shaping the future of the Green Mining Market.

    Investment in Sustainable Mining Practices

    The Green Mining Market is benefiting from a surge in investment directed towards sustainable mining practices. Investors are increasingly recognizing the long-term value of environmentally responsible mining operations. Reports indicate that investments in green technologies and sustainable practices within the mining sector have grown by over 25 percent in recent years. This influx of capital is enabling companies to develop and implement innovative solutions that reduce environmental impact, such as water recycling systems and waste reduction technologies. Furthermore, as financial institutions begin to prioritize environmental, social, and governance (ESG) criteria in their investment decisions, mining companies that adopt sustainable practices are likely to attract more funding. This trend is expected to accelerate the transition towards greener mining operations, thereby enhancing the overall growth of the Green Mining Market.

    Market Segment Insights

    By Technology: Biomining (Largest) vs. Hydrometallurgy (Fastest-Growing)

    <p>In the Green Mining Market, the technology segment is diversifying, with biomining capturing the largest market share. This method leverages biological processes to extract metals from ores, which positions it favorably in sustainable mining approaches. Hydrometallurgy follows closely, marked by its innovative techniques for metal recovery from solutions, showcasing a significant increase in market interest and application across various sectors. Both segments indicate a growing trend towards environmentally friendly and efficient mining practices, which are essential in today's market landscape.</p>

    <p>Biomining: Dominant vs. Hydrometallurgy: Emerging</p>

    <p>Biomining stands as a dominant force in the Green Mining Market, utilizing natural processes involving microorganisms to recover valuable metals from ores. It appeals to eco-conscious stakeholders and increasingly becomes the preferred method due to its lower environmental impact and cost-effectiveness. On the other hand, hydrometallurgy represents an emerging technology characterized by its ability to efficiently recover metals from electronic waste and other complex matrices. This method is rapidly gaining traction, driven by robust technological advancements and the need for improved end-of-life management solutions for electronic products. As industries seek sustainable practices, both technologies contribute substantially to the evolution of the mining sector.</p>

    By Method: Open-Pit Mining (Largest) vs. Underground Mining (Fastest-Growing)

    <p>In the Green Mining Market, the method of extracting minerals plays a crucial role in determining operational efficiency and environmental impact. Open-Pit Mining is currently the largest segment, dominating the market due to its widespread application and relatively lower initial costs compared to underground methods. Conversely, Underground Mining, while smaller in market share, is gaining traction due to its ability to minimize surface disturbance and reduce ecological footprints. In-Situ Mining also contributes to this section but commands a smaller share amid concerns over its environmental implications.</p>

    <p>Open-Pit Mining (Dominant) vs. Underground Mining (Emerging)</p>

    <p>Open-Pit Mining is recognized as the dominant method in the Green Mining Market, characterized by its large-scale operations and efficiency in resource extraction. This method minimizes waste and facilitates easier access to minerals. Notably, advancements in sustainable practices are becoming integral to this sector, aligning with green mining initiatives aimed at reducing environmental impacts. On the other hand, Underground Mining is emerging rapidly, driven by its potential for lower surface disturbance and higher recovery rates. This method is becoming increasingly relevant as regulations tighten around environmental sustainability, encouraging mining companies to adopt technologies for improving safety and reducing waste, thereby carving a significant niche in the market.</p>

    By Material Type: Precious Metals (Largest) vs. Rare Earth Elements (Fastest-Growing)

    <p>In the Green Mining Market, the segment of Precious Metals holds the largest share, benefiting from continuous demand in various industries including electronics and jewelry. Following Precious Metals, Base Metals and Industrial Minerals have notable presence, while Rare Earth Elements emerge as a crucial component due to their role in advanced technologies. Overall, the distribution reflects the ongoing trend of sustainable sourcing across the mining sector.</p>

    <p>Precious Metals (Dominant) vs. Rare Earth Elements (Emerging)</p>

    <p>Precious Metals remain a dominant player in the Green Mining Market, driven by their intrinsic value and utility in renewable energy technologies. Their extraction processes are evolving towards more sustainable practices, increasing their appeal to eco-conscious consumers. In contrast, Rare Earth Elements are emerging rapidly, largely due to their pivotal role in manufacturing high-tech devices and renewable technologies. The green mining initiatives are enhancing the extraction techniques for these elements, making them a priority for investors and companies focusing on sustainability.</p>

    By End Use: Construction (Largest) vs. Electronics (Fastest-Growing)

    <p>In the Green Mining Market, the end use segment is diverse, exhibiting varying shares among different industries. Construction stands out as the largest segment, driven by the increasing demand for sustainable materials and eco-friendly practices. Following closely is the electronics industry, which, while smaller, is rapidly gaining traction due to the growing emphasis on green technologies and electronic waste recycling, thereby reshaping market dynamics.</p>

    <p>Construction (Dominant) vs. Electronics (Emerging)</p>

    <p>The construction sector plays a pivotal role in the Green Mining Market, characterized by its substantial reliance on sustainable materials sourced through environmentally friendly mining practices. This segment focuses on minimizing waste and promoting energy efficiency, thus aligning with global sustainability goals. In contrast, the electronics segment, though emerging, is gaining momentum as more manufacturers adopt green mining techniques to source materials like rare earth elements crucial for electronic components. This shift not only addresses environmental concerns but also enhances corporate responsibility in the tech industry, making electronics a significant player in the green mining landscape.</p>

    Get more detailed insights about Green Mining Market Research Report—Global Forecast till 2035

    Regional Insights

    Europe : Innovative Regulatory Frameworks

    Europe is rapidly emerging as a significant player in the green mining market, driven by ambitious sustainability goals and regulatory frameworks aimed at reducing carbon emissions. The region accounts for approximately 30% of the global market share, with Germany and Sweden leading the charge. The European Green Deal and various national policies are incentivizing the adoption of green technologies in mining operations, fostering a shift towards sustainable practices. Countries like Germany and Sweden are at the forefront, with companies such as Anglo American and Rio Tinto investing in innovative mining solutions. The competitive landscape is characterized by a strong emphasis on environmental responsibility, with firms actively seeking to minimize their ecological impact. This commitment to sustainability is reshaping the mining sector in Europe, making it a hub for green mining initiatives.

    Asia-Pacific : Emerging Market Potential

    Asia-Pacific is witnessing a surge in the green mining market, driven by increasing demand for minerals and metals, coupled with a growing awareness of environmental sustainability. The region holds about 25% of the global market share, with Australia and China being the largest contributors. Government initiatives aimed at promoting sustainable mining practices are catalyzing investments in green technologies, making this region a focal point for innovation in the mining sector. Australia is home to major players like BHP and Rio Tinto, who are leading the way in sustainable mining practices. China is also making strides in adopting greener technologies, although challenges remain in balancing economic growth with environmental concerns. The competitive landscape is evolving, with a focus on reducing carbon emissions and enhancing resource efficiency, positioning Asia-Pacific as a key player in The Green Mining.

    Middle East and Africa : Resource-Rich Opportunities

    The Middle East and Africa are emerging as significant players in the green mining market, driven by abundant natural resources and a growing focus on sustainable practices. This region holds approximately 5% of the global market share, with South Africa and Morocco leading the way. Regulatory frameworks are gradually evolving to support sustainable mining initiatives, encouraging investments in eco-friendly technologies and practices. South Africa is home to key players like Anglo American and Teck Resources, who are actively pursuing sustainable mining solutions. The competitive landscape is characterized by a mix of established companies and emerging players, all striving to enhance their environmental performance. As the region continues to develop its mining sector, the emphasis on sustainability is expected to grow, unlocking new opportunities for green mining initiatives.

    Key Players and Competitive Insights

    The Green Mining Market is currently characterized by a dynamic competitive landscape, driven by increasing regulatory pressures and a growing emphasis on sustainable practices. Major players such as BHP (AU), Rio Tinto (GB), and Vale (BR) are actively pursuing strategies that emphasize innovation and sustainability. BHP (AU) has positioned itself as a leader in sustainable mining through its commitment to reducing carbon emissions and investing in renewable energy sources. Meanwhile, Rio Tinto (GB) focuses on technological advancements to enhance operational efficiency and minimize environmental impact, while Vale (BR) is concentrating on improving its supply chain sustainability and reducing waste. Collectively, these strategies not only enhance their competitive positioning but also contribute to a broader shift towards environmentally responsible mining practices.

    In terms of business tactics, companies are increasingly localizing manufacturing and optimizing their supply chains to reduce carbon footprints and enhance operational efficiency. The Green Mining Market appears moderately fragmented, with several key players exerting significant influence. This competitive structure allows for a diverse range of strategies, as companies seek to differentiate themselves through innovation and sustainability initiatives.

    In August 2025, Newmont Corporation (US) announced a partnership with a leading technology firm to develop AI-driven solutions aimed at optimizing resource extraction processes. This strategic move is likely to enhance Newmont's operational efficiency and reduce environmental impact, aligning with the growing trend of digital transformation in the mining sector. The integration of AI technologies could potentially revolutionize how resources are extracted, making the process more sustainable and cost-effective.

    In September 2025, Anglo American (GB) unveiled its new sustainability framework, which includes ambitious targets for reducing greenhouse gas emissions by 50% by 2030. This initiative underscores Anglo American's commitment to sustainability and positions the company as a frontrunner in the green mining sector. By setting such aggressive targets, the company not only enhances its reputation but also aligns itself with global sustainability goals, potentially attracting environmentally conscious investors.

    In October 2025, Barrick Gold Corporation (CA) announced the launch of a new initiative aimed at restoring ecosystems affected by mining activities. This initiative reflects a growing trend among mining companies to take responsibility for their environmental impact and invest in restoration efforts. By prioritizing ecosystem restoration, Barrick Gold (CA) is likely to improve its social license to operate and strengthen its brand image in an increasingly eco-conscious market.

    As of October 2025, the competitive trends in the Green Mining Market are increasingly defined by digitalization, sustainability, and the integration of advanced technologies. Strategic alliances are becoming more prevalent, as companies recognize the need to collaborate in order to achieve sustainability goals. The competitive landscape is shifting from traditional price-based competition to a focus on innovation, technology, and supply chain reliability. This evolution suggests that companies that prioritize sustainable practices and technological advancements will likely emerge as leaders in the Green Mining Market.

    Key Companies in the Green Mining Market market include

    Industry Developments

    • Q3 2025: July 2025 – Rio Tinto commissioned its first fully electrified haul truck fleet at the Oyu Tolgoi copper mine in Mongolia, reducing diesel consumption by 30% and cutting CO₂ emissions by 15,000 tons annually. Rio Tinto has deployed a fully electrified haul truck fleet at its Oyu Tolgoi copper mine in Mongolia, marking a significant step in green mining by reducing diesel use and CO₂ emissions at the site.
    • Q2 2025: June 2025 – Vale S.A. launched a pilot plant in Sudbury, Canada, employing bioleaching with specialized bacteria to extract nickel and copper, eliminating sulfur dioxide emissions from smelting. Vale S.A. opened a pilot plant in Sudbury, Canada, using bioleaching technology to extract metals, which eliminates sulfur dioxide emissions typically produced by traditional smelting processes.

    Future Outlook

    Green Mining Market Future Outlook

    <p>The Green Mining Market is projected to grow at a 10.5% CAGR from 2024 to 2035, driven by technological advancements, regulatory support, and increasing demand for sustainable practices.</p>

    New opportunities lie in:

    • <p>Development of eco-friendly extraction technologies</p>
    • <p>Investment in renewable energy sources for mining operations</p>
    • <p>Implementation of advanced waste management systems</p>

    <p>By 2035, the Green Mining Market is expected to achieve substantial growth, reflecting a robust commitment to sustainability.</p>

    Market Segmentation

    Green Mining Market Method Outlook

    • Open-Pit Mining
    • Underground Mining
    • In-Situ Mining

    Green Mining Market End Use Outlook

    • Construction
    • Electronics
    • Automotive
    • Energy

    Green Mining Market Technology Outlook

    • Biomining
    • Hydrometallurgy
    • Recycling
    • Electromagnetic Separation

    Green Mining Market Material Type Outlook

    • Precious Metals
    • Base Metals
    • Rare Earth Elements
    • Industrial Minerals

    Report Scope

    MARKET SIZE 202412.82(USD Billion)
    MARKET SIZE 202514.16(USD Billion)
    MARKET SIZE 203538.45(USD Billion)
    COMPOUND ANNUAL GROWTH RATE (CAGR)10.5% (2024 - 2035)
    REPORT COVERAGERevenue Forecast, Competitive Landscape, Growth Factors, and Trends
    BASE YEAR2024
    Market Forecast Period2025 - 2035
    Historical Data2019 - 2024
    Market Forecast UnitsUSD Billion
    Key Companies ProfiledMarket analysis in progress
    Segments CoveredMarket segmentation analysis in progress
    Key Market OpportunitiesAdoption of sustainable extraction technologies enhances efficiency in the Green Mining Market.
    Key Market DynamicsRising regulatory pressures and technological advancements drive the transition towards sustainable practices in the Green Mining Market.
    Countries CoveredNorth America, Europe, APAC, South America, MEA

    FAQs

    What is the current valuation of the Green Mining Market?

    As of 2024, the Green Mining Market was valued at 12.82 USD Billion.

    What is the projected market size for the Green Mining Market by 2035?

    The Green Mining Market is projected to reach a valuation of 38.45 USD Billion by 2035.

    What is the expected CAGR for the Green Mining Market during the forecast period?

    The expected CAGR for the Green Mining Market from 2025 to 2035 is 10.5%.

    Which technologies are driving growth in the Green Mining Market?

    Key technologies include Biomining, Hydrometallurgy, Recycling, and Electromagnetic Separation, with Recycling projected to grow from 4.0 to 12.0 USD Billion.

    What are the primary methods utilized in the Green Mining Market?

    The primary methods include Open-Pit Mining, Underground Mining, and In-Situ Mining, with Open-Pit Mining expected to grow from 4.5 to 13.5 USD Billion.

    What types of materials are being mined in the Green Mining sector?

    The sector focuses on Precious Metals, Base Metals, Rare Earth Elements, and Industrial Minerals, with Base Metals projected to grow from 4.0 to 12.0 USD Billion.

    What are the main end-use applications for products from the Green Mining Market?

    End-use applications include Construction, Electronics, Automotive, and Energy, with Energy expected to grow from 5.32 to 15.95 USD Billion.

    Who are the key players in the Green Mining Market?

    Key players include BHP, Rio Tinto, Vale, Anglo American, Newmont Corporation, Barrick Gold Corporation, Teck Resources Limited, Southern Copper Corporation, and Freeport-McMoRan.

    1. SECTION I: EXECUTIVE SUMMARY AND KEY HIGHLIGHTS
      1. | 1.1 EXECUTIVE SUMMARY
      2. | | 1.1.1 Market Overview
      3. | | 1.1.2 Key Findings
      4. | | 1.1.3 Market Segmentation
      5. | | 1.1.4 Competitive Landscape
      6. | | 1.1.5 Challenges and Opportunities
      7. | | 1.1.6 Future Outlook
    2. SECTION II: SCOPING, METHODOLOGY AND MARKET STRUCTURE
      1. | 2.1 MARKET INTRODUCTION
      2. | | 2.1.1 Definition
      3. | | 2.1.2 Scope of the study
      4. | | | 2.1.2.1 Research Objective
      5. | | | 2.1.2.2 Assumption
      6. | | | 2.1.2.3 Limitations
      7. | 2.2 RESEARCH METHODOLOGY
      8. | | 2.2.1 Overview
      9. | | 2.2.2 Data Mining
      10. | | 2.2.3 Secondary Research
      11. | | 2.2.4 Primary Research
      12. | | | 2.2.4.1 Primary Interviews and Information Gathering Process
      13. | | | 2.2.4.2 Breakdown of Primary Respondents
      14. | | 2.2.5 Forecasting Model
      15. | | 2.2.6 Market Size Estimation
      16. | | | 2.2.6.1 Bottom-Up Approach
      17. | | | 2.2.6.2 Top-Down Approach
      18. | | 2.2.7 Data Triangulation
      19. | | 2.2.8 Validation
    3. SECTION III: QUALITATIVE ANALYSIS
      1. | 3.1 MARKET DYNAMICS
      2. | | 3.1.1 Overview
      3. | | 3.1.2 Drivers
      4. | | 3.1.3 Restraints
      5. | | 3.1.4 Opportunities
      6. | 3.2 MARKET FACTOR ANALYSIS
      7. | | 3.2.1 Value chain Analysis
      8. | | 3.2.2 Porter's Five Forces Analysis
      9. | | | 3.2.2.1 Bargaining Power of Suppliers
      10. | | | 3.2.2.2 Bargaining Power of Buyers
      11. | | | 3.2.2.3 Threat of New Entrants
      12. | | | 3.2.2.4 Threat of Substitutes
      13. | | | 3.2.2.5 Intensity of Rivalry
      14. | | 3.2.3 COVID-19 Impact Analysis
      15. | | | 3.2.3.1 Market Impact Analysis
      16. | | | 3.2.3.2 Regional Impact
      17. | | | 3.2.3.3 Opportunity and Threat Analysis
    4. SECTION IV: QUANTITATIVE ANALYSIS
      1. | 4.1 Chemicals and Materials, BY Technology (USD Billion)
      2. | | 4.1.1 Biomining
      3. | | 4.1.2 Hydrometallurgy
      4. | | 4.1.3 Recycling
      5. | | 4.1.4 Electromagnetic Separation
      6. | 4.2 Chemicals and Materials, BY Method (USD Billion)
      7. | | 4.2.1 Open-Pit Mining
      8. | | 4.2.2 Underground Mining
      9. | | 4.2.3 In-Situ Mining
      10. | 4.3 Chemicals and Materials, BY Material Type (USD Billion)
      11. | | 4.3.1 Precious Metals
      12. | | 4.3.2 Base Metals
      13. | | 4.3.3 Rare Earth Elements
      14. | | 4.3.4 Industrial Minerals
      15. | 4.4 Chemicals and Materials, BY End Use (USD Billion)
      16. | | 4.4.1 Construction
      17. | | 4.4.2 Electronics
      18. | | 4.4.3 Automotive
      19. | | 4.4.4 Energy
      20. | 4.5 Chemicals and Materials, BY Region (USD Billion)
      21. | | 4.5.1 North America
      22. | | | 4.5.1.1 US
      23. | | | 4.5.1.2 Canada
      24. | | 4.5.2 Europe
      25. | | | 4.5.2.1 Germany
      26. | | | 4.5.2.2 UK
      27. | | | 4.5.2.3 France
      28. | | | 4.5.2.4 Russia
      29. | | | 4.5.2.5 Italy
      30. | | | 4.5.2.6 Spain
      31. | | | 4.5.2.7 Rest of Europe
      32. | | 4.5.3 APAC
      33. | | | 4.5.3.1 China
      34. | | | 4.5.3.2 India
      35. | | | 4.5.3.3 Japan
      36. | | | 4.5.3.4 South Korea
      37. | | | 4.5.3.5 Malaysia
      38. | | | 4.5.3.6 Thailand
      39. | | | 4.5.3.7 Indonesia
      40. | | | 4.5.3.8 Rest of APAC
      41. | | 4.5.4 South America
      42. | | | 4.5.4.1 Brazil
      43. | | | 4.5.4.2 Mexico
      44. | | | 4.5.4.3 Argentina
      45. | | | 4.5.4.4 Rest of South America
      46. | | 4.5.5 MEA
      47. | | | 4.5.5.1 GCC Countries
      48. | | | 4.5.5.2 South Africa
      49. | | | 4.5.5.3 Rest of MEA
    5. SECTION V: COMPETITIVE ANALYSIS
      1. | 5.1 Competitive Landscape
      2. | | 5.1.1 Overview
      3. | | 5.1.2 Competitive Analysis
      4. | | 5.1.3 Market share Analysis
      5. | | 5.1.4 Major Growth Strategy in the Chemicals and Materials
      6. | | 5.1.5 Competitive Benchmarking
      7. | | 5.1.6 Leading Players in Terms of Number of Developments in the Chemicals and Materials
      8. | | 5.1.7 Key developments and growth strategies
      9. | | | 5.1.7.1 New Product Launch/Service Deployment
      10. | | | 5.1.7.2 Merger & Acquisitions
      11. | | | 5.1.7.3 Joint Ventures
      12. | | 5.1.8 Major Players Financial Matrix
      13. | | | 5.1.8.1 Sales and Operating Income
      14. | | | 5.1.8.2 Major Players R&D Expenditure. 2023
      15. | 5.2 Company Profiles
      16. | | 5.2.1 BHP (AU)
      17. | | | 5.2.1.1 Financial Overview
      18. | | | 5.2.1.2 Products Offered
      19. | | | 5.2.1.3 Key Developments
      20. | | | 5.2.1.4 SWOT Analysis
      21. | | | 5.2.1.5 Key Strategies
      22. | | 5.2.2 Rio Tinto (GB)
      23. | | | 5.2.2.1 Financial Overview
      24. | | | 5.2.2.2 Products Offered
      25. | | | 5.2.2.3 Key Developments
      26. | | | 5.2.2.4 SWOT Analysis
      27. | | | 5.2.2.5 Key Strategies
      28. | | 5.2.3 Vale (BR)
      29. | | | 5.2.3.1 Financial Overview
      30. | | | 5.2.3.2 Products Offered
      31. | | | 5.2.3.3 Key Developments
      32. | | | 5.2.3.4 SWOT Analysis
      33. | | | 5.2.3.5 Key Strategies
      34. | | 5.2.4 Anglo American (GB)
      35. | | | 5.2.4.1 Financial Overview
      36. | | | 5.2.4.2 Products Offered
      37. | | | 5.2.4.3 Key Developments
      38. | | | 5.2.4.4 SWOT Analysis
      39. | | | 5.2.4.5 Key Strategies
      40. | | 5.2.5 Newmont Corporation (US)
      41. | | | 5.2.5.1 Financial Overview
      42. | | | 5.2.5.2 Products Offered
      43. | | | 5.2.5.3 Key Developments
      44. | | | 5.2.5.4 SWOT Analysis
      45. | | | 5.2.5.5 Key Strategies
      46. | | 5.2.6 Barrick Gold Corporation (CA)
      47. | | | 5.2.6.1 Financial Overview
      48. | | | 5.2.6.2 Products Offered
      49. | | | 5.2.6.3 Key Developments
      50. | | | 5.2.6.4 SWOT Analysis
      51. | | | 5.2.6.5 Key Strategies
      52. | | 5.2.7 Teck Resources Limited (CA)
      53. | | | 5.2.7.1 Financial Overview
      54. | | | 5.2.7.2 Products Offered
      55. | | | 5.2.7.3 Key Developments
      56. | | | 5.2.7.4 SWOT Analysis
      57. | | | 5.2.7.5 Key Strategies
      58. | | 5.2.8 Southern Copper Corporation (US)
      59. | | | 5.2.8.1 Financial Overview
      60. | | | 5.2.8.2 Products Offered
      61. | | | 5.2.8.3 Key Developments
      62. | | | 5.2.8.4 SWOT Analysis
      63. | | | 5.2.8.5 Key Strategies
      64. | | 5.2.9 Freeport-McMoRan Inc. (US)
      65. | | | 5.2.9.1 Financial Overview
      66. | | | 5.2.9.2 Products Offered
      67. | | | 5.2.9.3 Key Developments
      68. | | | 5.2.9.4 SWOT Analysis
      69. | | | 5.2.9.5 Key Strategies
      70. | 5.3 Appendix
      71. | | 5.3.1 References
      72. | | 5.3.2 Related Reports
    6. LIST OF FIGURES
      1. | 6.1 MARKET SYNOPSIS
      2. | 6.2 NORTH AMERICA MARKET ANALYSIS
      3. | 6.3 US MARKET ANALYSIS BY TECHNOLOGY
      4. | 6.4 US MARKET ANALYSIS BY METHOD
      5. | 6.5 US MARKET ANALYSIS BY MATERIAL TYPE
      6. | 6.6 US MARKET ANALYSIS BY END USE
      7. | 6.7 CANADA MARKET ANALYSIS BY TECHNOLOGY
      8. | 6.8 CANADA MARKET ANALYSIS BY METHOD
      9. | 6.9 CANADA MARKET ANALYSIS BY MATERIAL TYPE
      10. | 6.10 CANADA MARKET ANALYSIS BY END USE
      11. | 6.11 EUROPE MARKET ANALYSIS
      12. | 6.12 GERMANY MARKET ANALYSIS BY TECHNOLOGY
      13. | 6.13 GERMANY MARKET ANALYSIS BY METHOD
      14. | 6.14 GERMANY MARKET ANALYSIS BY MATERIAL TYPE
      15. | 6.15 GERMANY MARKET ANALYSIS BY END USE
      16. | 6.16 UK MARKET ANALYSIS BY TECHNOLOGY
      17. | 6.17 UK MARKET ANALYSIS BY METHOD
      18. | 6.18 UK MARKET ANALYSIS BY MATERIAL TYPE
      19. | 6.19 UK MARKET ANALYSIS BY END USE
      20. | 6.20 FRANCE MARKET ANALYSIS BY TECHNOLOGY
      21. | 6.21 FRANCE MARKET ANALYSIS BY METHOD
      22. | 6.22 FRANCE MARKET ANALYSIS BY MATERIAL TYPE
      23. | 6.23 FRANCE MARKET ANALYSIS BY END USE
      24. | 6.24 RUSSIA MARKET ANALYSIS BY TECHNOLOGY
      25. | 6.25 RUSSIA MARKET ANALYSIS BY METHOD
      26. | 6.26 RUSSIA MARKET ANALYSIS BY MATERIAL TYPE
      27. | 6.27 RUSSIA MARKET ANALYSIS BY END USE
      28. | 6.28 ITALY MARKET ANALYSIS BY TECHNOLOGY
      29. | 6.29 ITALY MARKET ANALYSIS BY METHOD
      30. | 6.30 ITALY MARKET ANALYSIS BY MATERIAL TYPE
      31. | 6.31 ITALY MARKET ANALYSIS BY END USE
      32. | 6.32 SPAIN MARKET ANALYSIS BY TECHNOLOGY
      33. | 6.33 SPAIN MARKET ANALYSIS BY METHOD
      34. | 6.34 SPAIN MARKET ANALYSIS BY MATERIAL TYPE
      35. | 6.35 SPAIN MARKET ANALYSIS BY END USE
      36. | 6.36 REST OF EUROPE MARKET ANALYSIS BY TECHNOLOGY
      37. | 6.37 REST OF EUROPE MARKET ANALYSIS BY METHOD
      38. | 6.38 REST OF EUROPE MARKET ANALYSIS BY MATERIAL TYPE
      39. | 6.39 REST OF EUROPE MARKET ANALYSIS BY END USE
      40. | 6.40 APAC MARKET ANALYSIS
      41. | 6.41 CHINA MARKET ANALYSIS BY TECHNOLOGY
      42. | 6.42 CHINA MARKET ANALYSIS BY METHOD
      43. | 6.43 CHINA MARKET ANALYSIS BY MATERIAL TYPE
      44. | 6.44 CHINA MARKET ANALYSIS BY END USE
      45. | 6.45 INDIA MARKET ANALYSIS BY TECHNOLOGY
      46. | 6.46 INDIA MARKET ANALYSIS BY METHOD
      47. | 6.47 INDIA MARKET ANALYSIS BY MATERIAL TYPE
      48. | 6.48 INDIA MARKET ANALYSIS BY END USE
      49. | 6.49 JAPAN MARKET ANALYSIS BY TECHNOLOGY
      50. | 6.50 JAPAN MARKET ANALYSIS BY METHOD
      51. | 6.51 JAPAN MARKET ANALYSIS BY MATERIAL TYPE
      52. | 6.52 JAPAN MARKET ANALYSIS BY END USE
      53. | 6.53 SOUTH KOREA MARKET ANALYSIS BY TECHNOLOGY
      54. | 6.54 SOUTH KOREA MARKET ANALYSIS BY METHOD
      55. | 6.55 SOUTH KOREA MARKET ANALYSIS BY MATERIAL TYPE
      56. | 6.56 SOUTH KOREA MARKET ANALYSIS BY END USE
      57. | 6.57 MALAYSIA MARKET ANALYSIS BY TECHNOLOGY
      58. | 6.58 MALAYSIA MARKET ANALYSIS BY METHOD
      59. | 6.59 MALAYSIA MARKET ANALYSIS BY MATERIAL TYPE
      60. | 6.60 MALAYSIA MARKET ANALYSIS BY END USE
      61. | 6.61 THAILAND MARKET ANALYSIS BY TECHNOLOGY
      62. | 6.62 THAILAND MARKET ANALYSIS BY METHOD
      63. | 6.63 THAILAND MARKET ANALYSIS BY MATERIAL TYPE
      64. | 6.64 THAILAND MARKET ANALYSIS BY END USE
      65. | 6.65 INDONESIA MARKET ANALYSIS BY TECHNOLOGY
      66. | 6.66 INDONESIA MARKET ANALYSIS BY METHOD
      67. | 6.67 INDONESIA MARKET ANALYSIS BY MATERIAL TYPE
      68. | 6.68 INDONESIA MARKET ANALYSIS BY END USE
      69. | 6.69 REST OF APAC MARKET ANALYSIS BY TECHNOLOGY
      70. | 6.70 REST OF APAC MARKET ANALYSIS BY METHOD
      71. | 6.71 REST OF APAC MARKET ANALYSIS BY MATERIAL TYPE
      72. | 6.72 REST OF APAC MARKET ANALYSIS BY END USE
      73. | 6.73 SOUTH AMERICA MARKET ANALYSIS
      74. | 6.74 BRAZIL MARKET ANALYSIS BY TECHNOLOGY
      75. | 6.75 BRAZIL MARKET ANALYSIS BY METHOD
      76. | 6.76 BRAZIL MARKET ANALYSIS BY MATERIAL TYPE
      77. | 6.77 BRAZIL MARKET ANALYSIS BY END USE
      78. | 6.78 MEXICO MARKET ANALYSIS BY TECHNOLOGY
      79. | 6.79 MEXICO MARKET ANALYSIS BY METHOD
      80. | 6.80 MEXICO MARKET ANALYSIS BY MATERIAL TYPE
      81. | 6.81 MEXICO MARKET ANALYSIS BY END USE
      82. | 6.82 ARGENTINA MARKET ANALYSIS BY TECHNOLOGY
      83. | 6.83 ARGENTINA MARKET ANALYSIS BY METHOD
      84. | 6.84 ARGENTINA MARKET ANALYSIS BY MATERIAL TYPE
      85. | 6.85 ARGENTINA MARKET ANALYSIS BY END USE
      86. | 6.86 REST OF SOUTH AMERICA MARKET ANALYSIS BY TECHNOLOGY
      87. | 6.87 REST OF SOUTH AMERICA MARKET ANALYSIS BY METHOD
      88. | 6.88 REST OF SOUTH AMERICA MARKET ANALYSIS BY MATERIAL TYPE
      89. | 6.89 REST OF SOUTH AMERICA MARKET ANALYSIS BY END USE
      90. | 6.90 MEA MARKET ANALYSIS
      91. | 6.91 GCC COUNTRIES MARKET ANALYSIS BY TECHNOLOGY
      92. | 6.92 GCC COUNTRIES MARKET ANALYSIS BY METHOD
      93. | 6.93 GCC COUNTRIES MARKET ANALYSIS BY MATERIAL TYPE
      94. | 6.94 GCC COUNTRIES MARKET ANALYSIS BY END USE
      95. | 6.95 SOUTH AFRICA MARKET ANALYSIS BY TECHNOLOGY
      96. | 6.96 SOUTH AFRICA MARKET ANALYSIS BY METHOD
      97. | 6.97 SOUTH AFRICA MARKET ANALYSIS BY MATERIAL TYPE
      98. | 6.98 SOUTH AFRICA MARKET ANALYSIS BY END USE
      99. | 6.99 REST OF MEA MARKET ANALYSIS BY TECHNOLOGY
      100. | 6.100 REST OF MEA MARKET ANALYSIS BY METHOD
      101. | 6.101 REST OF MEA MARKET ANALYSIS BY MATERIAL TYPE
      102. | 6.102 REST OF MEA MARKET ANALYSIS BY END USE
      103. | 6.103 KEY BUYING CRITERIA OF CHEMICALS AND MATERIALS
      104. | 6.104 RESEARCH PROCESS OF MRFR
      105. | 6.105 DRO ANALYSIS OF CHEMICALS AND MATERIALS
      106. | 6.106 DRIVERS IMPACT ANALYSIS: CHEMICALS AND MATERIALS
      107. | 6.107 RESTRAINTS IMPACT ANALYSIS: CHEMICALS AND MATERIALS
      108. | 6.108 SUPPLY / VALUE CHAIN: CHEMICALS AND MATERIALS
      109. | 6.109 CHEMICALS AND MATERIALS, BY TECHNOLOGY, 2024 (% SHARE)
      110. | 6.110 CHEMICALS AND MATERIALS, BY TECHNOLOGY, 2024 TO 2035 (USD Billion)
      111. | 6.111 CHEMICALS AND MATERIALS, BY METHOD, 2024 (% SHARE)
      112. | 6.112 CHEMICALS AND MATERIALS, BY METHOD, 2024 TO 2035 (USD Billion)
      113. | 6.113 CHEMICALS AND MATERIALS, BY MATERIAL TYPE, 2024 (% SHARE)
      114. | 6.114 CHEMICALS AND MATERIALS, BY MATERIAL TYPE, 2024 TO 2035 (USD Billion)
      115. | 6.115 CHEMICALS AND MATERIALS, BY END USE, 2024 (% SHARE)
      116. | 6.116 CHEMICALS AND MATERIALS, BY END USE, 2024 TO 2035 (USD Billion)
      117. | 6.117 BENCHMARKING OF MAJOR COMPETITORS
    7. LIST OF TABLES
      1. | 7.1 LIST OF ASSUMPTIONS
      2. | | 7.1.1
      3. | 7.2 North America MARKET SIZE ESTIMATES; FORECAST
      4. | | 7.2.1 BY TECHNOLOGY, 2025-2035 (USD Billion)
      5. | | 7.2.2 BY METHOD, 2025-2035 (USD Billion)
      6. | | 7.2.3 BY MATERIAL TYPE, 2025-2035 (USD Billion)
      7. | | 7.2.4 BY END USE, 2025-2035 (USD Billion)
      8. | 7.3 US MARKET SIZE ESTIMATES; FORECAST
      9. | | 7.3.1 BY TECHNOLOGY, 2025-2035 (USD Billion)
      10. | | 7.3.2 BY METHOD, 2025-2035 (USD Billion)
      11. | | 7.3.3 BY MATERIAL TYPE, 2025-2035 (USD Billion)
      12. | | 7.3.4 BY END USE, 2025-2035 (USD Billion)
      13. | 7.4 Canada MARKET SIZE ESTIMATES; FORECAST
      14. | | 7.4.1 BY TECHNOLOGY, 2025-2035 (USD Billion)
      15. | | 7.4.2 BY METHOD, 2025-2035 (USD Billion)
      16. | | 7.4.3 BY MATERIAL TYPE, 2025-2035 (USD Billion)
      17. | | 7.4.4 BY END USE, 2025-2035 (USD Billion)
      18. | 7.5 Europe MARKET SIZE ESTIMATES; FORECAST
      19. | | 7.5.1 BY TECHNOLOGY, 2025-2035 (USD Billion)
      20. | | 7.5.2 BY METHOD, 2025-2035 (USD Billion)
      21. | | 7.5.3 BY MATERIAL TYPE, 2025-2035 (USD Billion)
      22. | | 7.5.4 BY END USE, 2025-2035 (USD Billion)
      23. | 7.6 Germany MARKET SIZE ESTIMATES; FORECAST
      24. | | 7.6.1 BY TECHNOLOGY, 2025-2035 (USD Billion)
      25. | | 7.6.2 BY METHOD, 2025-2035 (USD Billion)
      26. | | 7.6.3 BY MATERIAL TYPE, 2025-2035 (USD Billion)
      27. | | 7.6.4 BY END USE, 2025-2035 (USD Billion)
      28. | 7.7 UK MARKET SIZE ESTIMATES; FORECAST
      29. | | 7.7.1 BY TECHNOLOGY, 2025-2035 (USD Billion)
      30. | | 7.7.2 BY METHOD, 2025-2035 (USD Billion)
      31. | | 7.7.3 BY MATERIAL TYPE, 2025-2035 (USD Billion)
      32. | | 7.7.4 BY END USE, 2025-2035 (USD Billion)
      33. | 7.8 France MARKET SIZE ESTIMATES; FORECAST
      34. | | 7.8.1 BY TECHNOLOGY, 2025-2035 (USD Billion)
      35. | | 7.8.2 BY METHOD, 2025-2035 (USD Billion)
      36. | | 7.8.3 BY MATERIAL TYPE, 2025-2035 (USD Billion)
      37. | | 7.8.4 BY END USE, 2025-2035 (USD Billion)
      38. | 7.9 Russia MARKET SIZE ESTIMATES; FORECAST
      39. | | 7.9.1 BY TECHNOLOGY, 2025-2035 (USD Billion)
      40. | | 7.9.2 BY METHOD, 2025-2035 (USD Billion)
      41. | | 7.9.3 BY MATERIAL TYPE, 2025-2035 (USD Billion)
      42. | | 7.9.4 BY END USE, 2025-2035 (USD Billion)
      43. | 7.10 Italy MARKET SIZE ESTIMATES; FORECAST
      44. | | 7.10.1 BY TECHNOLOGY, 2025-2035 (USD Billion)
      45. | | 7.10.2 BY METHOD, 2025-2035 (USD Billion)
      46. | | 7.10.3 BY MATERIAL TYPE, 2025-2035 (USD Billion)
      47. | | 7.10.4 BY END USE, 2025-2035 (USD Billion)
      48. | 7.11 Spain MARKET SIZE ESTIMATES; FORECAST
      49. | | 7.11.1 BY TECHNOLOGY, 2025-2035 (USD Billion)
      50. | | 7.11.2 BY METHOD, 2025-2035 (USD Billion)
      51. | | 7.11.3 BY MATERIAL TYPE, 2025-2035 (USD Billion)
      52. | | 7.11.4 BY END USE, 2025-2035 (USD Billion)
      53. | 7.12 Rest of Europe MARKET SIZE ESTIMATES; FORECAST
      54. | | 7.12.1 BY TECHNOLOGY, 2025-2035 (USD Billion)
      55. | | 7.12.2 BY METHOD, 2025-2035 (USD Billion)
      56. | | 7.12.3 BY MATERIAL TYPE, 2025-2035 (USD Billion)
      57. | | 7.12.4 BY END USE, 2025-2035 (USD Billion)
      58. | 7.13 APAC MARKET SIZE ESTIMATES; FORECAST
      59. | | 7.13.1 BY TECHNOLOGY, 2025-2035 (USD Billion)
      60. | | 7.13.2 BY METHOD, 2025-2035 (USD Billion)
      61. | | 7.13.3 BY MATERIAL TYPE, 2025-2035 (USD Billion)
      62. | | 7.13.4 BY END USE, 2025-2035 (USD Billion)
      63. | 7.14 China MARKET SIZE ESTIMATES; FORECAST
      64. | | 7.14.1 BY TECHNOLOGY, 2025-2035 (USD Billion)
      65. | | 7.14.2 BY METHOD, 2025-2035 (USD Billion)
      66. | | 7.14.3 BY MATERIAL TYPE, 2025-2035 (USD Billion)
      67. | | 7.14.4 BY END USE, 2025-2035 (USD Billion)
      68. | 7.15 India MARKET SIZE ESTIMATES; FORECAST
      69. | | 7.15.1 BY TECHNOLOGY, 2025-2035 (USD Billion)
      70. | | 7.15.2 BY METHOD, 2025-2035 (USD Billion)
      71. | | 7.15.3 BY MATERIAL TYPE, 2025-2035 (USD Billion)
      72. | | 7.15.4 BY END USE, 2025-2035 (USD Billion)
      73. | 7.16 Japan MARKET SIZE ESTIMATES; FORECAST
      74. | | 7.16.1 BY TECHNOLOGY, 2025-2035 (USD Billion)
      75. | | 7.16.2 BY METHOD, 2025-2035 (USD Billion)
      76. | | 7.16.3 BY MATERIAL TYPE, 2025-2035 (USD Billion)
      77. | | 7.16.4 BY END USE, 2025-2035 (USD Billion)
      78. | 7.17 South Korea MARKET SIZE ESTIMATES; FORECAST
      79. | | 7.17.1 BY TECHNOLOGY, 2025-2035 (USD Billion)
      80. | | 7.17.2 BY METHOD, 2025-2035 (USD Billion)
      81. | | 7.17.3 BY MATERIAL TYPE, 2025-2035 (USD Billion)
      82. | | 7.17.4 BY END USE, 2025-2035 (USD Billion)
      83. | 7.18 Malaysia MARKET SIZE ESTIMATES; FORECAST
      84. | | 7.18.1 BY TECHNOLOGY, 2025-2035 (USD Billion)
      85. | | 7.18.2 BY METHOD, 2025-2035 (USD Billion)
      86. | | 7.18.3 BY MATERIAL TYPE, 2025-2035 (USD Billion)
      87. | | 7.18.4 BY END USE, 2025-2035 (USD Billion)
      88. | 7.19 Thailand MARKET SIZE ESTIMATES; FORECAST
      89. | | 7.19.1 BY TECHNOLOGY, 2025-2035 (USD Billion)
      90. | | 7.19.2 BY METHOD, 2025-2035 (USD Billion)
      91. | | 7.19.3 BY MATERIAL TYPE, 2025-2035 (USD Billion)
      92. | | 7.19.4 BY END USE, 2025-2035 (USD Billion)
      93. | 7.20 Indonesia MARKET SIZE ESTIMATES; FORECAST
      94. | | 7.20.1 BY TECHNOLOGY, 2025-2035 (USD Billion)
      95. | | 7.20.2 BY METHOD, 2025-2035 (USD Billion)
      96. | | 7.20.3 BY MATERIAL TYPE, 2025-2035 (USD Billion)
      97. | | 7.20.4 BY END USE, 2025-2035 (USD Billion)
      98. | 7.21 Rest of APAC MARKET SIZE ESTIMATES; FORECAST
      99. | | 7.21.1 BY TECHNOLOGY, 2025-2035 (USD Billion)
      100. | | 7.21.2 BY METHOD, 2025-2035 (USD Billion)
      101. | | 7.21.3 BY MATERIAL TYPE, 2025-2035 (USD Billion)
      102. | | 7.21.4 BY END USE, 2025-2035 (USD Billion)
      103. | 7.22 South America MARKET SIZE ESTIMATES; FORECAST
      104. | | 7.22.1 BY TECHNOLOGY, 2025-2035 (USD Billion)
      105. | | 7.22.2 BY METHOD, 2025-2035 (USD Billion)
      106. | | 7.22.3 BY MATERIAL TYPE, 2025-2035 (USD Billion)
      107. | | 7.22.4 BY END USE, 2025-2035 (USD Billion)
      108. | 7.23 Brazil MARKET SIZE ESTIMATES; FORECAST
      109. | | 7.23.1 BY TECHNOLOGY, 2025-2035 (USD Billion)
      110. | | 7.23.2 BY METHOD, 2025-2035 (USD Billion)
      111. | | 7.23.3 BY MATERIAL TYPE, 2025-2035 (USD Billion)
      112. | | 7.23.4 BY END USE, 2025-2035 (USD Billion)
      113. | 7.24 Mexico MARKET SIZE ESTIMATES; FORECAST
      114. | | 7.24.1 BY TECHNOLOGY, 2025-2035 (USD Billion)
      115. | | 7.24.2 BY METHOD, 2025-2035 (USD Billion)
      116. | | 7.24.3 BY MATERIAL TYPE, 2025-2035 (USD Billion)
      117. | | 7.24.4 BY END USE, 2025-2035 (USD Billion)
      118. | 7.25 Argentina MARKET SIZE ESTIMATES; FORECAST
      119. | | 7.25.1 BY TECHNOLOGY, 2025-2035 (USD Billion)
      120. | | 7.25.2 BY METHOD, 2025-2035 (USD Billion)
      121. | | 7.25.3 BY MATERIAL TYPE, 2025-2035 (USD Billion)
      122. | | 7.25.4 BY END USE, 2025-2035 (USD Billion)
      123. | 7.26 Rest of South America MARKET SIZE ESTIMATES; FORECAST
      124. | | 7.26.1 BY TECHNOLOGY, 2025-2035 (USD Billion)
      125. | | 7.26.2 BY METHOD, 2025-2035 (USD Billion)
      126. | | 7.26.3 BY MATERIAL TYPE, 2025-2035 (USD Billion)
      127. | | 7.26.4 BY END USE, 2025-2035 (USD Billion)
      128. | 7.27 MEA MARKET SIZE ESTIMATES; FORECAST
      129. | | 7.27.1 BY TECHNOLOGY, 2025-2035 (USD Billion)
      130. | | 7.27.2 BY METHOD, 2025-2035 (USD Billion)
      131. | | 7.27.3 BY MATERIAL TYPE, 2025-2035 (USD Billion)
      132. | | 7.27.4 BY END USE, 2025-2035 (USD Billion)
      133. | 7.28 GCC Countries MARKET SIZE ESTIMATES; FORECAST
      134. | | 7.28.1 BY TECHNOLOGY, 2025-2035 (USD Billion)
      135. | | 7.28.2 BY METHOD, 2025-2035 (USD Billion)
      136. | | 7.28.3 BY MATERIAL TYPE, 2025-2035 (USD Billion)
      137. | | 7.28.4 BY END USE, 2025-2035 (USD Billion)
      138. | 7.29 South Africa MARKET SIZE ESTIMATES; FORECAST
      139. | | 7.29.1 BY TECHNOLOGY, 2025-2035 (USD Billion)
      140. | | 7.29.2 BY METHOD, 2025-2035 (USD Billion)
      141. | | 7.29.3 BY MATERIAL TYPE, 2025-2035 (USD Billion)
      142. | | 7.29.4 BY END USE, 2025-2035 (USD Billion)
      143. | 7.30 Rest of MEA MARKET SIZE ESTIMATES; FORECAST
      144. | | 7.30.1 BY TECHNOLOGY, 2025-2035 (USD Billion)
      145. | | 7.30.2 BY METHOD, 2025-2035 (USD Billion)
      146. | | 7.30.3 BY MATERIAL TYPE, 2025-2035 (USD Billion)
      147. | | 7.30.4 BY END USE, 2025-2035 (USD Billion)
      148. | 7.31 PRODUCT LAUNCH/PRODUCT DEVELOPMENT/APPROVAL
      149. | | 7.31.1
      150. | 7.32 ACQUISITION/PARTNERSHIP
      151. | | 7.32.1

    Green Mining Market Segmentation

    • Green Mining Market By Technology (USD Billion, 2019-2035)

      • Biomining
      • Hydrometallurgy
      • Recycling
      • Electromagnetic Separation
    • Green Mining Market By Method (USD Billion, 2019-2035)

      • Open-Pit Mining
      • Underground Mining
      • In-Situ Mining
    • Green Mining Market By Material Type (USD Billion, 2019-2035)

      • Precious Metals
      • Base Metals
      • Rare Earth Elements
      • Industrial Minerals
    • Green Mining Market By End Use (USD Billion, 2019-2035)

      • Construction
      • Electronics
      • Automotive
      • Energy
    • Green Mining Market By Regional (USD Billion, 2019-2035)

      • North America
      • Europe
      • South America
      • Asia Pacific
      • Middle East and Africa

    Green Mining Market Regional Outlook (USD Billion, 2019-2035)

    • North America Outlook (USD Billion, 2019-2035)

      • North America Green Mining Market by Technology Type

        • Biomining
        • Hydrometallurgy
        • Recycling
        • Electromagnetic Separation
      • North America Green Mining Market by Method Type

        • Open-Pit Mining
        • Underground Mining
        • In-Situ Mining
      • North America Green Mining Market by Material Type

        • Precious Metals
        • Base Metals
        • Rare Earth Elements
        • Industrial Minerals
      • North America Green Mining Market by End Use Type

        • Construction
        • Electronics
        • Automotive
        • Energy
      • North America Green Mining Market by Regional Type

        • US
        • Canada
      • US Outlook (USD Billion, 2019-2035)
      • US Green Mining Market by Technology Type

        • Biomining
        • Hydrometallurgy
        • Recycling
        • Electromagnetic Separation
      • US Green Mining Market by Method Type

        • Open-Pit Mining
        • Underground Mining
        • In-Situ Mining
      • US Green Mining Market by Material Type

        • Precious Metals
        • Base Metals
        • Rare Earth Elements
        • Industrial Minerals
      • US Green Mining Market by End Use Type

        • Construction
        • Electronics
        • Automotive
        • Energy
      • CANADA Outlook (USD Billion, 2019-2035)
      • CANADA Green Mining Market by Technology Type

        • Biomining
        • Hydrometallurgy
        • Recycling
        • Electromagnetic Separation
      • CANADA Green Mining Market by Method Type

        • Open-Pit Mining
        • Underground Mining
        • In-Situ Mining
      • CANADA Green Mining Market by Material Type

        • Precious Metals
        • Base Metals
        • Rare Earth Elements
        • Industrial Minerals
      • CANADA Green Mining Market by End Use Type

        • Construction
        • Electronics
        • Automotive
        • Energy
    • Europe Outlook (USD Billion, 2019-2035)

      • Europe Green Mining Market by Technology Type

        • Biomining
        • Hydrometallurgy
        • Recycling
        • Electromagnetic Separation
      • Europe Green Mining Market by Method Type

        • Open-Pit Mining
        • Underground Mining
        • In-Situ Mining
      • Europe Green Mining Market by Material Type

        • Precious Metals
        • Base Metals
        • Rare Earth Elements
        • Industrial Minerals
      • Europe Green Mining Market by End Use Type

        • Construction
        • Electronics
        • Automotive
        • Energy
      • Europe Green Mining Market by Regional Type

        • Germany
        • UK
        • France
        • Russia
        • Italy
        • Spain
        • Rest of Europe
      • GERMANY Outlook (USD Billion, 2019-2035)
      • GERMANY Green Mining Market by Technology Type

        • Biomining
        • Hydrometallurgy
        • Recycling
        • Electromagnetic Separation
      • GERMANY Green Mining Market by Method Type

        • Open-Pit Mining
        • Underground Mining
        • In-Situ Mining
      • GERMANY Green Mining Market by Material Type

        • Precious Metals
        • Base Metals
        • Rare Earth Elements
        • Industrial Minerals
      • GERMANY Green Mining Market by End Use Type

        • Construction
        • Electronics
        • Automotive
        • Energy
      • UK Outlook (USD Billion, 2019-2035)
      • UK Green Mining Market by Technology Type

        • Biomining
        • Hydrometallurgy
        • Recycling
        • Electromagnetic Separation
      • UK Green Mining Market by Method Type

        • Open-Pit Mining
        • Underground Mining
        • In-Situ Mining
      • UK Green Mining Market by Material Type

        • Precious Metals
        • Base Metals
        • Rare Earth Elements
        • Industrial Minerals
      • UK Green Mining Market by End Use Type

        • Construction
        • Electronics
        • Automotive
        • Energy
      • FRANCE Outlook (USD Billion, 2019-2035)
      • FRANCE Green Mining Market by Technology Type

        • Biomining
        • Hydrometallurgy
        • Recycling
        • Electromagnetic Separation
      • FRANCE Green Mining Market by Method Type

        • Open-Pit Mining
        • Underground Mining
        • In-Situ Mining
      • FRANCE Green Mining Market by Material Type

        • Precious Metals
        • Base Metals
        • Rare Earth Elements
        • Industrial Minerals
      • FRANCE Green Mining Market by End Use Type

        • Construction
        • Electronics
        • Automotive
        • Energy
      • RUSSIA Outlook (USD Billion, 2019-2035)
      • RUSSIA Green Mining Market by Technology Type

        • Biomining
        • Hydrometallurgy
        • Recycling
        • Electromagnetic Separation
      • RUSSIA Green Mining Market by Method Type

        • Open-Pit Mining
        • Underground Mining
        • In-Situ Mining
      • RUSSIA Green Mining Market by Material Type

        • Precious Metals
        • Base Metals
        • Rare Earth Elements
        • Industrial Minerals
      • RUSSIA Green Mining Market by End Use Type

        • Construction
        • Electronics
        • Automotive
        • Energy
      • ITALY Outlook (USD Billion, 2019-2035)
      • ITALY Green Mining Market by Technology Type

        • Biomining
        • Hydrometallurgy
        • Recycling
        • Electromagnetic Separation
      • ITALY Green Mining Market by Method Type

        • Open-Pit Mining
        • Underground Mining
        • In-Situ Mining
      • ITALY Green Mining Market by Material Type

        • Precious Metals
        • Base Metals
        • Rare Earth Elements
        • Industrial Minerals
      • ITALY Green Mining Market by End Use Type

        • Construction
        • Electronics
        • Automotive
        • Energy
      • SPAIN Outlook (USD Billion, 2019-2035)
      • SPAIN Green Mining Market by Technology Type

        • Biomining
        • Hydrometallurgy
        • Recycling
        • Electromagnetic Separation
      • SPAIN Green Mining Market by Method Type

        • Open-Pit Mining
        • Underground Mining
        • In-Situ Mining
      • SPAIN Green Mining Market by Material Type

        • Precious Metals
        • Base Metals
        • Rare Earth Elements
        • Industrial Minerals
      • SPAIN Green Mining Market by End Use Type

        • Construction
        • Electronics
        • Automotive
        • Energy
      • REST OF EUROPE Outlook (USD Billion, 2019-2035)
      • REST OF EUROPE Green Mining Market by Technology Type

        • Biomining
        • Hydrometallurgy
        • Recycling
        • Electromagnetic Separation
      • REST OF EUROPE Green Mining Market by Method Type

        • Open-Pit Mining
        • Underground Mining
        • In-Situ Mining
      • REST OF EUROPE Green Mining Market by Material Type

        • Precious Metals
        • Base Metals
        • Rare Earth Elements
        • Industrial Minerals
      • REST OF EUROPE Green Mining Market by End Use Type

        • Construction
        • Electronics
        • Automotive
        • Energy
    • APAC Outlook (USD Billion, 2019-2035)

      • APAC Green Mining Market by Technology Type

        • Biomining
        • Hydrometallurgy
        • Recycling
        • Electromagnetic Separation
      • APAC Green Mining Market by Method Type

        • Open-Pit Mining
        • Underground Mining
        • In-Situ Mining
      • APAC Green Mining Market by Material Type

        • Precious Metals
        • Base Metals
        • Rare Earth Elements
        • Industrial Minerals
      • APAC Green Mining Market by End Use Type

        • Construction
        • Electronics
        • Automotive
        • Energy
      • APAC Green Mining Market by Regional Type

        • China
        • India
        • Japan
        • South Korea
        • Malaysia
        • Thailand
        • Indonesia
        • Rest of APAC
      • CHINA Outlook (USD Billion, 2019-2035)
      • CHINA Green Mining Market by Technology Type

        • Biomining
        • Hydrometallurgy
        • Recycling
        • Electromagnetic Separation
      • CHINA Green Mining Market by Method Type

        • Open-Pit Mining
        • Underground Mining
        • In-Situ Mining
      • CHINA Green Mining Market by Material Type

        • Precious Metals
        • Base Metals
        • Rare Earth Elements
        • Industrial Minerals
      • CHINA Green Mining Market by End Use Type

        • Construction
        • Electronics
        • Automotive
        • Energy
      • INDIA Outlook (USD Billion, 2019-2035)
      • INDIA Green Mining Market by Technology Type

        • Biomining
        • Hydrometallurgy
        • Recycling
        • Electromagnetic Separation
      • INDIA Green Mining Market by Method Type

        • Open-Pit Mining
        • Underground Mining
        • In-Situ Mining
      • INDIA Green Mining Market by Material Type

        • Precious Metals
        • Base Metals
        • Rare Earth Elements
        • Industrial Minerals
      • INDIA Green Mining Market by End Use Type

        • Construction
        • Electronics
        • Automotive
        • Energy
      • JAPAN Outlook (USD Billion, 2019-2035)
      • JAPAN Green Mining Market by Technology Type

        • Biomining
        • Hydrometallurgy
        • Recycling
        • Electromagnetic Separation
      • JAPAN Green Mining Market by Method Type

        • Open-Pit Mining
        • Underground Mining
        • In-Situ Mining
      • JAPAN Green Mining Market by Material Type

        • Precious Metals
        • Base Metals
        • Rare Earth Elements
        • Industrial Minerals
      • JAPAN Green Mining Market by End Use Type

        • Construction
        • Electronics
        • Automotive
        • Energy
      • SOUTH KOREA Outlook (USD Billion, 2019-2035)
      • SOUTH KOREA Green Mining Market by Technology Type

        • Biomining
        • Hydrometallurgy
        • Recycling
        • Electromagnetic Separation
      • SOUTH KOREA Green Mining Market by Method Type

        • Open-Pit Mining
        • Underground Mining
        • In-Situ Mining
      • SOUTH KOREA Green Mining Market by Material Type

        • Precious Metals
        • Base Metals
        • Rare Earth Elements
        • Industrial Minerals
      • SOUTH KOREA Green Mining Market by End Use Type

        • Construction
        • Electronics
        • Automotive
        • Energy
      • MALAYSIA Outlook (USD Billion, 2019-2035)
      • MALAYSIA Green Mining Market by Technology Type

        • Biomining
        • Hydrometallurgy
        • Recycling
        • Electromagnetic Separation
      • MALAYSIA Green Mining Market by Method Type

        • Open-Pit Mining
        • Underground Mining
        • In-Situ Mining
      • MALAYSIA Green Mining Market by Material Type

        • Precious Metals
        • Base Metals
        • Rare Earth Elements
        • Industrial Minerals
      • MALAYSIA Green Mining Market by End Use Type

        • Construction
        • Electronics
        • Automotive
        • Energy
      • THAILAND Outlook (USD Billion, 2019-2035)
      • THAILAND Green Mining Market by Technology Type

        • Biomining
        • Hydrometallurgy
        • Recycling
        • Electromagnetic Separation
      • THAILAND Green Mining Market by Method Type

        • Open-Pit Mining
        • Underground Mining
        • In-Situ Mining
      • THAILAND Green Mining Market by Material Type

        • Precious Metals
        • Base Metals
        • Rare Earth Elements
        • Industrial Minerals
      • THAILAND Green Mining Market by End Use Type

        • Construction
        • Electronics
        • Automotive
        • Energy
      • INDONESIA Outlook (USD Billion, 2019-2035)
      • INDONESIA Green Mining Market by Technology Type

        • Biomining
        • Hydrometallurgy
        • Recycling
        • Electromagnetic Separation
      • INDONESIA Green Mining Market by Method Type

        • Open-Pit Mining
        • Underground Mining
        • In-Situ Mining
      • INDONESIA Green Mining Market by Material Type

        • Precious Metals
        • Base Metals
        • Rare Earth Elements
        • Industrial Minerals
      • INDONESIA Green Mining Market by End Use Type

        • Construction
        • Electronics
        • Automotive
        • Energy
      • REST OF APAC Outlook (USD Billion, 2019-2035)
      • REST OF APAC Green Mining Market by Technology Type

        • Biomining
        • Hydrometallurgy
        • Recycling
        • Electromagnetic Separation
      • REST OF APAC Green Mining Market by Method Type

        • Open-Pit Mining
        • Underground Mining
        • In-Situ Mining
      • REST OF APAC Green Mining Market by Material Type

        • Precious Metals
        • Base Metals
        • Rare Earth Elements
        • Industrial Minerals
      • REST OF APAC Green Mining Market by End Use Type

        • Construction
        • Electronics
        • Automotive
        • Energy
    • South America Outlook (USD Billion, 2019-2035)

      • South America Green Mining Market by Technology Type

        • Biomining
        • Hydrometallurgy
        • Recycling
        • Electromagnetic Separation
      • South America Green Mining Market by Method Type

        • Open-Pit Mining
        • Underground Mining
        • In-Situ Mining
      • South America Green Mining Market by Material Type

        • Precious Metals
        • Base Metals
        • Rare Earth Elements
        • Industrial Minerals
      • South America Green Mining Market by End Use Type

        • Construction
        • Electronics
        • Automotive
        • Energy
      • South America Green Mining Market by Regional Type

        • Brazil
        • Mexico
        • Argentina
        • Rest of South America
      • BRAZIL Outlook (USD Billion, 2019-2035)
      • BRAZIL Green Mining Market by Technology Type

        • Biomining
        • Hydrometallurgy
        • Recycling
        • Electromagnetic Separation
      • BRAZIL Green Mining Market by Method Type

        • Open-Pit Mining
        • Underground Mining
        • In-Situ Mining
      • BRAZIL Green Mining Market by Material Type

        • Precious Metals
        • Base Metals
        • Rare Earth Elements
        • Industrial Minerals
      • BRAZIL Green Mining Market by End Use Type

        • Construction
        • Electronics
        • Automotive
        • Energy
      • MEXICO Outlook (USD Billion, 2019-2035)
      • MEXICO Green Mining Market by Technology Type

        • Biomining
        • Hydrometallurgy
        • Recycling
        • Electromagnetic Separation
      • MEXICO Green Mining Market by Method Type

        • Open-Pit Mining
        • Underground Mining
        • In-Situ Mining
      • MEXICO Green Mining Market by Material Type

        • Precious Metals
        • Base Metals
        • Rare Earth Elements
        • Industrial Minerals
      • MEXICO Green Mining Market by End Use Type

        • Construction
        • Electronics
        • Automotive
        • Energy
      • ARGENTINA Outlook (USD Billion, 2019-2035)
      • ARGENTINA Green Mining Market by Technology Type

        • Biomining
        • Hydrometallurgy
        • Recycling
        • Electromagnetic Separation
      • ARGENTINA Green Mining Market by Method Type

        • Open-Pit Mining
        • Underground Mining
        • In-Situ Mining
      • ARGENTINA Green Mining Market by Material Type

        • Precious Metals
        • Base Metals
        • Rare Earth Elements
        • Industrial Minerals
      • ARGENTINA Green Mining Market by End Use Type

        • Construction
        • Electronics
        • Automotive
        • Energy
      • REST OF SOUTH AMERICA Outlook (USD Billion, 2019-2035)
      • REST OF SOUTH AMERICA Green Mining Market by Technology Type

        • Biomining
        • Hydrometallurgy
        • Recycling
        • Electromagnetic Separation
      • REST OF SOUTH AMERICA Green Mining Market by Method Type

        • Open-Pit Mining
        • Underground Mining
        • In-Situ Mining
      • REST OF SOUTH AMERICA Green Mining Market by Material Type

        • Precious Metals
        • Base Metals
        • Rare Earth Elements
        • Industrial Minerals
      • REST OF SOUTH AMERICA Green Mining Market by End Use Type

        • Construction
        • Electronics
        • Automotive
        • Energy
    • MEA Outlook (USD Billion, 2019-2035)

      • MEA Green Mining Market by Technology Type

        • Biomining
        • Hydrometallurgy
        • Recycling
        • Electromagnetic Separation
      • MEA Green Mining Market by Method Type

        • Open-Pit Mining
        • Underground Mining
        • In-Situ Mining
      • MEA Green Mining Market by Material Type

        • Precious Metals
        • Base Metals
        • Rare Earth Elements
        • Industrial Minerals
      • MEA Green Mining Market by End Use Type

        • Construction
        • Electronics
        • Automotive
        • Energy
      • MEA Green Mining Market by Regional Type

        • GCC Countries
        • South Africa
        • Rest of MEA
      • GCC COUNTRIES Outlook (USD Billion, 2019-2035)
      • GCC COUNTRIES Green Mining Market by Technology Type

        • Biomining
        • Hydrometallurgy
        • Recycling
        • Electromagnetic Separation
      • GCC COUNTRIES Green Mining Market by Method Type

        • Open-Pit Mining
        • Underground Mining
        • In-Situ Mining
      • GCC COUNTRIES Green Mining Market by Material Type

        • Precious Metals
        • Base Metals
        • Rare Earth Elements
        • Industrial Minerals
      • GCC COUNTRIES Green Mining Market by End Use Type

        • Construction
        • Electronics
        • Automotive
        • Energy
      • SOUTH AFRICA Outlook (USD Billion, 2019-2035)
      • SOUTH AFRICA Green Mining Market by Technology Type

        • Biomining
        • Hydrometallurgy
        • Recycling
        • Electromagnetic Separation
      • SOUTH AFRICA Green Mining Market by Method Type

        • Open-Pit Mining
        • Underground Mining
        • In-Situ Mining
      • SOUTH AFRICA Green Mining Market by Material Type

        • Precious Metals
        • Base Metals
        • Rare Earth Elements
        • Industrial Minerals
      • SOUTH AFRICA Green Mining Market by End Use Type

        • Construction
        • Electronics
        • Automotive
        • Energy
      • REST OF MEA Outlook (USD Billion, 2019-2035)
      • REST OF MEA Green Mining Market by Technology Type

        • Biomining
        • Hydrometallurgy
        • Recycling
        • Electromagnetic Separation
      • REST OF MEA Green Mining Market by Method Type

        • Open-Pit Mining
        • Underground Mining
        • In-Situ Mining
      • REST OF MEA Green Mining Market by Material Type

        • Precious Metals
        • Base Metals
        • Rare Earth Elements
        • Industrial Minerals
      • REST OF MEA Green Mining Market by End Use Type

        • Construction
        • Electronics
        • Automotive
        • Energy
    Infographic

    Free Sample Request

    Kindly complete the form below to receive a free sample of this Report

    Get Free Sample

    Customer Strories

    “I am very pleased with how market segments have been defined in a relevant way for my purposes (such as "Portable Freezers & refrigerators" and "last-mile"). In general the report is well structured. Thanks very much for your efforts.”

    Victoria Milne

    Founder
    Case Study
    Chemicals and Materials

    Compare Licence

    ×
    Features License Type
    Single User Multiuser License Enterprise User
    Price $4,950 $5,950 $7,250
    Maximum User Access Limit 1 User Upto 10 Users Unrestricted Access Throughout the Organization
    Free Customization
    Direct Access to Analyst
    Deliverable Format
    Platform Access
    Discount on Next Purchase 10% 15% 15%
    Printable Versions