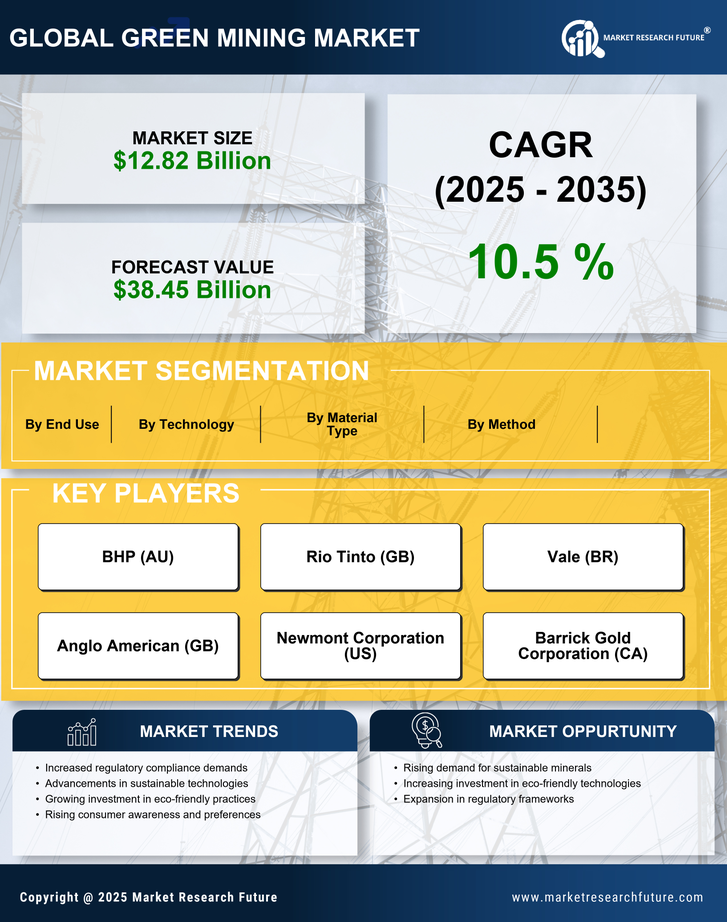
Certified Global Research Member
Isomar fd.webp Wcrc 57.webp
Key Questions Answered
  • Global Market Outlook
  • In-depth analysis of global and regional trends
  • Analyze and identify the major players in the market, their market share, key developments, etc.
  • To understand the capability of the major players based on products offered, financials, and strategies.
  • Identify disrupting products, companies, and trends.
  • To identify opportunities in the market.
  • Analyze the key challenges in the market.
  • Analyze the regional penetration of players, products, and services in the market.
  • Comparison of major players’ financial performance.
  • Evaluate strategies adopted by major players.
  • Recommendations
Why Choose Market Research Future?
  • Vigorous research methodologies for specific market.
  • Knowledge partners across the globe
  • Large network of partner consultants.
  • Ever-increasing/ Escalating data base with quarterly monitoring of various markets
  • Trusted by fortune 500 companies/startups/ universities/organizations
  • Large database of 5000+ markets reports.
  • Effective and prompt pre- and post-sales support.

Green Mining Market Research Report

Information By Type (Surface and Underground), By Technology (Power Reduction, Fuel and Maintenance Reduction, Emission Reduction, Water Reduction, and Others), and By Region (North America, Europe, Asia-Pacific, and Rest of The World) – Market Forecast Till 2032

ID: MRFR/CnM/9876-HCR | 128 Pages | Author: Priya Nagrale| April 2024

Green Mining Market Segmentation


Green Mining Type Outlook (USD Billion, 2018-2032)


  • Surface


  • Underground


Green Mining Technology Outlook (USD Billion, 2018-2032)


  • Power Reduction


  • Fuel and Maintenance Reduction


  • Emission Reduction


  • Water Reduction


  • Others


Green Mining Regional Outlook (USD Billion, 2018-2032)


  • North America Outlook (USD Billion, 2018-2032)


    • Green Mining by Type


      • Surface


      • Underground


    • Green Mining by Technology


      • Power Reduction


      • Fuel and Maintenance Reduction


      • Emission Reduction


      • Water Reduction


      • Others


    • US Outlook (USD Billion, 2018-2032)


    • Green Mining by Type


      • Surface


      • Underground


    • Green Mining by Technology


      • Power Reduction


      • Fuel and Maintenance Reduction


      • Emission Reduction


      • Water Reduction


      • Others


    • Canada Outlook (USD Billion, 2018-2032)


    • Green Mining by Type


      • Surface


      • Underground


    • Green Mining by Technology


      • Power Reduction


      • Fuel and Maintenance Reduction


      • Emission Reduction


      • Water Reduction


      • Others


  • Europe Outlook (USD Billion, 2018-2032)


    • Green Mining by Type


      • Surface


      • Underground


    • Green Mining by Technology


      • Power Reduction


      • Fuel and Maintenance Reduction


      • Emission Reduction


      • Water Reduction


      • Others


    • Germany Outlook (USD Billion, 2018-2032)


    • Green Mining by Type


      • Surface


      • Underground


    • Green Mining by Technology


      • Power Reduction


      • Fuel and Maintenance Reduction


      • Emission Reduction


      • Water Reduction


      • Others


    • France Outlook (USD Billion, 2018-2032)


    • Green Mining by Type


      • Surface


      • Underground


    • Green Mining by Technology


      • Power Reduction


      • Fuel and Maintenance Reduction


      • Emission Reduction


      • Water Reduction


      • Others


    • UK Outlook (USD Billion, 2018-2032)


    • Green Mining by Type


      • Surface


      • Underground


    • Green Mining by Technology


      • Power Reduction


      • Fuel and Maintenance Reduction


      • Emission Reduction


      • Water Reduction


      • Others


    • Italy Outlook (USD Billion, 2018-2032)


    • Green Mining by Type


      • Surface


      • Underground


    • Green Mining by Technology


      • Power Reduction


      • Fuel and Maintenance Reduction


      • Emission Reduction


      • Water Reduction


      • Others


    • Spain Outlook (USD Billion, 2018-2032)


    • Green Mining by Type


      • Surface


      • Underground


    • Green Mining by Technology


      • Power Reduction


      • Fuel and Maintenance Reduction


      • Emission Reduction


      • Water Reduction


      • Others


    • Rest Of Europe Outlook (USD Billion, 2018-2032)


    • Green Mining by Type


      • Surface


      • Underground


    • Green Mining by Technology


      • Power Reduction


      • Fuel and Maintenance Reduction


      • Emission Reduction


      • Water Reduction


      • Others


  • Asia-Pacific Outlook (USD Billion, 2018-2032)


    • Green Mining by Type


      • Surface


      • Underground


    • Green Mining by Technology


      • Power Reduction


      • Fuel and Maintenance Reduction


      • Emission Reduction


      • Water Reduction


      • Others


    • China Outlook (USD Billion, 2018-2032)


    • Green Mining by Type


      • Surface


      • Underground


    • Green Mining by Technology


      • Power Reduction


      • Fuel and Maintenance Reduction


      • Emission Reduction


      • Water Reduction


      • Others


    • Japan Outlook (USD Billion, 2018-2032)


    • Green Mining by Type


      • Surface


      • Underground


    • Green Mining by Technology


      • Power Reduction


      • Fuel and Maintenance Reduction


      • Emission Reduction


      • Water Reduction


      • Others


    • India Outlook (USD Billion, 2018-2032)


    • Green Mining by Type


      • Surface


      • Underground


    • Green Mining by Technology


      • Power Reduction


      • Fuel and Maintenance Reduction


      • Emission Reduction


      • Water Reduction


      • Others


    • Australia Outlook (USD Billion, 2018-2032)


    • Green Mining by Type


      • Surface


      • Underground


    • Green Mining by Technology


      • Power Reduction


      • Fuel and Maintenance Reduction


      • Emission Reduction


      • Water Reduction


      • Others


    • Rest of Asia-Pacific Outlook (USD Billion, 2018-2032)


    • Green Mining by Type


      • Surface


      • Underground


    • Green Mining by Technology


      • Power Reduction


      • Fuel and Maintenance Reduction


      • Emission Reduction


      • Water Reduction


      • Others


  • Rest of the World Outlook (USD Billion, 2018-2032)


    • Green Mining by Type


      • Surface


      • Underground


    • Green Mining by Technology


      • Power Reduction


      • Fuel and Maintenance Reduction


      • Emission Reduction


      • Water Reduction


      • Others


    • Middle East Outlook (USD Billion, 2018-2032)


    • Green Mining by Type


      • Surface


      • Underground


    • Green Mining by Technology


      • Power Reduction


      • Fuel and Maintenance Reduction


      • Emission Reduction


      • Water Reduction


      • Others


    • Africa Outlook (USD Billion, 2018-2032)


    • Green Mining by Type


      • Surface


      • Underground


    • Green Mining by Technology


      • Power Reduction


      • Fuel and Maintenance Reduction


      • Emission Reduction


      • Water Reduction


      • Others


    • Latin America Outlook (USD Billion, 2018-2032)


    • Green Mining by Type


      • Surface


      • Underground


    • Green Mining by Technology


      • Power Reduction


      • Fuel and Maintenance Reduction


      • Emission Reduction


      • Water Reduction


      • Others


Leading companies partner with us for data-driven Insights
client_1 client_2 client_3 client_4 client_5 client_6 client_7 client_8 client_9 client_10
Please fill in Business Email for Quick Response

TABLE OF CONTENTS

1. EXECUTIVE SUMMARY

2. MARKET INTRODUCTION

2.1. Definition

2.2. Scope of the Study

2.2.1. Research Objective

2.2.2. Assumptions

2.2.3. Limitations

3. RESEARCH METHODOLOGY

3.1. Overview

3.2. Data Mining

3.3. Secondary Research

3.4. Primary Research

3.4.1. Primary Interviews and Information Gathering Process

3.4.2. Breakdown of Primary Respondents

3.5. Forecasting Model

3.6. Market Size Estimation

3.6.1. Bottom-Up Approach

3.6.2. Top-Down Approach

3.7. Data Triangulation

3.8. Validation

4. MARKET DYNAMICS

4.1. Overview

4.2. Drivers

4.3. Restraints

4.4. Opportunities

5. MARKET FACTOR ANALYSIS

5.1. Value Chain Analysis

5.2. Porter’s Five Forces Analysis

5.2.1. Bargaining Power of Suppliers

5.2.2. Bargaining Power of Buyers

5.2.3. Threat of New Entrants

5.2.4. Threat of Substitutes

5.2.5. Intensity of Rivalry

5.3. COVID-19 Impact Analysis

5.3.1. Market Impact Analysis

5.3.2. Regional Impact

5.3.3. Opportunity and Threat Analysis

6. GLOBAL GREEN MINING MARKET, BY TYPE

6.1. Overview

6.2. Surface

6.3. Underground

7. GLOBAL GREEN MINING MARKET, BY TECHNOLOGY

7.1. Overview

7.2. Power Reduction

7.3. Fuel and Maintenace Reduction

7.4. Emission Reduction

7.5. Water Reduction

7.6. Others

8. GLOBAL GREEN MINING MARKET, BY REGION

8.1. Overview

8.2. North America

8.2.1. U.S.

8.2.2. Canada

8.3. Europe

8.3.1. Germany

8.3.2. France

8.3.3. U.K

8.3.4. Italy

8.3.5. Spain

8.3.6. Rest of Europe

8.4. Asia-Pacific

8.4.1. China

8.4.2. India

8.4.3. Japan

8.4.4. South Korea

8.4.5. Australia

8.4.6. Rest of Asia-Pacific

8.5. Rest of the World

8.5.1. Middle East

8.5.2. Africa

8.5.3. Latin America

9. COMPETITIVE LANDSCAPE

9.1. Overview

9.2. Competitive Analysis

9.3. Market Share Analysis

9.4. Major Growth Strategy in the Global Green Mining Market,

9.5. Competitive Benchmarking

9.6. Leading Players in Terms of Number of Developments in the Global Green Mining Market,

9.7. Key developments and Growth Strategies

9.7.1. New TYPE Launch/Technology Deployment

9.7.2. Merger & Acquisitions

9.7.3. Joint Ventures

9.8. Major Players Financial Matrix

9.8.1. Sales & Operating Income, 2022

9.8.2. Major Players R&D Expenditure. 2022

10. COMPANY PROFILES

10.1. Glencore

10.1.1. Company Overview

10.1.2. Financial Overview

10.1.3. Product Offered

10.1.4. Key Developments

10.1.5. SWOT Analysis

10.1.6. Key Strategies

10.2. Rio Tinto

10.2.1. Company Overview

10.2.2. Financial Overview

10.2.3. Product Offered

10.2.4. Key Developments

10.2.5. SWOT Analysis

10.2.6. Key Strategies

10.3. Vale S.A.

10.3.1. Company Overview

10.3.2. Financial Overview

10.3.3. Product Offered

10.3.4. Key Developments

10.3.5. SWOT Analysis

10.3.6. Key Strategies

10.4. BHP Billiton

10.4.1. Company Overview

10.4.2. Financial Overview

10.4.3. Product Offered

10.4.4. Key Developments

10.4.5. SWOT Analysis

10.4.6. Key Strategies

10.5. Tata Steel

10.5.1. Company Overview

10.5.2. Financial Overview

10.5.3. Product Offered

10.5.4. Key Developments

10.5.5. SWOT Analysis

10.5.6. Key Strategies

10.6. Anglo American

10.6.1. Company Overview

10.6.2. Financial Overview

10.6.3. Product Offered

10.6.4. Key Developments

10.6.5. SWOT Analysis

10.6.6. Key Strategies

10.7. Jiangxi Copper Corporation Limited

10.7.1. Company Overview

10.7.2. Financial Overview

10.7.3. Product Offered

10.7.4. Key Developments

10.7.5. SWOT Analysis

10.7.6. Key Strategies

10.8. Liebherr

10.8.1. Company Overview

10.8.2. Financial Overview

10.8.3. Product Offered

10.8.4. Key Developments

10.8.5. SWOT Analysis

10.8.6. Key Strategies

10.9. Saudi Arabian Mining Corporation

10.9.1. Company Overview

10.9.2. Financial Overview

10.9.3. Product Offered

10.9.4. Key Developments

10.9.5. SWOT Analysis

10.9.6. Key Strategies

10.10. Sany

10.10.1. Company Overview

10.10.2. Financial Overview

10.10.3. Product Offered

10.10.4. Key Developments

10.10.5. SWOT Analysis

10.10.6. Key Strategies

10.11. Doosan Infracore

10.11.1. Company Overview

10.11.2. Financial Overview

10.11.3. Product Offered

10.11.4. Key Developments

10.11.5. SWOT Analysis

10.11.6. Key Strategies

10.12. Shandong Gold Mining Co. Ltd

10.12.1. Company Overview

10.12.2. Financial Overview

10.12.3. Product Offered

10.12.4. Key Developments

10.12.5. SWOT Analysis

10.12.6. Key Strategies

11. APPENDIX

11.1. References

11.2. Related Reports

LIST OF TABLES

TABLE 1 GLOBAL GREEN MINING MARKET, SYNOPSIS, 2018-2032

TABLE 2 GLOBAL GREEN MINING MARKET, ESTIMATES & FORECAST, 2018-2032 (USD BILLION)

TABLE 3 GLOBAL GREEN MINING MARKET, BY TYPE, 2018-2032 (USD BILLION)

TABLE 4 GLOBAL GREEN MINING MARKET, BY TECHNOLOGY, 2018-2032 (USD BILLION)

TABLE 5 NORTH AMERICA GREEN MINING MARKET, BY TYPE, 2018-2032 (USD BILLION)

TABLE 6 NORTH AMERICA GREEN MINING MARKET, BY TECHNOLOGY, 2018-2032 (USD BILLION)

TABLE 7 NORTH AMERICA GREEN MINING MARKET, BY COUNTRY, 2018-2032 (USD BILLION)

TABLE 8 U.S. GREEN MINING MARKET, BY TYPE, 2018-2032 (USD BILLION)

TABLE 9 U.S. GREEN MINING MARKET, BY TECHNOLOGY, 2018-2032 (USD BILLION)

TABLE 10 CANADA GREEN MINING MARKET, BY TYPE, 2018-2032 (USD BILLION)

TABLE 11 CANADA GREEN MINING MARKET, BY TECHNOLOGY, 2018-2032 (USD BILLION)

TABLE 12 EUROPE GREEN MINING MARKET, BY TYPE, 2018-2032 (USD BILLION)

TABLE 13 EUROPE GREEN MINING MARKET, BY TECHNOLOGY, 2018-2032 (USD BILLION)

TABLE 14 EUROPE GREEN MINING MARKET, BY COUNTRY, 2018-2032 (USD BILLION)

TABLE 15 GERMANY GREEN MINING MARKET, BY TYPE, 2018-2032 (USD BILLION)

TABLE 16 GERMANY GREEN MINING MARKET, BY TECHNOLOGY, 2018-2032 (USD BILLION)

TABLE 17 FRANCE GREEN MINING MARKET, BY TYPE, 2018-2032 (USD BILLION)

TABLE 18 FRANCE GREEN MINING MARKET, BY TECHNOLOGY, 2018-2032 (USD BILLION)

TABLE 19 ITALY GREEN MINING MARKET, BY TYPE, 2018-2032 (USD BILLION)

TABLE 20 ITALY GREEN MINING MARKET, BY TECHNOLOGY, 2018-2032 (USD BILLION)

TABLE 21 SPAIN GREEN MINING MARKET, BY TYPE, 2018-2032 (USD BILLION)

TABLE 22 SPAIN GREEN MINING MARKET, BY TECHNOLOGY, 2018-2032 (USD BILLION)

TABLE 23 U.K GREEN MINING MARKET, BY TYPE, 2018-2032 (USD BILLION)

TABLE 24 U.K GREEN MINING MARKET, BY TECHNOLOGY, 2018-2032 (USD BILLION)

TABLE 25 REST OF EUROPE GREEN MINING MARKET, BY TYPE, 2018-2032 (USD BILLION)

TABLE 26 REST OF EUROPE GREEN MINING MARKET, BY TECHNOLOGY, 2018-2032 (USD BILLION)

TABLE 27 ASIA PACIFIC GREEN MINING MARKET, BY TYPE, 2018-2032 (USD BILLION)

TABLE 28 ASIA PACIFIC GREEN MINING MARKET, BY TECHNOLOGY, 2018-2032 (USD BILLION)

TABLE 29 ASIA PACIFIC GREEN MINING MARKET, BY COUNTRY, 2018-2032 (USD BILLION)

TABLE 30 JAPAN GREEN MINING MARKET, BY TYPE, 2018-2032 (USD BILLION)

TABLE 31 JAPAN GREEN MINING MARKET, BY TECHNOLOGY, 2018-2032 (USD BILLION)

TABLE 32 CHINA GREEN MINING MARKET, BY TYPE, 2018-2032 (USD BILLION)

TABLE 33 CHINA GREEN MINING MARKET, BY TECHNOLOGY, 2018-2032 (USD BILLION)

TABLE 34 INDIA GREEN MINING MARKET, BY TYPE, 2018-2032 (USD BILLION)

TABLE 35 INDIA GREEN MINING MARKET, BY TECHNOLOGY, 2018-2032 (USD BILLION)

TABLE 36 AUSTRALIA GREEN MINING MARKET, BY TYPE, 2018-2032 (USD BILLION)

TABLE 37 AUSTRALIA GREEN MINING MARKET, BY TECHNOLOGY, 2018-2032 (USD BILLION)

TABLE 38 SOUTH KOREA GREEN MINING MARKET, BY TYPE, 2018-2032 (USD BILLION)

TABLE 39 SOUTH KOREA GREEN MINING MARKET, BY TECHNOLOGY, 2018-2032 (USD BILLION)

TABLE 40 REST OF ASIA-PACIFIC GREEN MINING MARKET, BY TYPE, 2018-2032 (USD BILLION)

TABLE 41 REST OF ASIA-PACIFIC GREEN MINING MARKET, BY TECHNOLOGY, 2018-2032 (USD BILLION)

TABLE 42 REST OF WORLD GREEN MINING MARKET, BY TYPE, 2018-2032 (USD BILLION)

TABLE 43 REST OF WORLD GREEN MINING MARKET, BY TECHNOLOGY, 2018-2032 (USD BILLION)

TABLE 44 REST OF WORLD GREEN MINING MARKET, BY COUNTRY, 2018-2032 (USD BILLION)

TABLE 45 MIDDLE EAST GREEN MINING MARKET, BY TYPE, 2018-2032 (USD BILLION)

TABLE 46 MIDDLE EAST GREEN MINING MARKET, BY TECHNOLOGY, 2018-2032 (USD BILLION)

TABLE 47 AFRICA GREEN MINING MARKET, BY TYPE, 2018-2032 (USD BILLION)

TABLE 48 AFRICA GREEN MINING MARKET, BY TECHNOLOGY, 2018-2032 (USD BILLION)

TABLE 49 LATIN AMERICA GREEN MINING MARKET, BY TYPE, 2018-2032 (USD BILLION)

TABLE 50 LATIN AMERICA GREEN MINING MARKET, BY TECHNOLOGY, 2018-2032 (USD BILLION)

LIST OF FIGURES

FIGURE 1 RESEARCH PROCESS

FIGURE 2 MARKET STRUCTURE FOR THE GLOBAL GREEN MINING MARKET

FIGURE 3 MARKET DYNAMICS FOR THE GLOBAL GREEN MINING MARKET

FIGURE 4 GLOBAL GREEN MINING MARKET, SHARE (%), BY TYPE, 2022

FIGURE 5 GLOBAL GREEN MINING MARKET, SHARE (%), BY TECHNOLOGY, 2022

FIGURE 6 GLOBAL GREEN MINING MARKET, SHARE (%), BY REGION, 2022

FIGURE 7 NORTH AMERICA: GREEN MINING MARKET, SHARE (%), BY REGION, 2022

FIGURE 8 EUROPE: GREEN MINING MARKET, SHARE (%), BY REGION, 2022

FIGURE 9 ASIA-PACIFIC: GREEN MINING MARKET, SHARE (%), BY REGION, 2022

FIGURE 10 REST OF THE WORLD: GREEN MINING MARKET, SHARE (%), BY REGION, 2022

FIGURE 11 GLOBAL GREEN MINING MARKET: COMPANY SHARE ANALYSIS, 2022 (%)

FIGURE 12 GLENCORE: FINANCIAL OVERVIEW SNAPSHOT

FIGURE 13 GLENCORE: SWOT ANALYSIS

FIGURE 14 RIO TINTO: FINANCIAL OVERVIEW SNAPSHOT

FIGURE 15 RIO TINTO: SWOT ANALYSIS

FIGURE 16 VALE S.A.: FINANCIAL OVERVIEW SNAPSHOT

FIGURE 17 VALE S.A.: SWOT ANALYSIS

FIGURE 18 BHP BILLITON: FINANCIAL OVERVIEW SNAPSHOT

FIGURE 19 BHP BILLITON: SWOT ANALYSIS

FIGURE 20 TATA STEEL.: FINANCIAL OVERVIEW SNAPSHOT

FIGURE 21 TATA STEEL.: SWOT ANALYSIS

FIGURE 22 ANGLO AMERICAN: FINANCIAL OVERVIEW SNAPSHOT

FIGURE 23 ANGLO AMERICAN: SWOT ANALYSIS

FIGURE 24 JIANGXI COPPER CORPORATION LIMITED: FINANCIAL OVERVIEW SNAPSHOT

FIGURE 25 JIANGXI COPPER CORPORATION LIMITED: SWOT ANALYSIS

FIGURE 26 LIEBHERR: FINANCIAL OVERVIEW SNAPSHOT

FIGURE 27 LIEBHERR: SWOT ANALYSIS

FIGURE 28 SAUDI ARABIAN MINING CORPORATION: FINANCIAL OVERVIEW SNAPSHOT

FIGURE 29 SAUDI ARABIAN MINING CORPORATION: SWOT ANALYSIS

FIGURE 30 SANY: FINANCIAL OVERVIEW SNAPSHOT

FIGURE 31 SANY: SWOT ANALYSIS

FIGURE 32 DOOSAN INFRACORE: FINANCIAL OVERVIEW SNAPSHOT

FIGURE 33 DOOSAN INFRACORE: SWOT ANALYSIS

FIGURE 34 SHANDONG GOLD MINING CO. LTD: FINANCIAL OVERVIEW SNAPSHOT

FIGURE 35 SHANDONG GOLD MINING CO. LTD: SWOT ANALYSIS

Purchase Option
Single User $ 4,950
Multiuser License $ 5,950
Enterprise User $ 7,250
Compare Licenses
Tailored for You
  • Dedicated Research on any specifics segment or region.
  • Focused Research on specific players in the market.
  • Custom Report based only on your requirements.
  • Flexibility to add or subtract any chapter in the study.
  • Historic data from 2014 and forecasts outlook till 2040.
  • Flexibility of providing data/insights in formats (PDF, PPT, Excel).
  • Provide cross segmentation in applicable scenario/markets.