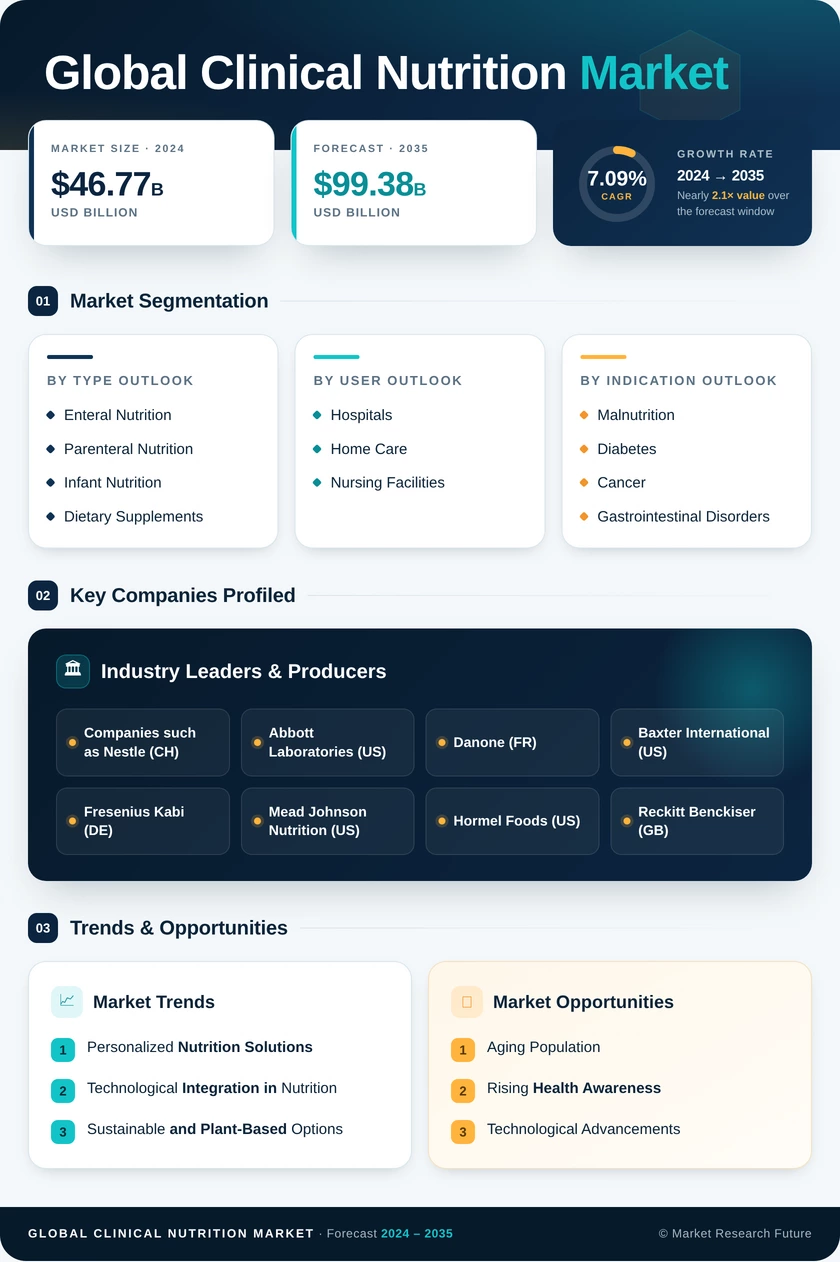
Clinical Nutrition Market (2026 - 2035)

ID: MRFR/HC/0333-CR 200 Pages Rahul Gotadki Last Updated: October 27, 2026
Clinical Nutrition Market Size, Growth Research Report By Product Type (Enteral Nutrition, Parenteral Nutrition, Infant Nutrition, Dietary Supplements), By Indication (Malnutrition, Diabetes, Cancer, Gastrointestinal Disorders), By Route of Administration (Oral, Enteral, Parenteral), By End User (Hospitals, Home Care, Nursing Facilities) and By Regional (North America, Europe, South America, Asia Pacific, Middle East and Africa), Competitor Industry Analysis and Trends - Forecast Till 2035
Clinical Nutrition Market
Market Size
Forecast Period2026-2035
CAGR (2026-2035)7.38%
2025 Market SizeUSD 73.02 Billion
2035 Market SizeUSD 148.83 Billion
Key Players
Abbott Laboratories
Nestlé Health Science
Danone
Fresenius Kabi
Baxter International
Reckitt
Opportunities
  • Public Procurement in Emerging Markets
  • Companion Nutrition for GLP-1 Weight-Loss Therapy
  • Data-Driven Service and Subscription Models
  1. 1 Market Summary | |
  2. 2 Key Report Takeaways | |
    1. 2.1 By Route of Administration | |
    2. 2.2 By Product Type | |
    3. 2.3 By Form | |
    4. 2.4 By Application | |
    5. 2.5 By End User | |
    6. 2.6 By Distribution Channel | |
    7. 2.7 By Region | |
  3. 3 Market Size and Forecast (2021–2035) | |
    1. 3.1 Historical Market Size (2021–2025) | |
    2. 3.2 Forecast Market Size (2026–2035) | |
    3. 3.3 Year-over-Year Growth Analysis | |
  4. 4 Driver Impact Analysis | |
    1. 4.1 Hospital Malnutrition Screening Mandates | |
    2. 4.2 Population Aging and Sarcopenia | |
    3. 4.3 Rising Cancer Burden and Perioperative Protocols | |
    4. 4.4 Diabetes and Metabolic Disease Prevalence | |
    5. 4.5 Preterm Births and Specialized Infant Formulas | |
    6. 4.6 Government Nutrition Programs in Emerging Economies | |
    7. 4.7 Shift to Home Enteral Care and Online Dispensing | |
  5. 5 Restraints Impact Analysis | |
    1. 5.1 Reimbursement Gaps for Home and Oral Nutrition | |
    2. 5.2 Product Recalls and Litigation Exposure | |
    3. 5.3 Parenteral Complications and Infection Cost | |
    4. 5.4 Stringent and Divergent Regulatory Frameworks | |
    5. 5.5 Input Cost Volatility and Component Shortages | |
  6. 6 Opportunities | |
    1. 6.1 Public Procurement in Emerging Markets | |
    2. 6.2 Companion Nutrition for GLP-1 Weight-Loss Therapy | |
    3. 6.3 Data-Driven Service and Subscription Models | |
    4. 6.4 Texture-Modified Products for Dysphagia | |
    5. 6.5 Whole-Food and Plant-Based Tube Feeds | |
  7. 7 Regional Market Share and Country-Level Analysis | |
    1. 7.1 North America | | |
      1. 7.1.1 US | | |
      2. 7.1.2 Canada | | |
      3. 7.1.3 Mexico | |
    2. 7.2 Europe | | |
      1. 7.2.1 Germany | | |
      2. 7.2.2 UK | | |
      3. 7.2.3 France | | |
      4. 7.2.4 Italy | | |
      5. 7.2.5 Spain | | |
      6. 7.2.6 Nordic Countries | | |
      7. 7.2.7 Russia | | |
      8. 7.2.8 Rest of Europe | |
    3. 7.3 Asia-Pacific | | |
      1. 7.3.1 China | | |
      2. 7.3.2 India | | |
      3. 7.3.3 Japan | | |
      4. 7.3.4 South Korea | | |
      5. 7.3.5 ASEAN | | |
      6. 7.3.6 Rest of Asia-Pacific | |
    4. 7.4 South America | | |
      1. 7.4.1 Brazil | | |
      2. 7.4.2 Argentina | | |
      3. 7.4.3 Rest of South America | |
    5. 7.5 Middle East & Africa | | |
      1. 7.5.1 Saudi Arabia | | |
      2. 7.5.2 UAE | | |
      3. 7.5.3 South Africa | | |
      4. 7.5.4 Egypt | | |
      5. 7.5.5 Rest of MEA | |
  8. 8 Future Outlook (2026–2035) | |
    1. 8.1 AI-Enabled Screening and Precision Nutrition | |
    2. 8.2 Hospital-to-Home Care Migration | |
    3. 8.3 Demographic Supercycle | |
    4. 8.4 Sustainability and Supply Resilience | |
  9. 9 Segmentation Analysis | |
    1. 9.1 By Route of Administration | | |
      1. 9.1.1 Oral & Enteral | | |
      2. 9.1.2 Parenteral | |
    2. 9.2 By Product Type | | |
      1. 9.2.1 Infant Nutrition | | |
      2. 9.2.2 Enteral Nutrition | | |
      3. 9.2.3 Parenteral Nutrition | |
    3. 9.3 By Form | | |
      1. 9.3.1 Powder | | |
      2. 9.3.2 Liquid | | |
      3. 9.3.3 Semi-Solid | |
    4. 9.4 By Application | | |
      1. 9.4.1 Nutritional Support for Malnutrition | | |
      2. 9.4.2 Metabolic Disorders | | |
      3. 9.4.3 Gastrointestinal Disorders | | |
      4. 9.4.4 Neurological Disorders | | |
      5. 9.4.5 Cancer Care | | |
      6. 9.4.6 Other Applications | |
    5. 9.5 By End User | | |
      1. 9.5.1 Pediatric | | |
      2. 9.5.2 Adult | | |
      3. 9.5.3 Geriatric | |
    6. 9.6 By Distribution Channel | | |
      1. 9.6.1 Hospital Pharmacies | | |
      2. 9.6.2 Retail Pharmacies | | |
      3. 9.6.3 Online Pharmacies | |
  10. 10 Competitive Landscape | |
    1. 10.1 Market Concentration Analysis | |
    2. 10.2 Competitive Benchmarking Matrix | |
    3. 10.3 Company Profiles | | |
      1. 10.3.1 Abbott Laboratories | | |
      2. 10.3.2 Nestlé Health Science | | |
      3. 10.3.3 Danone (Nutricia) | | |
      4. 10.3.4 Fresenius Kabi | | |
      5. 10.3.5 Baxter International | | |
      6. 10.3.6 Reckitt (Mead Johnson Nutrition) | | |
      7. 10.3.7 B. Braun | | |
      8. 10.3.8 Meiji Holdings | | |
      9. 10.3.9 Otsuka Pharmaceutical | | |
      10. 10.3.10 Ajinomoto Co. | |
  11. 11 Recent News & Developments | |
  12. 12 Report Scope and Methodology | |
  13. 13 Detailed Sources and Citations | |
  14. 14 Frequently Asked Questions (FAQs) | | LIST OF TABLES | |
  15. TABLE 1 Report Snapshot, 2025–2035 | |
  16. TABLE 2 Global Market Size & Forecast, by Revenue (USD Billion), 2021–2035 | |
  17. TABLE 3 Driver Impact Analysis | |
  18. TABLE 4 Restraints Impact Analysis | |
  19. TABLE 5 Regional Summary, 2025 | |
  20. TABLE 6 North America Market, by Country, 2025–2035 | |
  21. TABLE 7 Europe Market, by Country, 2025–2035 | |
  22. TABLE 8 Asia-Pacific Market, by Country, 2025–2035 | |
  23. TABLE 9 South America Market, by Country, 2025–2035 | |
  24. TABLE 10 Middle East & Africa Market, by Country, 2025–2035 | |
  25. TABLE 11 Global Market, by Route of Administration, 2025–2035 | |
  26. TABLE 12 Global Market, by Product Type, 2025–2035 | |
  27. TABLE 13 Global Market, by Form, 2025–2035 | |
  28. TABLE 14 Global Market, by Application, 2025–2035 | |
  29. TABLE 15 Global Market, by End User, 2025–2035 | |
  30. TABLE 16 Global Market, by Distribution Channel, 2025–2035 | |
  31. TABLE 17 Competitive Benchmarking Matrix, 2025 | |
  32. TABLE 18 Report Scope and Methodology | |
  33. TABLE 19 Detailed Sources and Citations | |
  34. TABLE 20 Segmentation Quick Reference | |
  35. TABLE 21 Route of Administration — Sub-Segment Trends | |
  36. TABLE 22 Product Type — Sub-Segment Trends | |
  37. TABLE 23 Form — Sub-Segment Trends | |
  38. TABLE 24 Application — Sub-Segment Trends | |
  39. TABLE 25 End User — Sub-Segment Trends | |
  40. TABLE 26 Distribution Channel — Sub-Segment Trends | | LIST OF FIGURES | |
  41. FIGURE 1 Market Dynamics Overview (Drivers, Restraints, Opportunities) | |
  42. FIGURE 2 Industry Value Chain Analysis | |
  43. FIGURE 3 Porter's Five Forces Analysis | |
  44. FIGURE 4 Global Market Size Trend, 2021–2035 (USD Billion) | |
  45. FIGURE 5 Year-over-Year Growth Rate, 2022–2035 | |
  46. FIGURE 6 Market Share by Route of Administration, 2025 | |
  47. FIGURE 7 Market Share by Product Type, 2025 | |
  48. FIGURE 8 Market Share by Form, 2025 | |
  49. FIGURE 9 Market Share by Application, 2025 | |
  50. FIGURE 10 Market Share by End User, 2025 | |
  51. FIGURE 11 Market Share by Distribution Channel, 2025 | |
  52. FIGURE 12 Market Share by Region, 2025 | |
  53. FIGURE 13 Regional CAGR Comparison, 2026–2035 | |
  54. FIGURE 14 Estimated Revenue Share Ranges of Key Players, 2025 | |
  55. FIGURE 15 Competitive Positioning Matrix

Segmentation Quick Reference

DimensionSub-SegmentsDominant SegmentFastest Growing Segment
By Route of AdministrationOral & Enteral; ParenteralOral & Enteral (64.3% share)Parenteral (7.8% CAGR)
By Product TypeInfant Nutrition; Enteral Nutrition; Parenteral NutritionInfant Nutrition (41.0% share)Enteral Nutrition (8.4% CAGR)
By FormPowder; Liquid; Semi-SolidLiquid (55.8% share)Semi-Solid (7.9% CAGR)
By ApplicationNutritional Support for Malnutrition; Metabolic Disorders; Gastrointestinal Disorders; Neurological Disorders; Cancer Care; Other ApplicationsNutritional Support for Malnutrition (28.6% share)Cancer Care (8.3% CAGR)
By End UserPediatric; Adult; GeriatricAdult (46.7% share)Geriatric (8.5% CAGR)
By Distribution ChannelHospital Pharmacies; Retail Pharmacies; Online PharmaciesHospital Pharmacies (52.9% share)Online Pharmacies (9.3% CAGR)
By RegionNorth America; Europe; Asia-Pacific; South America; Middle East & AfricaNorth America (38.4% share)Asia-Pacific (9.1% CAGR)


Market Segmentation Overview

By Route of Administration

Sub-SegmentKey Trend
Oral & EnteralClosed ready-to-hang systems and ENFit connectors replacing open decanting
ParenteralPremixed multi-chamber bags and fish-oil lipid emulsions gaining ICU adoption


Oral & Enteral leads with a 64.3% share because guidelines favor gut-based feeding and oral or tube delivery is cheaper and safer than intravenous access. Parenteral is the faster grower at a 7.8% CAGR, as intensive care, short bowel syndrome, and oncology cases require intravenous support. Fish-oil lipid emulsions associated with fewer infections are widening their clinical acceptance.

By Product Type

Sub-SegmentKey Trend
Infant NutritionPreterm formulas, fortifiers, and hypoallergenic lines under tighter FDA review
Enteral NutritionDisease-specific formulas for diabetes, renal, and oncology patients
Parenteral NutritionShift from compounded bags to standardized premixed products


Infant Nutrition holds the largest share at 41.0%, sustained by preterm formulas, human milk fortifiers, and hypoallergenic products. Enteral Nutrition grows fastest at an 8.4% CAGR as hospitals standardize disease-specific formulas for diabetic, renal, and oncology patients. Parenteral Nutrition remains a USD 26.07 billion sterile-product category dominated by specialist injectables manufacturers.

By Form

Sub-SegmentKey Trend
PowderPreferred for infant formula and modular protein additives
LiquidRetort pouches and ready-to-drink formats extend ambient shelf life
Semi-SolidPre-thickened products aligned to IDDSI texture levels


Liquid formats dominate with a 55.8% share because parenteral solutions and ready-to-hang tube feeds are inherently liquid. Semi-Solid is the fastest-growing form at a 7.9% CAGR, driven by care homes replacing ward-mixed thickener powders with pre-thickened, IDDSI-compliant puddings and gels. Powder keeps its USD 25.70 billion base through infant formula and modular additives.

By Application

Sub-SegmentKey Trend
Nutritional Support for MalnutritionScreening mandates turning under-coded cases into treated patients
Metabolic DisordersDiabetes-specific and amino-acid-based formulas
Gastrointestinal DisordersElemental and peptide-based feeds for Crohn's and short bowel syndrome
Neurological DisordersDysphagia products for stroke and neurodegenerative disease
Cancer CareNutrition embedded in ERAS pathways and cachexia protocols
Other ApplicationsWound-healing, renal, and hepatic formulas


Nutritional Support for Malnutrition leads with a 28.6% share as CMS and ESPEN screening expectations push hospitals to identify and treat malnourished admissions. Cancer Care is the fastest-growing application at an 8.3% CAGR, because oncology centers now build preoperative and cachexia nutrition into ERAS pathways. Metabolic Disorders and Neurological Disorders add steady demand through diabetes and stroke-related dysphagia.

By End User

Sub-SegmentKey Trend
PediatricNICU expansion and specialized feeds for medically complex children
AdultChronic disease, surgery, and GLP-1 companion nutrition
GeriatricLeucine-enriched, low-volume drinks for sarcopenia


Adult patients form the largest group at a 46.7% share, reflecting surgery, chronic disease, and cancer treatment in working-age populations. Geriatric use grows fastest at an 8.5% CAGR as care-home operators specify high-protein, low-volume formulas for residents with sarcopenia and reduced appetite. Pediatric demand, worth USD 26.29 billion, rests on preterm and specialty infant feeding.

By Distribution Channel

Sub-SegmentKey Trend
Hospital Pharmacies 


Hospital Pharmacies dispense 52.9% of the Clinical Nutrition Market, since parenteral admixtures, tube feeds, and inpatient supplements move through hospital formularies and group purchasing contracts. Retail Pharmacies account for USD 28.55 billion, driven by infant formula and over-the-counter oral supplements. Online Pharmacies are growing at a 9.3% CAGR as discharged patients receive recurring home deliveries and telehealth dietitians prescribe digitally.


Download PDF ×

We do not share your information with anyone. However, we may send you emails based on your report interest from time to time. You may contact us at any time to opt-out.