Segmentation Quick Reference
| Dimension | Sub-Segments | Dominant Segment | Fastest Growing Segment |
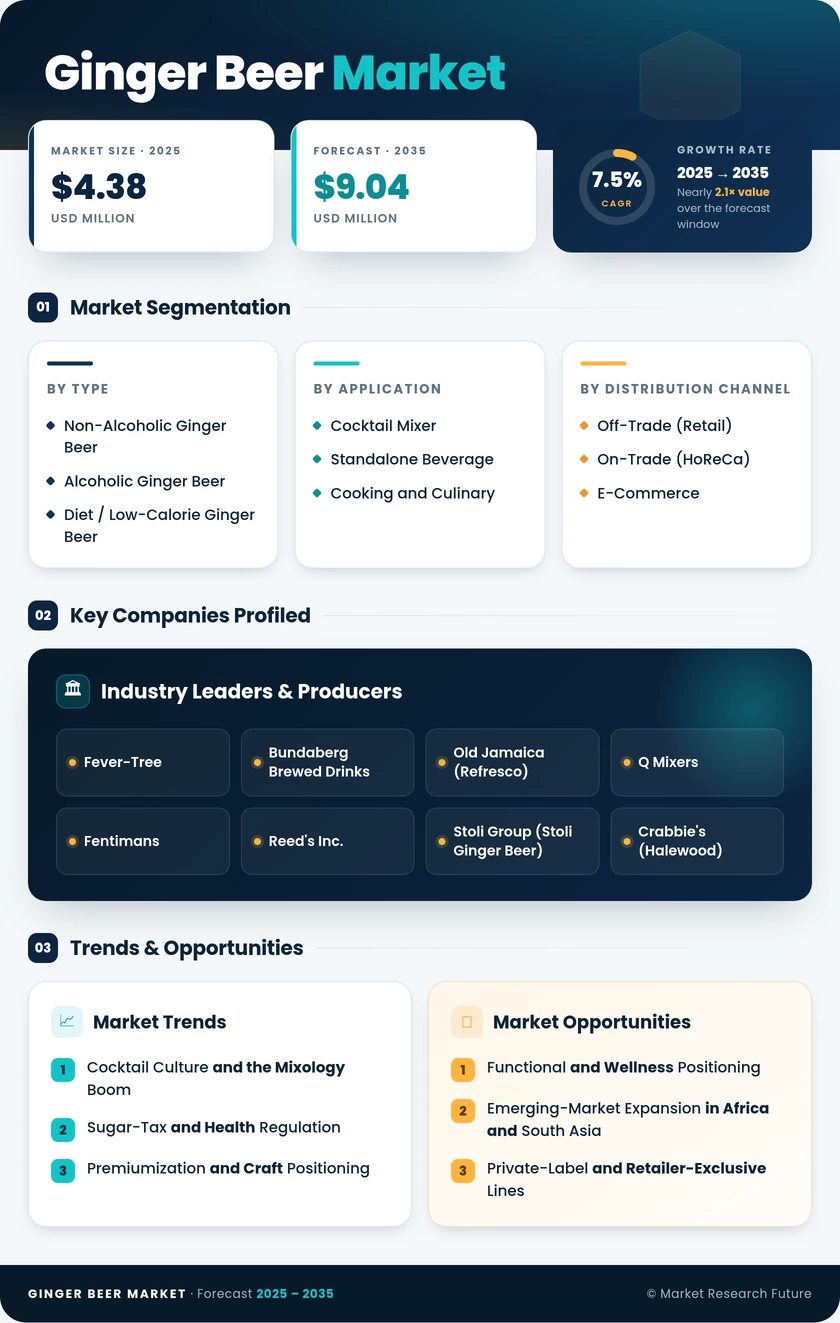
| By Product Type | Non-Alcoholic Ginger Beer, Alcoholic Ginger Beer, Diet / Low-Calorie Ginger Beer | Non-Alcoholic Ginger Beer (~62% share) | Alcoholic Ginger Beer (8.9% CAGR) |
| By Application | Cocktail Mixer, Standalone Beverage, Cooking and Culinary | Cocktail Mixer (~38% share) | Cocktail Mixer |
| By Distribution Channel | Off-Trade (Retail), On-Trade (HoReCa), E-Commerce | Off-Trade (~58% volume share) | On-Trade (8.5% CAGR) |
Market Segmentation Overview
By Product Type
| Sub-Segment | Key Trend |
| Non-Alcoholic Ginger Beer | Mainstream retail dominance; sugar-reduction reformulations accelerating under health levy pressure |
| Alcoholic Ginger Beer | Craft brewing crossover; taproom and pub distribution expanding in UK, US, and Australia |
| Diet / Low-Calorie Ginger Beer | Stevia and monk-fruit sweetener adoption; regulatory compliance with tiered sugar taxes |
Non-alcoholic ginger beer continues to anchor the global ginger beer market, accounting for the majority of both retail volume and foodservice orders. Alcoholic variants are carving a distinct identity within the craft-beverage movement, while diet formulations address growing regulatory and consumer demand for lower-sugar options.
By Application
| Sub-Segment | Key Trend |
| Cocktail Mixer | Moscow Mule and Dark 'n' Stormy driving on-premise demand; RTD cocktail integration emerging |
| Standalone Beverage | Everyday refreshment occasion; growth tied to health-positioning and snacking culture |
| Cooking and Culinary | Chef and food-blogger adoption for glazes, marinades, and desserts |
The cocktail-mixer application continues to set the pace for category innovation, with bartenders experimenting across spirit pairings. Standalone consumption provides the volume base, and culinary use — while niche — introduces ginger beer to consumers who may not discover it through traditional beverage channels.
By Distribution Channel
| Sub-Segment | Key Trend |
| Off-Trade (Retail) | Supermarket and specialty-store assortment expansion; private-label growth |
| On-Trade (HoReCa) | Post-pandemic recovery; premium menu positioning creates brand halo effect |
| E-Commerce | DTC subscriptions and marketplace discovery; critical for craft brands lacking national retail distribution |
Off-trade retail remains the volume engine, but on-trade recovery is restoring the brand-building function that bars and restaurants provide. E-commerce is rapidly becoming a third pillar, particularly for craft and artisanal producers who use direct shipping and subscription models to build loyal consumer bases.