

Germany Information and Communications Technology Market Segmentation
Information and Communications Technology By Application (USD Million, 2025-2035)
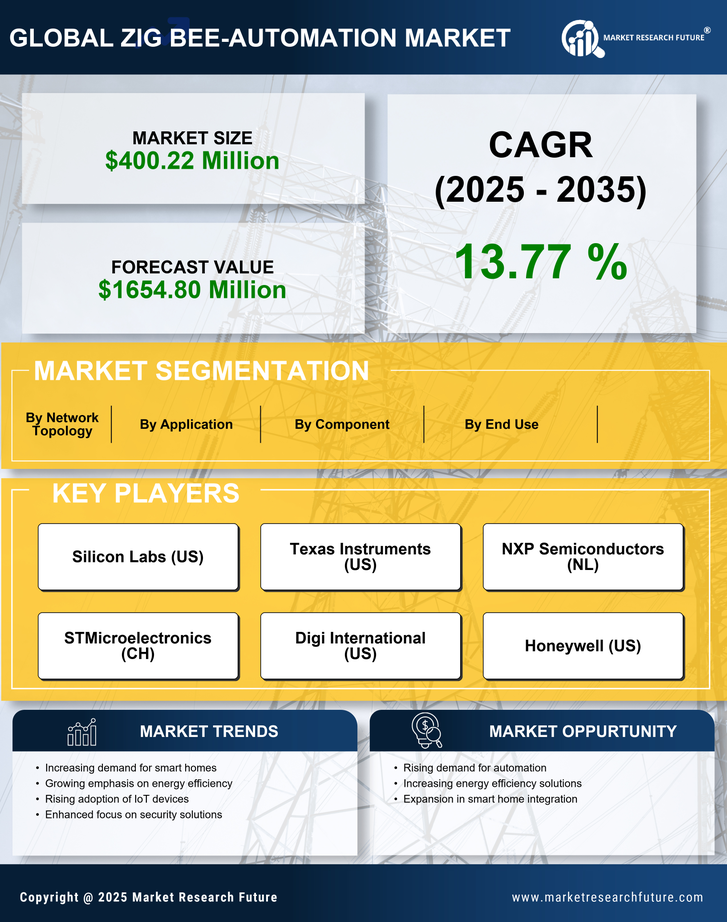
- Smart Home Automation
- Industrial Automation
- Smart Healthcare
- Smart Lighting
- Smart Agriculture
Information and Communications Technology By End Use (USD Million, 2025-2035)
- Residential
- Commercial
- Industrial
Information and Communications Technology By Component (USD Million, 2025-2035)
- Sensors
- Actuators
- Controllers
- Gateways
Information and Communications Technology By Network Topology (USD Million, 2025-2035)
- Star Topology
- Mesh Topology
- Cluster Tree Topology


