Request Free Sample ×

Kindly complete the form below to receive a free sample of this Report

* Please use a valid business email

Leading companies partner with us for data-driven Insights

clients tt-cursor
Hero Background

Germany Churg Strauss Syndrome Market

ID: MRFR/HC/54619-HCR
200 Pages
Rahul Gotadki
Last Updated: February 06, 2026

Germany Churg-Strauss Syndrome Market Research Report: Size, Share, Trend Analysis By Disease Type (Eosinophilic Granulomatosis, Churg-Strauss Syndrome, Asthma), By Treatment Type (Medication, Surgery, Therapy), By Route of Administration (Oral, Intravenous, Subcutaneous) and By Patient Population (Adult Patients, Pediatric Patients, Geriatric Patients) - Growth Outlook & Industry Forecast 2025 To 2035

Share:
Download PDF ×

We do not share your information with anyone. However, we may send you emails based on your report interest from time to time. You may contact us at any time to opt-out.

Germany Churg Strauss Syndrome Market Infographic
Purchase Options
  1. 1 SECTION I: EXECUTIVE SUMMARY AND KEY HIGHLIGHTS
    1. 1.1 EXECUTIVE SUMMARY
      1. 1.1.1 Market Overview
      2. 1.1.2 Key Findings
      3. 1.1.3 Market Segmentation
      4. 1.1.4 Competitive Landscape
      5. 1.1.5 Challenges and Opportunities
      6. 1.1.6 Future Outlook
  2. 2 SECTION II: SCOPING, METHODOLOGY AND MARKET STRUCTURE
    1. 2.1 MARKET INTRODUCTION
      1. 2.1.1 Definition
      2. 2.1.2 Scope of the study
        1. 2.1.2.1 Research Objective
        2. 2.1.2.2 Assumption
        3. 2.1.2.3 Limitations
    2. 2.2 RESEARCH METHODOLOGY
      1. 2.2.1 Overview
      2. 2.2.2 Data Mining
      3. 2.2.3 Secondary Research
      4. 2.2.4 Primary Research
        1. 2.2.4.1 Primary Interviews and Information Gathering Process
        2. 2.2.4.2 Breakdown of Primary Respondents
      5. 2.2.5 Forecasting Model
      6. 2.2.6 Market Size Estimation
        1. 2.2.6.1 Bottom-Up Approach
        2. 2.2.6.2 Top-Down Approach
      7. 2.2.7 Data Triangulation
      8. 2.2.8 Validation
  3. 3 SECTION III: QUALITATIVE ANALYSIS
    1. 3.1 MARKET DYNAMICS
      1. 3.1.1 Overview
      2. 3.1.2 Drivers
      3. 3.1.3 Restraints
      4. 3.1.4 Opportunities
    2. 3.2 MARKET FACTOR ANALYSIS
      1. 3.2.1 Value chain Analysis
      2. 3.2.2 Porter's Five Forces Analysis
        1. 3.2.2.1 Bargaining Power of Suppliers
        2. 3.2.2.2 Bargaining Power of Buyers
        3. 3.2.2.3 Threat of New Entrants
        4. 3.2.2.4 Threat of Substitutes
        5. 3.2.2.5 Intensity of Rivalry
      3. 3.2.3 COVID-19 Impact Analysis
        1. 3.2.3.1 Market Impact Analysis
        2. 3.2.3.2 Regional Impact
        3. 3.2.3.3 Opportunity and Threat Analysis
  4. 4 SECTION IV: QUANTITATIVE ANALYSIS
    1. 4.1 Life Sciences, BY Disease Type (USD Million)
      1. 4.1.1 Eosinophilic Granulomatosis
      2. 4.1.2 Churg-Strauss Syndrome
      3. 4.1.3 Asthma
    2. 4.2 Life Sciences, BY Treatment Type (USD Million)
      1. 4.2.1 Medication
      2. 4.2.2 Surgery
      3. 4.2.3 Therapy
    3. 4.3 Life Sciences, BY Route of Administration (USD Million)
      1. 4.3.1 Oral
      2. 4.3.2 Intravenous
      3. 4.3.3 Subcutaneous
    4. 4.4 Life Sciences, BY Patient Population (USD Million)
      1. 4.4.1 Adult Patients
      2. 4.4.2 Pediatric Patients
      3. 4.4.3 Geriatric Patients
  5. 5 SECTION V: COMPETITIVE ANALYSIS
    1. 5.1 Competitive Landscape
      1. 5.1.1 Overview
      2. 5.1.2 Competitive Analysis
      3. 5.1.3 Market share Analysis
      4. 5.1.4 Major Growth Strategy in the Life Sciences
      5. 5.1.5 Competitive Benchmarking
      6. 5.1.6 Leading Players in Terms of Number of Developments in the Life Sciences
      7. 5.1.7 Key developments and growth strategies
        1. 5.1.7.1 New Product Launch/Service Deployment
        2. 5.1.7.2 Merger & Acquisitions
        3. 5.1.7.3 Joint Ventures
      8. 5.1.8 Major Players Financial Matrix
        1. 5.1.8.1 Sales and Operating Income
        2. 5.1.8.2 Major Players R&D Expenditure. 2023
    2. 5.2 Company Profiles
      1. 5.2.1 Bristol-Myers Squibb (US)
        1. 5.2.1.1 Financial Overview
        2. 5.2.1.2 Products Offered
        3. 5.2.1.3 Key Developments
        4. 5.2.1.4 SWOT Analysis
        5. 5.2.1.5 Key Strategies
      2. 5.2.2 Genentech (US)
        1. 5.2.2.1 Financial Overview
        2. 5.2.2.2 Products Offered
        3. 5.2.2.3 Key Developments
        4. 5.2.2.4 SWOT Analysis
        5. 5.2.2.5 Key Strategies
      3. 5.2.3 Novartis (CH)
        1. 5.2.3.1 Financial Overview
        2. 5.2.3.2 Products Offered
        3. 5.2.3.3 Key Developments
        4. 5.2.3.4 SWOT Analysis
        5. 5.2.3.5 Key Strategies
      4. 5.2.4 AstraZeneca (GB)
        1. 5.2.4.1 Financial Overview
        2. 5.2.4.2 Products Offered
        3. 5.2.4.3 Key Developments
        4. 5.2.4.4 SWOT Analysis
        5. 5.2.4.5 Key Strategies
      5. 5.2.5 Sanofi (FR)
        1. 5.2.5.1 Financial Overview
        2. 5.2.5.2 Products Offered
        3. 5.2.5.3 Key Developments
        4. 5.2.5.4 SWOT Analysis
        5. 5.2.5.5 Key Strategies
      6. 5.2.6 GSK (GB)
        1. 5.2.6.1 Financial Overview
        2. 5.2.6.2 Products Offered
        3. 5.2.6.3 Key Developments
        4. 5.2.6.4 SWOT Analysis
        5. 5.2.6.5 Key Strategies
      7. 5.2.7 Roche (CH)
        1. 5.2.7.1 Financial Overview
        2. 5.2.7.2 Products Offered
        3. 5.2.7.3 Key Developments
        4. 5.2.7.4 SWOT Analysis
        5. 5.2.7.5 Key Strategies
      8. 5.2.8 Pfizer (US)
        1. 5.2.8.1 Financial Overview
        2. 5.2.8.2 Products Offered
        3. 5.2.8.3 Key Developments
        4. 5.2.8.4 SWOT Analysis
        5. 5.2.8.5 Key Strategies
      9. 5.2.9 Merck & Co. (US)
        1. 5.2.9.1 Financial Overview
        2. 5.2.9.2 Products Offered
        3. 5.2.9.3 Key Developments
        4. 5.2.9.4 SWOT Analysis
        5. 5.2.9.5 Key Strategies
    3. 5.3 Appendix
      1. 5.3.1 References
      2. 5.3.2 Related Reports
  6. 6 LIST OF FIGURES
    1. 6.1 MARKET SYNOPSIS
    2. 6.2 GERMANY MARKET ANALYSIS BY DISEASE TYPE
    3. 6.3 GERMANY MARKET ANALYSIS BY TREATMENT TYPE
    4. 6.4 GERMANY MARKET ANALYSIS BY ROUTE OF ADMINISTRATION
    5. 6.5 GERMANY MARKET ANALYSIS BY PATIENT POPULATION
    6. 6.6 KEY BUYING CRITERIA OF LIFE SCIENCES
    7. 6.7 RESEARCH PROCESS OF MRFR
    8. 6.8 DRO ANALYSIS OF LIFE SCIENCES
    9. 6.9 DRIVERS IMPACT ANALYSIS: LIFE SCIENCES
    10. 6.10 RESTRAINTS IMPACT ANALYSIS: LIFE SCIENCES
    11. 6.11 SUPPLY / VALUE CHAIN: LIFE SCIENCES
    12. 6.12 LIFE SCIENCES, BY DISEASE TYPE, 2024 (% SHARE)
    13. 6.13 LIFE SCIENCES, BY DISEASE TYPE, 2024 TO 2035 (USD Million)
    14. 6.14 LIFE SCIENCES, BY TREATMENT TYPE, 2024 (% SHARE)
    15. 6.15 LIFE SCIENCES, BY TREATMENT TYPE, 2024 TO 2035 (USD Million)
    16. 6.16 LIFE SCIENCES, BY ROUTE OF ADMINISTRATION, 2024 (% SHARE)
    17. 6.17 LIFE SCIENCES, BY ROUTE OF ADMINISTRATION, 2024 TO 2035 (USD Million)
    18. 6.18 LIFE SCIENCES, BY PATIENT POPULATION, 2024 (% SHARE)
    19. 6.19 LIFE SCIENCES, BY PATIENT POPULATION, 2024 TO 2035 (USD Million)
    20. 6.20 BENCHMARKING OF MAJOR COMPETITORS
  7. 7 LIST OF TABLES
    1. 7.1 LIST OF ASSUMPTIONS
  8. 7.1.1
    1. 7.2 Germany MARKET SIZE ESTIMATES; FORECAST
      1. 7.2.1 BY DISEASE TYPE, 2025-2035 (USD Million)
      2. 7.2.2 BY TREATMENT TYPE, 2025-2035 (USD Million)
      3. 7.2.3 BY ROUTE OF ADMINISTRATION, 2025-2035 (USD Million)
      4. 7.2.4 BY PATIENT POPULATION, 2025-2035 (USD Million)
    2. 7.3 PRODUCT LAUNCH/PRODUCT DEVELOPMENT/APPROVAL
  9. 7.3.1
    1. 7.4 ACQUISITION/PARTNERSHIP
  10. 7.4.1

Germany Life Sciences Market Segmentation

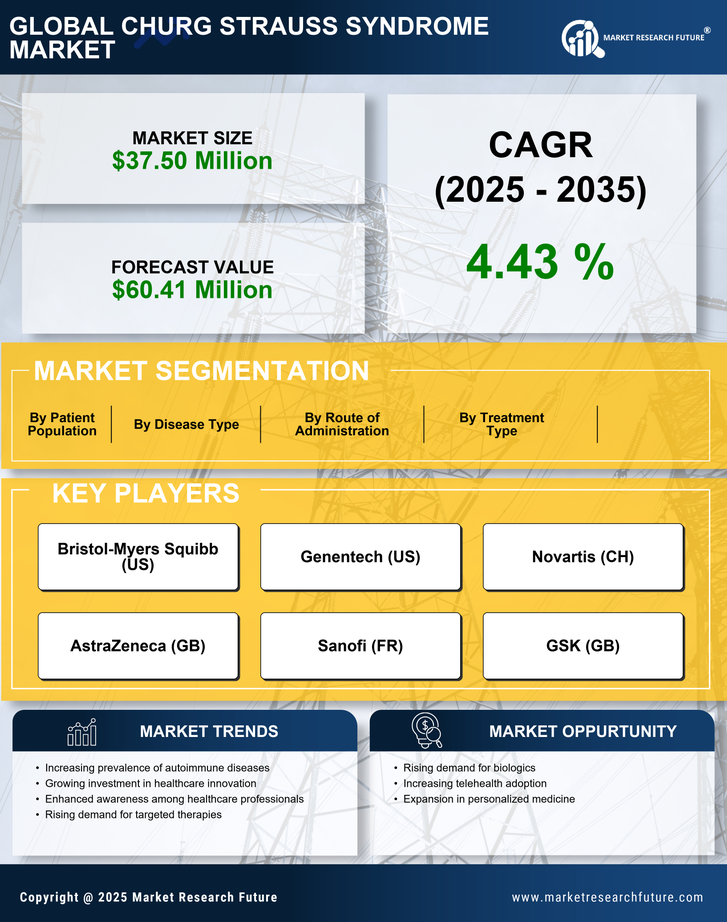
Life Sciences By Disease Type (USD Million, 2025-2035)

  • Eosinophilic Granulomatosis
  • Churg-Strauss Syndrome
  • Asthma

Life Sciences By Treatment Type (USD Million, 2025-2035)

  • Medication
  • Surgery
  • Therapy

Life Sciences By Route of Administration (USD Million, 2025-2035)

  • Oral
  • Intravenous
  • Subcutaneous

Life Sciences By Patient Population (USD Million, 2025-2035)

  • Adult Patients
  • Pediatric Patients
  • Geriatric Patients

Compare Licence

×
Features License Type
Single User Multiuser License Enterprise User
Price $4,950 $5,950 $7,250
Maximum User Access Limit 1 User Upto 10 Users Unrestricted Access Throughout the Organization
Free Customization
Direct Access to Analyst
Deliverable Format
Platform Access
Discount on Next Purchase 10% 15% 15%
Printable Versions