Request Free Sample ×

Kindly complete the form below to receive a free sample of this Report

* Please use a valid business email

Leading companies partner with us for data-driven Insights

clients tt-cursor
Hero Background

Germany ATC Market

ID: MRFR/AD/56317-HCR
128 Pages
Triveni Bhoyar
Last Updated: May 12, 2026

Germany ATC Market Size, Share, Industry Trend & Analysis Research Report: By Component (Hardware, Software, Services), By Airspace (Air Route Traffic Control Centers (ARTCC), Terminal Radar Approach Control (TRACON), Air Traffic Control Tower (ATCT), Remote Tower (RT)), By Application (Communication, Navigation, Surveillance, Automation), By Airport Size (Small, Medium, Large) andBy Sector (Military and Defense, Commercial)- Forecast to 2035

Share:
Download PDF ×

We do not share your information with anyone. However, we may send you emails based on your report interest from time to time. You may contact us at any time to opt-out.

Germany ATC Market Infographic
Purchase Options
  1. 1 SECTION I: EXECUTIVE SUMMARY AND KEY HIGHLIGHTS
  2.   1.1 EXECUTIVE SUMMARY
  3.     1.1.1 Market Overview
  4.     1.1.2 Key Findings
  5.     1.1.3 Market Segmentation
  6.     1.1.4 Competitive Landscape
  7.     1.1.5 Challenges and Opportunities
  8.     1.1.6 Future Outlook
  9. 2 SECTION II: SCOPING, METHODOLOGY AND MARKET STRUCTURE
  10.   2.1 MARKET INTRODUCTION
  11.     2.1.1 Definition
  12.     2.1.2 Scope of the study
  13.       2.1.2.1 Research Objective
  14.       2.1.2.2 Assumption
  15.       2.1.2.3 Limitations
  16.   2.2 RESEARCH METHODOLOGY
  17.     2.2.1 Overview
  18.     2.2.2 Data Mining
  19.     2.2.3 Secondary Research
  20.     2.2.4 Primary Research
  21.       2.2.4.1 Primary Interviews and Information Gathering Process
  22.       2.2.4.2 Breakdown of Primary Respondents
  23.     2.2.5 Forecasting Model
  24.     2.2.6 Market Size Estimation
  25.       2.2.6.1 Bottom-Up Approach
  26.       2.2.6.2 Top-Down Approach
  27.     2.2.7 Data Triangulation
  28.     2.2.8 Validation
  29. 3 SECTION III: QUALITATIVE ANALYSIS
  30.   3.1 MARKET DYNAMICS
  31.     3.1.1 Overview
  32.     3.1.2 Drivers
  33.     3.1.3 Restraints
  34.     3.1.4 Opportunities
  35.   3.2 MARKET FACTOR ANALYSIS
  36.     3.2.1 Value chain Analysis
  37.     3.2.2 Porter's Five Forces Analysis
  38.       3.2.2.1 Bargaining Power of Suppliers
  39.       3.2.2.2 Bargaining Power of Buyers
  40.       3.2.2.3 Threat of New Entrants
  41.       3.2.2.4 Threat of Substitutes
  42.       3.2.2.5 Intensity of Rivalry
  43.     3.2.3 COVID-19 Impact Analysis
  44.       3.2.3.1 Market Impact Analysis
  45.       3.2.3.2 Regional Impact
  46.       3.2.3.3 Opportunity and Threat Analysis
  47. 4 SECTION IV: QUANTITATIVE ANALYSIS
  48.   4.1 Life Sciences, BY Component (USD Billion)
  49.     4.1.1 Hardware
  50.     4.1.2 Software
  51.     4.1.3 Services
  52.   4.2 Life Sciences, BY Airspace (USD Billion)
  53.     4.2.1 Air Route Traffic Control Centers (ARTCC)
  54.     4.2.2 Terminal Radar Approach Control (TRACON)
  55.     4.2.3 Air Traffic Control Tower (ATCT)
  56.     4.2.4 Remote Tower (RT)
  57.   4.3 Life Sciences, BY Application (USD Billion)
  58.     4.3.1 Communication
  59.     4.3.2 Navigation
  60.     4.3.3 Surveillance
  61.     4.3.4 Automation
  62.   4.4 Life Sciences, BY Airport Size (USD Billion)
  63.     4.4.1 Small
  64.     4.4.2 Medium
  65.     4.4.3 Large
  66.   4.5 Life Sciences, BY Sector (USD Billion)
  67.     4.5.1 Military & Defense
  68.     4.5.2 Commercial
  69. 5 SECTION V: COMPETITIVE ANALYSIS
  70.   5.1 Competitive Landscape
  71.     5.1.1 Overview
  72.     5.1.2 Competitive Analysis
  73.     5.1.3 Market share Analysis
  74.     5.1.4 Major Growth Strategy in the Life Sciences
  75.     5.1.5 Competitive Benchmarking
  76.     5.1.6 Leading Players in Terms of Number of Developments in the Life Sciences
  77.     5.1.7 Key developments and growth strategies
  78.       5.1.7.1 New Product Launch/Service Deployment
  79.       5.1.7.2 Merger & Acquisitions
  80.       5.1.7.3 Joint Ventures
  81.     5.1.8 Major Players Financial Matrix
  82.       5.1.8.1 Sales and Operating Income
  83.       5.1.8.2 Major Players R&D Expenditure. 2023
  84.   5.2 Company Profiles
  85.     5.2.1 Thales Group (FR)
  86.       5.2.1.1 Financial Overview
  87.       5.2.1.2 Products Offered
  88.       5.2.1.3 Key Developments
  89.       5.2.1.4 SWOT Analysis
  90.       5.2.1.5 Key Strategies
  91.     5.2.2 Raytheon Technologies (US)
  92.       5.2.2.1 Financial Overview
  93.       5.2.2.2 Products Offered
  94.       5.2.2.3 Key Developments
  95.       5.2.2.4 SWOT Analysis
  96.       5.2.2.5 Key Strategies
  97.     5.2.3 Indra Sistemas (ES)
  98.       5.2.3.1 Financial Overview
  99.       5.2.3.2 Products Offered
  100.       5.2.3.3 Key Developments
  101.       5.2.3.4 SWOT Analysis
  102.       5.2.3.5 Key Strategies
  103.     5.2.4 Northrop Grumman (US)
  104.       5.2.4.1 Financial Overview
  105.       5.2.4.2 Products Offered
  106.       5.2.4.3 Key Developments
  107.       5.2.4.4 SWOT Analysis
  108.       5.2.4.5 Key Strategies
  109.     5.2.5 Leonardo S.p.A. (IT)
  110.       5.2.5.1 Financial Overview
  111.       5.2.5.2 Products Offered
  112.       5.2.5.3 Key Developments
  113.       5.2.5.4 SWOT Analysis
  114.       5.2.5.5 Key Strategies
  115.     5.2.6 Harris Corporation (US)
  116.       5.2.6.1 Financial Overview
  117.       5.2.6.2 Products Offered
  118.       5.2.6.3 Key Developments
  119.       5.2.6.4 SWOT Analysis
  120.       5.2.6.5 Key Strategies
  121.     5.2.7 Saab AB (SE)
  122.       5.2.7.1 Financial Overview
  123.       5.2.7.2 Products Offered
  124.       5.2.7.3 Key Developments
  125.       5.2.7.4 SWOT Analysis
  126.       5.2.7.5 Key Strategies
  127.     5.2.8 Frequentis AG (AT)
  128.       5.2.8.1 Financial Overview
  129.       5.2.8.2 Products Offered
  130.       5.2.8.3 Key Developments
  131.       5.2.8.4 SWOT Analysis
  132.       5.2.8.5 Key Strategies
  133.     5.2.9 Boeing (US)
  134.       5.2.9.1 Financial Overview
  135.       5.2.9.2 Products Offered
  136.       5.2.9.3 Key Developments
  137.       5.2.9.4 SWOT Analysis
  138.       5.2.9.5 Key Strategies
  139.   5.3 Appendix
  140.     5.3.1 References
  141.     5.3.2 Related Reports
  142. 6 LIST OF FIGURES
  143.   6.1 MARKET SYNOPSIS
  144.   6.2 GERMANY MARKET ANALYSIS BY COMPONENT
  145.   6.3 GERMANY MARKET ANALYSIS BY AIRSPACE
  146.   6.4 GERMANY MARKET ANALYSIS BY APPLICATION
  147.   6.5 GERMANY MARKET ANALYSIS BY AIRPORT SIZE
  148.   6.6 GERMANY MARKET ANALYSIS BY SECTOR
  149.   6.7 KEY BUYING CRITERIA OF LIFE SCIENCES
  150.   6.8 RESEARCH PROCESS OF MRFR
  151.   6.9 DRO ANALYSIS OF LIFE SCIENCES
  152.   6.10 DRIVERS IMPACT ANALYSIS: LIFE SCIENCES
  153.   6.11 RESTRAINTS IMPACT ANALYSIS: LIFE SCIENCES
  154.   6.12 SUPPLY / VALUE CHAIN: LIFE SCIENCES
  155.   6.13 LIFE SCIENCES, BY COMPONENT, 2024 (% SHARE)
  156.   6.14 LIFE SCIENCES, BY COMPONENT, 2024 TO 2035 (USD Billion)
  157.   6.15 LIFE SCIENCES, BY AIRSPACE, 2024 (% SHARE)
  158.   6.16 LIFE SCIENCES, BY AIRSPACE, 2024 TO 2035 (USD Billion)
  159.   6.17 LIFE SCIENCES, BY APPLICATION, 2024 (% SHARE)
  160.   6.18 LIFE SCIENCES, BY APPLICATION, 2024 TO 2035 (USD Billion)
  161.   6.19 LIFE SCIENCES, BY AIRPORT SIZE, 2024 (% SHARE)
  162.   6.20 LIFE SCIENCES, BY AIRPORT SIZE, 2024 TO 2035 (USD Billion)
  163.   6.21 LIFE SCIENCES, BY SECTOR, 2024 (% SHARE)
  164.   6.22 LIFE SCIENCES, BY SECTOR, 2024 TO 2035 (USD Billion)
  165.   6.23 BENCHMARKING OF MAJOR COMPETITORS
  166. 7 LIST OF TABLES
  167.   7.1 LIST OF ASSUMPTIONS
  168.     7.1.1
  169.   7.2 Germany MARKET SIZE ESTIMATES; FORECAST
  170.     7.2.1 BY COMPONENT, 2025-2035 (USD Billion)
  171.     7.2.2 BY AIRSPACE, 2025-2035 (USD Billion)
  172.     7.2.3 BY APPLICATION, 2025-2035 (USD Billion)
  173.     7.2.4 BY AIRPORT SIZE, 2025-2035 (USD Billion)
  174.     7.2.5 BY SECTOR, 2025-2035 (USD Billion)
  175.   7.3 PRODUCT LAUNCH/PRODUCT DEVELOPMENT/APPROVAL
  176.     7.3.1
  177.   7.4 ACQUISITION/PARTNERSHIP
  178.     7.4.1

Germany Life Sciences Market Segmentation

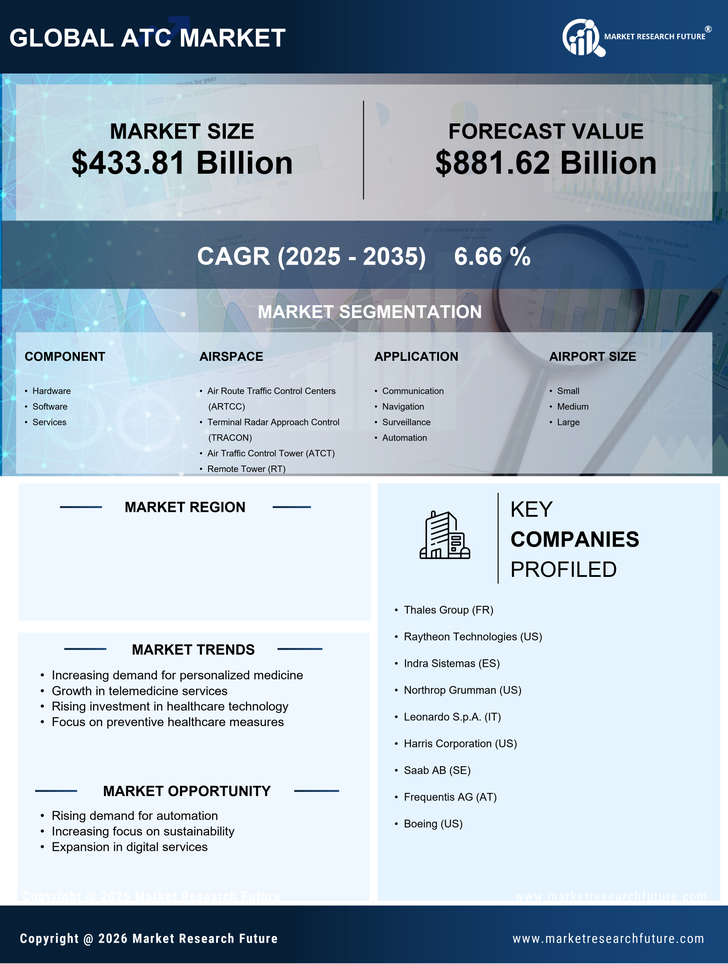
Life Sciences By Component (USD Billion, 2025-2035)

  • Hardware
  • Software
  • Services

Life Sciences By Airspace (USD Billion, 2025-2035)

  • Air Route Traffic Control Centers (ARTCC)
  • Terminal Radar Approach Control (TRACON)
  • Air Traffic Control Tower (ATCT)
  • Remote Tower (RT)

Life Sciences By Application (USD Billion, 2025-2035)

  • Communication
  • Navigation
  • Surveillance
  • Automation

Life Sciences By Airport Size (USD Billion, 2025-2035)

  • Small
  • Medium
  • Large

Life Sciences By Sector (USD Billion, 2025-2035)

  • Military & Defense
  • Commercial

Compare Licence

×
Features License Type
Single User Multiuser License Enterprise User
Price $4,950 $5,950 $7,250
Maximum User Access Limit 1 User Upto 10 Users Unrestricted Access Throughout the Organization
Free Customization
Direct Access to Analyst
Deliverable Format
Platform Access
Discount on Next Purchase 10% 15% 15%
Printable Versions