×
  • Cat-intel
  • MedIntelliX
  • Resources
  • About Us
  • Hero Background
    English
    Chinese
    French
    Japanese
    Korean
    German
    Spanish

    Geomarketing Market Share

    ID: MRFR/ICT/6601-HCR
    200 Pages
    Aarti Dhapte
    October 2025

    Geo Market Research Report By Application (Urban Development, Environmental Monitoring, Disaster Management, Natural Resource Management), By Technology (Geospatial Analysis, Remote Sensing, GPS Technology, Geographic Information System), By End Use (Government, Commercial, Academic, Non-Profit Organizations), By Data Type (Vector Data, Raster Data, Point Cloud Data) and By Regional (North Amer...

    Share:
    Download PDF ×

    We do not share your information with anyone. However, we may send you emails based on your report interest from time to time. You may contact us at any time to opt-out.

    Geomarketing Market Infographic
    Purchase Options

    Market Share

    Geomarketing Market Share Analysis

    GeoMarket trends represent a confluence of geospatial technology and market dynamics leading towards a transformative wave that is redefining industries and economies across borders (Cooke & Pinto 2009, p69). In order to understand multiple layers of GeoMarket trendiness, it's impossible not to mention location-based data and analytics that have been trying everything together since last year when people discovered how good they could be for them when making decisions about their lives while simultaneously buying things online at home or shopping downtown without any idea on where exactly we were going into next month ahead after this week ended yesterday before lunch time came which still feels like tomorrow morning due soon enough if i go off track here too much longer plus all these wordy sentences just keep popping up now if you know what i mean by wordy sentences those really long ones having so many words inside each one because every clause will have its own verb somewhere while others might contain another subject which relates back somehow but there may never even be any object whatsoever since some do not really require one anyway until later when we least expect them as though nothing else ever existed except these two things called us humans. The retail industry has exemplified this through personalized marketing strategies informed by Geomarket trends as well as locality-based services. In a bid to understand consumer actions, retail firms now employ geospatial data to select the best store addresses and regionalize promotional campaigns. The integration of location intelligence is enabling businesses to enhance customer experiences by providing real-time offers and targeted advertisements.

    GeoMarket trends are making a significant impact on the logistics and transportation industry. The use of geospatial technologies for optimizing routes, fleet management, and supply chain logistics is on the rise. Real-time shipment tracking and predictive analytics have helped to reduce expenses and improve overall efficiency. Geomarket technology trends have also transformed agriculture. Precision farming using satellite imagery and GPS technology is improving crop yields as well as resource utilization. By analyzing geospatial data, farmers can make accurate decisions regarding planting, irrigation, and fertilization processes, thus increasing productivity while promoting sustainable agriculture practices. This change in farmers' thinking, which allows them to monitor the health of crops properly, is completely changing agriculture.

    In urban planning and development, smart cities are being created through GeoMarket trends, which play an important role in creating eco-friendly cities. Geospatial data enables city planners to analyze population density traffic patterns as well as environmental factors so that they make informed decisions on what should be done in the city accordingly. The energy sector is using GeoMarket trends to optimize exploration and extraction procedures. Location-based information guides in discerning where oil or gas may be found while lessening drilling operations' effects on the environment, hence saving costs. Otherwise, other sources like IoT devices are responsible for most of these increases. Large data analysis about any region will not appear full without integrating it with other relevant information, such as climatic conditions, among others. Thus, problems such as standardization, privacy, and interoperability become more prevalent with time due to this dynamic market. The application of geographical information systems is increasingly gaining wider recognition for its ability to enable service providers to deal responsibly with their customers. As a result, relevant bodies are busy trying many ways to ensure that different geospatial technologies used across diverse platforms do not conflict with each other.

    Author
    Aarti Dhapte
    Team Lead - Research

    She holds an experience of about 6+ years in Market Research and Business Consulting, working under the spectrum of Information Communication Technology, Telecommunications and Semiconductor domains. Aarti conceptualizes and implements a scalable business strategy and provides strategic leadership to the clients. Her expertise lies in market estimation, competitive intelligence, pipeline analysis, customer assessment, etc.

    Leave a Comment

    FAQs

    What was the projected market size of the Geo Market in 2024?

    The projected market size of the Geo Market in 2024 was 57.67 USD Billion.

    What will the Geo Market be valued at in 2035?

    The Geo Market is expected to be valued at 85.2 USD Billion in 2035.

    What is the expected CAGR for the Geo Market from 2025 to 2035?

    The expected CAGR for the Geo Market from 2025 to 2035 is 3.61%.

    Which application segment of the Geo Market is valued the highest in 2024?

    The application segment of Natural Resource Management was valued the highest at 22.0 USD Billion in 2024.

    What is the market size for Urban Development in the Geo Market by 2035?

    The market size for Urban Development in the Geo Market is expected to reach 20.3 USD Billion by 2035.

    Which region held the largest market share in the Geo Market in 2024?

    North America held the largest market share in the Geo Market with a valuation of 20.0 USD Billion in 2024.

    What is the anticipated market size for the Asia Pacific region in 2035?

    The anticipated market size for the Asia Pacific region in 2035 is 18.0 USD Billion.

    What was the market size for Environmental Monitoring in 2024 within the Geo Market?

    The market size for Environmental Monitoring in 2024 was valued at 12.0 USD Billion.

    Who are the key players in the Geo Market?

    Key players in the Geo Market include Facebook, Microsoft, Oracle, and Google, among others.

    What will the market size for Disaster Management be in 2035?

    The market size for Disaster Management is expected to reach 13.5 USD Billion by 2035.

    Market Summary

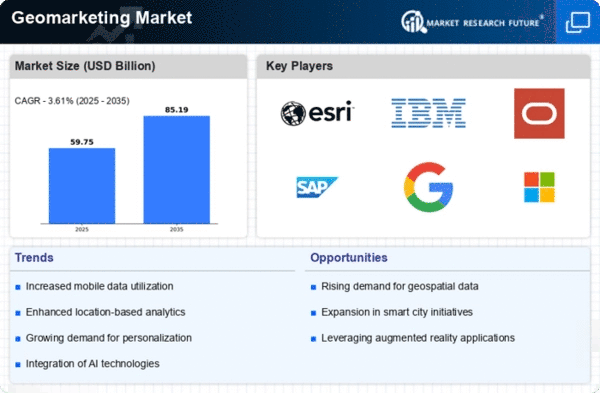
    The Global Geo Market is projected to grow from 57.7 USD Billion in 2024 to 85.2 USD Billion by 2035.

    Key Market Trends & Highlights

    Geo Key Trends and Highlights

    • The market valuation is expected to reach 85.2 USD Billion by the year 2035.
    • A compound annual growth rate of 3.61 percent is anticipated from 2025 to 2035.
    • Starting at 57.7 USD Billion in 2024, the market demonstrates a steady growth trajectory.
    • Growing adoption of geo technologies due to increasing demand for accurate data analytics is a major market driver.

    Market Size & Forecast

    2024 Market Size 57.7 (USD Billion)
    2035 Market Size 85.2 (USD Billion)
    CAGR (2025-2035) 3.61%
    Largest Regional Market Share in 2024 latin_america)

    Major Players

    Facebook, Microsoft, Oracle, NVIDIA, Qualcomm, Alibaba, IBM, Google, Intel, Apple, Cisco, SAP, Salesforce, Amazon, Tencent

    Market Trends

    Technological advancements and increased urbanization are the primary market influencers driving the current significant evolution of the Geo Market. Infrastructure development is being prioritized by governments worldwide, resulting in increased investment in spatial data analytics and geographic information systems (GIS).

    In recent years, there has been a trend toward increased collaboration between the public and private sectors in the sharing of geo-data, which has contributed to the expansion of the available information. The landscape has been significantly altered by the recent emergence of drones and satellite imagery, which have enabled the accumulation of real-time data that is indispensable for a variety of applications in urban planning, forestry, and agriculture.

    Geomarketing Market Market Drivers

    Market Growth Projections

    The Global Geo Market Industry is poised for substantial growth, with projections indicating a market size of 57.7 USD Billion in 2024 and an anticipated increase to 85.2 USD Billion by 2035. This growth trajectory reflects the increasing reliance on geo-spatial data across various sectors, including urban planning, environmental management, and disaster response. The industry is expected to experience a compound annual growth rate (CAGR) of 3.61% from 2025 to 2035, highlighting the ongoing demand for innovative geo-data solutions and technologies.

    Technological Advancements

    The Global Geo Market Industry is experiencing a surge in technological advancements that enhance data collection and analysis. Innovations such as satellite imagery, Geographic Information Systems (GIS), and remote sensing technologies are revolutionizing how geographical data is utilized. These technologies enable more accurate mapping and spatial analysis, which is crucial for urban planning, environmental monitoring, and disaster management. As a result, the industry is projected to reach 57.7 USD Billion in 2024, driven by the increasing demand for precise geographical information across various sectors.

    Integration of Big Data and AI

    The integration of big data analytics and artificial intelligence (AI) into the Global Geo Market Industry is transforming how geographical information is processed and utilized. These technologies enable the analysis of vast datasets, leading to more informed decision-making and predictive modeling. For instance, AI algorithms can identify patterns in geographical data that may not be apparent through traditional methods. This integration enhances the capabilities of geo-spatial applications in various sectors, including agriculture, transportation, and public health, thereby driving market growth and innovation.

    Growing Demand for Urban Planning

    Urbanization is a significant driver in the Global Geo Market Industry, as cities expand and require effective planning solutions. The need for sustainable urban development has led to an increased reliance on geographical data to inform infrastructure projects, transportation systems, and resource management. Governments and municipalities are investing in geo-spatial technologies to optimize land use and improve public services. This trend is expected to contribute to the industry's growth, with projections indicating a market size of 85.2 USD Billion by 2035, reflecting the critical role of geo-data in shaping urban environments.

    Government Initiatives and Funding

    Government initiatives and funding are crucial drivers of growth in the Global Geo Market Industry. Many governments are recognizing the importance of geo-spatial data for national security, infrastructure development, and environmental management. As a result, they are investing in geo-data projects and establishing policies that promote the use of geographical information systems. These initiatives not only enhance the capabilities of public services but also stimulate private sector involvement in geo-data solutions, contributing to the overall expansion of the market.

    Environmental Monitoring and Management

    The Global Geo Market Industry plays a vital role in environmental monitoring and management, particularly in the context of climate change and natural resource conservation. Geographic data is essential for tracking environmental changes, assessing biodiversity, and managing natural disasters. Organizations and governments utilize geo-spatial technologies to develop strategies for sustainable resource use and environmental protection. As awareness of environmental issues grows, the demand for geo-data solutions is likely to increase, supporting a compound annual growth rate (CAGR) of 3.61% from 2025 to 2035.

    Market Segment Insights

    Geo Market Segment Insights

    Geo Market Segment Insights

    Geo Market Application Insights

    Geo Market Application Insights

    The Application segment of the Geo Market plays a crucial role in addressing various challenges faced by society, including urbanization, environmental concerns, and resource management. In 2024, the overall market was valued at 57.67 USD Billion, substantiating the growing demand for Geo Market applications.

    Within this segment, Urban Development is a key driver, valued at 14.5 USD Billion in 2024 and reaching 20.3 USD Billion by 2035, reflecting its importance in smart city planning and infrastructure development, which are essential for accommodating the increasing global urban population.Environmental Monitoring is also significant, with a current valuation of 12.0 USD Billion in 2024 and anticipated growth to 17.5 USD Billion by 2035; this reflects the rising need for sustainable environmental practices and tracking climate changes, which are critical in mitigating environmental degradation.

    Disaster Management, valued at 9.17 USD Billion in 2024, is set to grow to 13.5 USD Billion by 2035; this area is vital in reducing the impact of natural disasters through effective planning and response strategies, thereby ensuring community resilience and safety.Similarly, Natural Resource Management dominates the landscape with a valuation of 22.0 USD Billion in 2024, expanding to 34.9 USD Billion by 2035, indicating its significant role in the sustainable extraction and management of essential resources such as water, minerals, and energy.

    Together, these applications highlight the Geo Market's revenue potential while showcasing the segmentation's pivotal function in driving efficiency and promoting sustainable practices across various sectors. The growth dynamics in these areas present abundant opportunities, as they align closely with global sustainability goals and regulatory frameworks that advocate for responsible resource use and environmental stewardship.Such trends not only support the market growth but also underline the importance of these applications in promoting safer, more resilient societies in a rapidly changing world.

    Geo Market Technology Insights

    Geo Market Technology Insights

    The Technology segment of the Geo Market has witnessed substantial growth and is expected to remain pivotal in the coming years. In 2024, the Geo Market market was valued at 57.67 USD Billion, highlighting the increasing demand for advanced technological solutions.

    Within this segment, Geospatial Analysis has emerged as a critical tool, utilizing spatial data to drive informed decision-making in various sectors, including urban planning and environmental management. Remote Sensing techniques provide invaluable data for monitoring environmental changes and managing resources, thereby supporting sustainability efforts globally.GPS Technology is further transforming navigation and logistics, enhancing efficiency in transportation and telecommunications. Geographic Information System serves as a backbone for data visualization and analysis, enabling organizations to manage and analyze geographical data efficiently.

    As the Geo Market revenue continues to expand, advancements in these areas drive market growth, offering opportunities to optimize processes while addressing challenges such as data security and integration. The future of the Geo Market industry looks promising with innovative developments and increasing adoption across multiple sectors.

    Geo Market End Use Insights

    Geo Market End Use Insights

    The Geo Market market, reached a valuation of 57.67 billion USD in 2024, shows diverse applications across various End Use categories such as Government, Commercial, Academic, and Non-Profit Organizations. Each of these sectors plays a crucial role in driving the market forward.

    The Government sector is a key player, leveraging geo-services for infrastructure development and urban planning, contributing significantly to overall Geo Market revenue. The Commercial sector is characterized by businesses utilizing geo-data for marketing strategies, resource management, and logistics optimization, thus demonstrating remarkable growth potential.In the Educational realm, Academic institutions increasingly rely on geo-analytical tools for research and curriculum enhancement, highlighting the importance of innovation in this segment. Non-Profit Organizations utilize geo-information to drive social initiatives and ensure efficient resource allocation, making their contribution vital for community development.

    The global demand for geo-based solutions is further spurred by rising internet penetration and advancements in technology, fostering increased collaboration across these sectors and driving Geo Market growth.Understanding these segments and their interdependencies provides a strategic insight into the overall Geo Market Statistics and enhances the understanding of market dynamics.

    Geo Market Data Type Insights

    Geo Market Data Type Insights

    The Geo Market focuses significantly on the Data Type segment, which encompasses various formats essential for geographic information systems (GIS) and spatial analysis. In 2024, the overall Geo Market revenue reached 57.67 USD Billion.

    Within this segment, Vector Data plays a crucial role as it offers precise representations of geographic features like roads and boundaries, making it invaluable for urban planning and infrastructure development. Raster Data, known for its grid of pixels, provides rich visual information, contributing significantly to environmental monitoring and remote sensing.Point Cloud Data, generated from 3D scanning technologies, is increasingly important for applications in construction and topographic mapping. The Geo Market statistics reflect robust growth in these data types driven by advancements in technology, increasing demand for geographic data analytics, and the evolving needs of industries such as transportation and telecommunications.

    Despite challenges like data privacy and integration issues, the opportunities for the efficient use of these data types continue to expand, enhancing decision-making processes in various sectors globally.

    Get more detailed insights about Geomarketing Market Research Report - Global Forecast till 2035

    Regional Insights

    The Geo Market revenue demonstrates a diverse landscape across various regions, with North America held as a prominent player valued at 20.0 USD Billion in 2024, anticipated to grow significantly to 28.0 USD Billion by 2035. Europe follows closely, reflecting a robust market at 15.0 USD Billion in 2024, projected to ascend to 21.0 USD Billion in 2035, driven by technological advancements and sustainable practices.

    Meanwhile, the Asia Pacific region, valued at 12.0 USD Billion in 2024, is set to enhance its presence with a forecasted value of 18.0 USD Billion by 2035, buoyed by rapid urbanization and industrialization.South America and the Middle East and Africa show smaller but notable market values, with South America at 5.0 USD Billion, increasing to 7.0 USD Billion, and the Middle East and Africa at 5.67 USD Billion, projected to grow to 11.2 USD Billion by 2035.

    The growth drivers in these regions stem from increasing demand for geo-based solutions and geographic information systems, enhancing market growth and presenting substantial opportunities within the Geo Market industry. Each region's dynamics are essential for understanding Geo Market statistics and segmentation, highlighting their individual contributions to the overall market landscape.

    Geo Market Regional Insights

    Key Players and Competitive Insights

    The competitive insights of the Geo Market reveal a dynamic landscape characterized by rapid technological advancements and shifting consumer preferences. The market is influenced by various factors such as globalization, digitalization, and evolving regulatory frameworks that shape competitive dynamics across industries.

    As enterprises strive to establish or maintain their market share, strategic positioning, innovation, and collaboration have become crucial elements in navigating this highly competitive environment. The Geo Market is populated with companies leveraging unique strengths, whether through advanced technology solutions, robust branding, or extensive customer engagement strategies, allowing them to carve out significant niches within the global framework.Facebook has a formidable presence in the Geo Market, capitalizing on its vast user base and aggressive digital advertising strategies.

    The platform's strength lies in its unparalleled ability to connect with diverse demographics, offering advertisers targeted access to audiences based on detailed user data. Its social networking capabilities not only enhance user retention but also foster an engaged community that enables high interaction rates with brands and services.

    Furthermore, Facebook's continual investment in innovative technologies, such as augmented reality and advanced data analytics, empowers it to attract advertisers seeking effective engagement tools. These strengths position Facebook as a leading player in the Geo Market, where it remains a vital channel for digital marketing and brand engagement.Microsoft also holds a prominent position in the Geo Market, driven by its comprehensive suite of technology products and services. Key offerings, including Windows operating systems, Office productivity suites, and cloud computing solutions through Azure, emphasize its commitment to serving both individual consumers and enterprise clients alike.

    As part of its strategy, Microsoft has actively pursued mergers and acquisitions to bolster its market presence and expand its capabilities, consistently integrating innovative technologies to enhance its product offerings.

    These strategic maneuvers have not only expanded Microsoft’s reach but have also reinforced its reputation as a leader in solutions that drive digital transformation. With a focus on cloud services and artificial intelligence, Microsoft is well-positioned to leverage the growing demand for digital solutions in the Geo Market, solidifying its competitive edge.

    Key Companies in the Geomarketing Market market include

    Industry Developments

    Geo Market dynamics are witnessing significant movements, with companies like Facebook, Microsoft, and Oracle leading the charge in innovation and market strategy. Qualcomm showcased on-device AI applications on Snapdragon-powered Windows 11 devices at Microsoft Build 2023. This partnership, which was also demonstrated at Computex, emphasizes a partnership to introduce 5G and periphery AI to PCs through the Snapdragon X platform, rather than a standalone August 2023 telecom partnership.

    IBM has intensified its partnership with SAP in the development of hybrid-cloud and generative AI solutions. In mid-2024, they implemented RISE with SAP on IBM Power Virtual Server, which provides enterprise clients with efficient SAP cloud migrations that include embedded AI services.

    Intel's market capitalization was approximately US$147.9 billion as of September 29, 2023, with a share price of approximately $34.97.

    Future Outlook

    Geomarketing Market Future Outlook

    The Global Geo Market is projected to grow at a 3.61% CAGR from 2024 to 2035, driven by technological advancements, increasing demand for geospatial data, and sustainable practices.

    New opportunities lie in:

    • Develop advanced geospatial analytics platforms for urban planning.
    • Invest in AI-driven predictive modeling for environmental monitoring.
    • Create partnerships with tech firms to enhance data integration capabilities.

    By 2035, the Global Geo Market is expected to achieve robust growth, positioning itself as a critical sector in the global economy.

    Market Segmentation

    Geo Market Application Outlook

    • Urban Development
    • Environmental Monitoring
    • Disaster Management
    • Natural Resource Management

    Report Scope

    Report Attribute/Metric

    Details

    Market Size 2023

    55.66 (USD Billion)

    Market Size 2024

    57.67 (USD Billion)

    Market Size 2035

    85.2 (USD Billion)

    Compound Annual Growth Rate (CAGR)

    3.61% (2025 - 2035)

    Report Coverage

    Revenue Forecast, Competitive Landscape, Growth Factors, and Trends

    Base Year

    2024

    Market Forecast Period

    2025 - 2035

    Historical Data

    2019 - 2024

    Market Forecast Units

    USD Billion

    Key Companies Profiled

    Facebook, Microsoft, Oracle, NVIDIA, Qualcomm, Alibaba, IBM, Google, Intel, Apple, Cisco, SAP, Salesforce, Amazon, Tencent

    Segments Covered

    Application, Technology, End Use, Data Type, Regional

    Key Market Opportunities

    Smart city development initiatives, Geographic Information System (GIS) advancements, Remote sensing technologies growth, Sustainable resource management practices, Climate change adaptation solutions

    Key Market Dynamics

    technological advancements, regulatory changes, environmental sustainability, consumer behavior shifts, competitive landscape

    Countries Covered

    North America, Europe, APAC, South America, MEA

    FAQs

    What was the projected market size of the Geo Market in 2024?

    The projected market size of the Geo Market in 2024 was 57.67 USD Billion.

    What will the Geo Market be valued at in 2035?

    The Geo Market is expected to be valued at 85.2 USD Billion in 2035.

    What is the expected CAGR for the Geo Market from 2025 to 2035?

    The expected CAGR for the Geo Market from 2025 to 2035 is 3.61%.

    Which application segment of the Geo Market is valued the highest in 2024?

    The application segment of Natural Resource Management was valued the highest at 22.0 USD Billion in 2024.

    What is the market size for Urban Development in the Geo Market by 2035?

    The market size for Urban Development in the Geo Market is expected to reach 20.3 USD Billion by 2035.

    Which region held the largest market share in the Geo Market in 2024?

    North America held the largest market share in the Geo Market with a valuation of 20.0 USD Billion in 2024.

    What is the anticipated market size for the Asia Pacific region in 2035?

    The anticipated market size for the Asia Pacific region in 2035 is 18.0 USD Billion.

    What was the market size for Environmental Monitoring in 2024 within the Geo Market?

    The market size for Environmental Monitoring in 2024 was valued at 12.0 USD Billion.

    Who are the key players in the Geo Market?

    Key players in the Geo Market include Facebook, Microsoft, Oracle, and Google, among others.

    What will the market size for Disaster Management be in 2035?

    The market size for Disaster Management is expected to reach 13.5 USD Billion by 2035.

    1. EXECUTIVE SUMMARY
      1. Market
      2. Overview
      3. Key Findings
      4. Market Segmentation
      5. Competitive
      6. Landscape
      7. Challenges and Opportunities
      8. Future Outlook
    2. MARKET INTRODUCTION
      1. Definition
      2. Scope
      3. of the study
      4. Research Objective
      5. Assumption
      6. Limitations
    3. RESEARCH METHODOLOGY
      1. Overview
      2. Data
      3. Mining
      4. Secondary Research
      5. Primary Research
      6. Primary Interviews
      7. and Information Gathering Process
      8. Breakdown of Primary Respondents
      9. Forecasting Model
      10. Market Size Estimation
      11. Bottom-Up Approach
      12. Top-Down
      13. Approach
      14. Data Triangulation
      15. Validation
    4. MARKET DYNAMICS
      1. Overview
      2. Drivers
      3. Restraints
      4. Opportunities
    5. MARKET FACTOR ANALYSIS
      1. Value chain Analysis
      2. Porter's
      3. Five Forces Analysis
      4. Bargaining Power of Suppliers
      5. Bargaining
      6. Power of Buyers
      7. Threat of New Entrants
      8. Threat of Substitutes
      9. Intensity
      10. of Rivalry
      11. COVID-19
      12. Impact Analysis
      13. Market Impact Analysis
      14. Regional Impact
      15. Opportunity
      16. and Threat Analysis
      17. GeoMarket, BY Application (USD Billion)
      18. Urban Development
      19. Environmental Monitoring
      20. Disaster
      21. Management
      22. Natural Resource Management
      23. GeoMarket, BY Technology (USD Billion)
      24. Geospatial Analysis
      25. Remote Sensing
      26. GPS Technology
      27. Geographic Information System
      28. GeoMarket, BY End Use (USD Billion)
      29. Government
      30. Commercial
      31. Academic
      32. Non-Profit
      33. Organizations
      34. GeoMarket,
      35. BY Data Type (USD Billion)
      36. Vector
      37. Data
      38. Raster Data
      39. Point Cloud Data
      40. GeoMarket,
      41. BY Regional (USD Billion)
      42. North America
      43. US
      44. Canada
      45. Europe
      46. Germany
      47. UK
      48. France
      49. Russia
      50. Italy
      51. Spain
      52. Rest
      53. of Europe
      54. APAC
      55. China
      56. India
      57. Japan
      58. South
      59. Korea
      60. Malaysia
      61. Thailand
      62. Indonesia
      63. Rest
      64. of APAC
      65. South America
      66. Brazil
      67. Mexico
      68. Argentina
      69. Rest
      70. of South America
      71. MEA
      72. GCC
      73. Countries
      74. South Africa
      75. Rest of MEA
      76. Competitive Landscape
      77. Overview
      78. Competitive
      79. Analysis
      80. Market share Analysis
      81. Major Growth Strategy in the GeoMarket
      82. Competitive Benchmarking
      83. Leading Players in Terms of Number of Developments in the GeoMarket
      84. Key developments and growth strategies
      85. New
      86. Product Launch/Service Deployment
      87. Merger & Acquisitions
      88. Joint
      89. Ventures
      90. Major Players
      91. Financial Matrix
      92. Sales and Operating Income
      93. Major Players
      94. R&D Expenditure. 2023
      95. Company Profiles
      96. Amazon
      97. Financial Overview
      98. Products
      99. Offered
      100. Key Developments
      101. SWOT Analysis
      102. Key Strategies
      103. IBM
      104. Financial Overview
      105. Products
      106. Offered
      107. Key Developments
      108. SWOT Analysis
      109. Key Strategies
      110. Esri
      111. Financial Overview
      112. Products
      113. Offered
      114. Key Developments
      115. SWOT Analysis
      116. Key Strategies
      117. SAP
      118. Financial Overview
      119. Products
      120. Offered
      121. Key Developments
      122. SWOT Analysis
      123. Key Strategies
      124. Salesforce
      125. Financial Overview
      126. Products
      127. Offered
      128. Key Developments
      129. SWOT Analysis
      130. Key Strategies
      131. Google
      132. Financial Overview
      133. Products
      134. Offered
      135. Key Developments
      136. SWOT Analysis
      137. Key Strategies
      138. Apple
      139. Financial Overview
      140. Products
      141. Offered
      142. Key Developments
      143. SWOT Analysis
      144. Key Strategies
      145. Geotab
      146. Financial Overview
      147. Products
      148. Offered
      149. Key Developments
      150. SWOT Analysis
      151. Key Strategies
      152. Intel
      153. Financial Overview
      154. Products
      155. Offered
      156. Key Developments
      157. SWOT Analysis
      158. Key Strategies
      159. Microsoft
      160. Financial Overview
      161. Products
      162. Offered
      163. Key Developments
      164. SWOT Analysis
      165. Key Strategies
      166. Qualcomm
      167. Financial Overview
      168. Products
      169. Offered
      170. Key Developments
      171. SWOT Analysis
      172. Key Strategies
      173. Nvidia
      174. Financial Overview
      175. Products
      176. Offered
      177. Key Developments
      178. SWOT Analysis
      179. Key Strategies
      180. Cisco
      181. Financial Overview
      182. Products
      183. Offered
      184. Key Developments
      185. SWOT Analysis
      186. Key Strategies
      187. HERE Technologies
      188. Financial Overview
      189. Products
      190. Offered
      191. Key Developments
      192. SWOT Analysis
      193. Key Strategies
      194. Oracle
      195. Financial Overview
      196. Products
      197. Offered
      198. Key Developments
      199. SWOT Analysis
      200. Key Strategies
      201. Appendix
      202. References
      203. Related Reports
      204. LIST
      205. Of tables
    6. LIST OF ASSUMPTIONS
      1. North
      2. America GeoMarket SIZE ESTIMATES & FORECAST, BY APPLICATION, 2019-2035 (USD
      3. Billions)
      4. North America GeoMarket SIZE ESTIMATES & FORECAST, BY
      5. TECHNOLOGY, 2019-2035 (USD Billions)
      6. North America GeoMarket SIZE ESTIMATES
      7. & FORECAST, BY END USE, 2019-2035 (USD Billions)
      8. North America GeoMarket
      9. SIZE ESTIMATES & FORECAST, BY DATA TYPE, 2019-2035 (USD Billions)
      10. North
      11. America GeoMarket SIZE ESTIMATES & FORECAST, BY REGIONAL, 2019-2035 (USD Billions)
      12. US
      13. GeoMarket SIZE ESTIMATES & FORECAST, BY APPLICATION, 2019-2035 (USD Billions)
      14. US
      15. GeoMarket SIZE ESTIMATES & FORECAST, BY TECHNOLOGY, 2019-2035 (USD Billions)
      16. US
      17. GeoMarket SIZE ESTIMATES & FORECAST, BY END USE, 2019-2035 (USD Billions)
      18. US
      19. GeoMarket SIZE ESTIMATES & FORECAST, BY DATA TYPE, 2019-2035 (USD Billions)
      20. US
      21. GeoMarket SIZE ESTIMATES & FORECAST, BY REGIONAL, 2019-2035 (USD Billions)
      22. Canada
      23. GeoMarket SIZE ESTIMATES & FORECAST, BY APPLICATION, 2019-2035 (USD Billions)
      24. Canada
      25. GeoMarket SIZE ESTIMATES & FORECAST, BY TECHNOLOGY, 2019-2035 (USD Billions)
      26. Canada
      27. GeoMarket SIZE ESTIMATES & FORECAST, BY END USE, 2019-2035 (USD Billions)
      28. Canada
      29. GeoMarket SIZE ESTIMATES & FORECAST, BY DATA TYPE, 2019-2035 (USD Billions)
      30. Canada
      31. GeoMarket SIZE ESTIMATES & FORECAST, BY REGIONAL, 2019-2035 (USD Billions)
      32. Europe
      33. GeoMarket SIZE ESTIMATES & FORECAST, BY APPLICATION, 2019-2035 (USD Billions)
      34. Europe
      35. GeoMarket SIZE ESTIMATES & FORECAST, BY TECHNOLOGY, 2019-2035 (USD Billions)
      36. Europe
      37. GeoMarket SIZE ESTIMATES & FORECAST, BY END USE, 2019-2035 (USD Billions)
      38. Europe
      39. GeoMarket SIZE ESTIMATES & FORECAST, BY DATA TYPE, 2019-2035 (USD Billions)
      40. Europe
      41. GeoMarket SIZE ESTIMATES & FORECAST, BY REGIONAL, 2019-2035 (USD Billions)
      42. Germany
      43. GeoMarket SIZE ESTIMATES & FORECAST, BY APPLICATION, 2019-2035 (USD Billions)
      44. Germany
      45. GeoMarket SIZE ESTIMATES & FORECAST, BY TECHNOLOGY, 2019-2035 (USD Billions)
      46. Germany
      47. GeoMarket SIZE ESTIMATES & FORECAST, BY END USE, 2019-2035 (USD Billions)
      48. Germany
      49. GeoMarket SIZE ESTIMATES & FORECAST, BY DATA TYPE, 2019-2035 (USD Billions)
      50. Germany
      51. GeoMarket SIZE ESTIMATES & FORECAST, BY REGIONAL, 2019-2035 (USD Billions)
      52. UK
      53. GeoMarket SIZE ESTIMATES & FORECAST, BY APPLICATION, 2019-2035 (USD Billions)
      54. UK
      55. GeoMarket SIZE ESTIMATES & FORECAST, BY TECHNOLOGY, 2019-2035 (USD Billions)
      56. UK
      57. GeoMarket SIZE ESTIMATES & FORECAST, BY END USE, 2019-2035 (USD Billions)
      58. UK
      59. GeoMarket SIZE ESTIMATES & FORECAST, BY DATA TYPE, 2019-2035 (USD Billions)
      60. UK
      61. GeoMarket SIZE ESTIMATES & FORECAST, BY REGIONAL, 2019-2035 (USD Billions)
      62. France
      63. GeoMarket SIZE ESTIMATES & FORECAST, BY APPLICATION, 2019-2035 (USD Billions)
      64. France
      65. GeoMarket SIZE ESTIMATES & FORECAST, BY TECHNOLOGY, 2019-2035 (USD Billions)
      66. France
      67. GeoMarket SIZE ESTIMATES & FORECAST, BY END USE, 2019-2035 (USD Billions)
      68. France
      69. GeoMarket SIZE ESTIMATES & FORECAST, BY DATA TYPE, 2019-2035 (USD Billions)
      70. France
      71. GeoMarket SIZE ESTIMATES & FORECAST, BY REGIONAL, 2019-2035 (USD Billions)
      72. Russia
      73. GeoMarket SIZE ESTIMATES & FORECAST, BY APPLICATION, 2019-2035 (USD Billions)
      74. Russia
      75. GeoMarket SIZE ESTIMATES & FORECAST, BY TECHNOLOGY, 2019-2035 (USD Billions)
      76. Russia
      77. GeoMarket SIZE ESTIMATES & FORECAST, BY END USE, 2019-2035 (USD Billions)
      78. Russia
      79. GeoMarket SIZE ESTIMATES & FORECAST, BY DATA TYPE, 2019-2035 (USD Billions)
      80. Russia
      81. GeoMarket SIZE ESTIMATES & FORECAST, BY REGIONAL, 2019-2035 (USD Billions)
      82. Italy
      83. GeoMarket SIZE ESTIMATES & FORECAST, BY APPLICATION, 2019-2035 (USD Billions)
      84. Italy
      85. GeoMarket SIZE ESTIMATES & FORECAST, BY TECHNOLOGY, 2019-2035 (USD Billions)
      86. Italy
      87. GeoMarket SIZE ESTIMATES & FORECAST, BY END USE, 2019-2035 (USD Billions)
      88. Italy
      89. GeoMarket SIZE ESTIMATES & FORECAST, BY DATA TYPE, 2019-2035 (USD Billions)
      90. Italy
      91. GeoMarket SIZE ESTIMATES & FORECAST, BY REGIONAL, 2019-2035 (USD Billions)
      92. Spain
      93. GeoMarket SIZE ESTIMATES & FORECAST, BY APPLICATION, 2019-2035 (USD Billions)
      94. Spain
      95. GeoMarket SIZE ESTIMATES & FORECAST, BY TECHNOLOGY, 2019-2035 (USD Billions)
      96. Spain
      97. GeoMarket SIZE ESTIMATES & FORECAST, BY END USE, 2019-2035 (USD Billions)
      98. Spain
      99. GeoMarket SIZE ESTIMATES & FORECAST, BY DATA TYPE, 2019-2035 (USD Billions)
      100. Spain
      101. GeoMarket SIZE ESTIMATES & FORECAST, BY REGIONAL, 2019-2035 (USD Billions)
      102. Rest
      103. of Europe GeoMarket SIZE ESTIMATES & FORECAST, BY APPLICATION, 2019-2035 (USD
      104. Billions)
      105. Rest of Europe GeoMarket SIZE ESTIMATES & FORECAST, BY
      106. TECHNOLOGY, 2019-2035 (USD Billions)
      107. Rest of Europe GeoMarket SIZE ESTIMATES
      108. & FORECAST, BY END USE, 2019-2035 (USD Billions)
      109. Rest of Europe
      110. GeoMarket SIZE ESTIMATES & FORECAST, BY DATA TYPE, 2019-2035 (USD Billions)
      111. Rest
      112. of Europe GeoMarket SIZE ESTIMATES & FORECAST, BY REGIONAL, 2019-2035 (USD Billions)
      113. APAC
      114. GeoMarket SIZE ESTIMATES & FORECAST, BY APPLICATION, 2019-2035 (USD Billions)
      115. APAC
      116. GeoMarket SIZE ESTIMATES & FORECAST, BY TECHNOLOGY, 2019-2035 (USD Billions)
      117. APAC
      118. GeoMarket SIZE ESTIMATES & FORECAST, BY END USE, 2019-2035 (USD Billions)
      119. APAC
      120. GeoMarket SIZE ESTIMATES & FORECAST, BY DATA TYPE, 2019-2035 (USD Billions)
      121. APAC
      122. GeoMarket SIZE ESTIMATES & FORECAST, BY REGIONAL, 2019-2035 (USD Billions)
      123. China
      124. GeoMarket SIZE ESTIMATES & FORECAST, BY APPLICATION, 2019-2035 (USD Billions)
      125. China
      126. GeoMarket SIZE ESTIMATES & FORECAST, BY TECHNOLOGY, 2019-2035 (USD Billions)
      127. China
      128. GeoMarket SIZE ESTIMATES & FORECAST, BY END USE, 2019-2035 (USD Billions)
      129. China
      130. GeoMarket SIZE ESTIMATES & FORECAST, BY DATA TYPE, 2019-2035 (USD Billions)
      131. China
      132. GeoMarket SIZE ESTIMATES & FORECAST, BY REGIONAL, 2019-2035 (USD Billions)
      133. India
      134. GeoMarket SIZE ESTIMATES & FORECAST, BY APPLICATION, 2019-2035 (USD Billions)
      135. India
      136. GeoMarket SIZE ESTIMATES & FORECAST, BY TECHNOLOGY, 2019-2035 (USD Billions)
      137. India
      138. GeoMarket SIZE ESTIMATES & FORECAST, BY END USE, 2019-2035 (USD Billions)
      139. India
      140. GeoMarket SIZE ESTIMATES & FORECAST, BY DATA TYPE, 2019-2035 (USD Billions)
      141. India
      142. GeoMarket SIZE ESTIMATES & FORECAST, BY REGIONAL, 2019-2035 (USD Billions)
      143. Japan
      144. GeoMarket SIZE ESTIMATES & FORECAST, BY APPLICATION, 2019-2035 (USD Billions)
      145. Japan
      146. GeoMarket SIZE ESTIMATES & FORECAST, BY TECHNOLOGY, 2019-2035 (USD Billions)
      147. Japan
      148. GeoMarket SIZE ESTIMATES & FORECAST, BY END USE, 2019-2035 (USD Billions)
      149. Japan
      150. GeoMarket SIZE ESTIMATES & FORECAST, BY DATA TYPE, 2019-2035 (USD Billions)
      151. Japan
      152. GeoMarket SIZE ESTIMATES & FORECAST, BY REGIONAL, 2019-2035 (USD Billions)
      153. South
      154. Korea GeoMarket SIZE ESTIMATES & FORECAST, BY APPLICATION, 2019-2035 (USD Billions)
      155. South
      156. Korea GeoMarket SIZE ESTIMATES & FORECAST, BY TECHNOLOGY, 2019-2035 (USD Billions)
      157. South
      158. Korea GeoMarket SIZE ESTIMATES & FORECAST, BY END USE, 2019-2035 (USD Billions)
      159. South
      160. Korea GeoMarket SIZE ESTIMATES & FORECAST, BY DATA TYPE, 2019-2035 (USD Billions)
      161. South
      162. Korea GeoMarket SIZE ESTIMATES & FORECAST, BY REGIONAL, 2019-2035 (USD Billions)
      163. Malaysia
      164. GeoMarket SIZE ESTIMATES & FORECAST, BY APPLICATION, 2019-2035 (USD Billions)
      165. Malaysia
      166. GeoMarket SIZE ESTIMATES & FORECAST, BY TECHNOLOGY, 2019-2035 (USD Billions)
      167. Malaysia
      168. GeoMarket SIZE ESTIMATES & FORECAST, BY END USE, 2019-2035 (USD Billions)
      169. Malaysia
      170. GeoMarket SIZE ESTIMATES & FORECAST, BY DATA TYPE, 2019-2035 (USD Billions)
      171. Malaysia
      172. GeoMarket SIZE ESTIMATES & FORECAST, BY REGIONAL, 2019-2035 (USD Billions)
      173. Thailand
      174. GeoMarket SIZE ESTIMATES & FORECAST, BY APPLICATION, 2019-2035 (USD Billions)
      175. Thailand
      176. GeoMarket SIZE ESTIMATES & FORECAST, BY TECHNOLOGY, 2019-2035 (USD Billions)
      177. Thailand
      178. GeoMarket SIZE ESTIMATES & FORECAST, BY END USE, 2019-2035 (USD Billions)
      179. Thailand
      180. GeoMarket SIZE ESTIMATES & FORECAST, BY DATA TYPE, 2019-2035 (USD Billions)
      181. Thailand
      182. GeoMarket SIZE ESTIMATES & FORECAST, BY REGIONAL, 2019-2035 (USD Billions)
      183. Indonesia
      184. GeoMarket SIZE ESTIMATES & FORECAST, BY APPLICATION, 2019-2035 (USD Billions)
      185. Indonesia
      186. GeoMarket SIZE ESTIMATES & FORECAST, BY TECHNOLOGY, 2019-2035 (USD Billions)
      187. Indonesia
      188. GeoMarket SIZE ESTIMATES & FORECAST, BY END USE, 2019-2035 (USD Billions)
      189. Indonesia
      190. GeoMarket SIZE ESTIMATES & FORECAST, BY DATA TYPE, 2019-2035 (USD Billions)
      191. Indonesia
      192. GeoMarket SIZE ESTIMATES & FORECAST, BY REGIONAL, 2019-2035 (USD Billions)
      193. Rest
      194. of APAC GeoMarket SIZE ESTIMATES & FORECAST, BY APPLICATION, 2019-2035 (USD
      195. Billions)
      196. Rest of APAC GeoMarket SIZE ESTIMATES & FORECAST, BY TECHNOLOGY,
      197. Rest of APAC GeoMarket SIZE ESTIMATES &
      198. FORECAST, BY END USE, 2019-2035 (USD Billions)
      199. Rest of APAC GeoMarket
      200. SIZE ESTIMATES & FORECAST, BY DATA TYPE, 2019-2035 (USD Billions)
      201. Rest
      202. of APAC GeoMarket SIZE ESTIMATES & FORECAST, BY REGIONAL, 2019-2035 (USD Billions)
      203. South
      204. America GeoMarket SIZE ESTIMATES & FORECAST, BY APPLICATION, 2019-2035 (USD
      205. Billions)
      206. South America GeoMarket SIZE ESTIMATES & FORECAST, BY
      207. TECHNOLOGY, 2019-2035 (USD Billions)
      208. South America GeoMarket SIZE ESTIMATES
      209. & FORECAST, BY END USE, 2019-2035 (USD Billions)
      210. South America GeoMarket
      211. SIZE ESTIMATES & FORECAST, BY DATA TYPE, 2019-2035 (USD Billions)
      212. South
      213. America GeoMarket SIZE ESTIMATES & FORECAST, BY REGIONAL, 2019-2035 (USD Billions)
      214. Brazil
      215. GeoMarket SIZE ESTIMATES & FORECAST, BY APPLICATION, 2019-2035 (USD Billions)
      216. Brazil
      217. GeoMarket SIZE ESTIMATES & FORECAST, BY TECHNOLOGY, 2019-2035 (USD Billions)
      218. Brazil
      219. GeoMarket SIZE ESTIMATES & FORECAST, BY END USE, 2019-2035 (USD Billions)
      220. Brazil
      221. GeoMarket SIZE ESTIMATES & FORECAST, BY DATA TYPE, 2019-2035 (USD Billions)
      222. Brazil
      223. GeoMarket SIZE ESTIMATES & FORECAST, BY REGIONAL, 2019-2035 (USD Billions)
      224. Mexico
      225. GeoMarket SIZE ESTIMATES & FORECAST, BY APPLICATION, 2019-2035 (USD Billions)
      226. Mexico
      227. GeoMarket SIZE ESTIMATES & FORECAST, BY TECHNOLOGY, 2019-2035 (USD Billions)
      228. Mexico
      229. GeoMarket SIZE ESTIMATES & FORECAST, BY END USE, 2019-2035 (USD Billions)
      230. Mexico
      231. GeoMarket SIZE ESTIMATES & FORECAST, BY DATA TYPE, 2019-2035 (USD Billions)
      232. Mexico
      233. GeoMarket SIZE ESTIMATES & FORECAST, BY REGIONAL, 2019-2035 (USD Billions)
      234. Argentina
      235. GeoMarket SIZE ESTIMATES & FORECAST, BY APPLICATION, 2019-2035 (USD Billions)
      236. Argentina
      237. GeoMarket SIZE ESTIMATES & FORECAST, BY TECHNOLOGY, 2019-2035 (USD Billions)
      238. Argentina
      239. GeoMarket SIZE ESTIMATES & FORECAST, BY END USE, 2019-2035 (USD Billions)
      240. Argentina
      241. GeoMarket SIZE ESTIMATES & FORECAST, BY DATA TYPE, 2019-2035 (USD Billions)
      242. Argentina
      243. GeoMarket SIZE ESTIMATES & FORECAST, BY REGIONAL, 2019-2035 (USD Billions)
      244. Rest
      245. of South America GeoMarket SIZE ESTIMATES & FORECAST, BY APPLICATION, 2019-2035
      246. (USD Billions)
      247. Rest of South America GeoMarket SIZE ESTIMATES &
      248. FORECAST, BY TECHNOLOGY, 2019-2035 (USD Billions)
      249. Rest of South America
      250. GeoMarket SIZE ESTIMATES & FORECAST, BY END USE, 2019-2035 (USD Billions)
      251. Rest
      252. of South America GeoMarket SIZE ESTIMATES & FORECAST, BY DATA TYPE, 2019-2035
      253. (USD Billions)
      254. Rest of South America GeoMarket SIZE ESTIMATES &
      255. FORECAST, BY REGIONAL, 2019-2035 (USD Billions)
      256. MEA GeoMarket SIZE ESTIMATES
      257. & FORECAST, BY APPLICATION, 2019-2035 (USD Billions)
      258. MEA GeoMarket
      259. SIZE ESTIMATES & FORECAST, BY TECHNOLOGY, 2019-2035 (USD Billions)
      260. MEA
      261. GeoMarket SIZE ESTIMATES & FORECAST, BY END USE, 2019-2035 (USD Billions)
      262. MEA
      263. GeoMarket SIZE ESTIMATES & FORECAST, BY DATA TYPE, 2019-2035 (USD Billions)
      264. MEA
      265. GeoMarket SIZE ESTIMATES & FORECAST, BY REGIONAL, 2019-2035 (USD Billions)
      266. GCC
      267. Countries GeoMarket SIZE ESTIMATES & FORECAST, BY APPLICATION, 2019-2035 (USD
      268. Billions)
      269. GCC Countries GeoMarket SIZE ESTIMATES & FORECAST, BY
      270. TECHNOLOGY, 2019-2035 (USD Billions)
      271. GCC Countries GeoMarket SIZE ESTIMATES
      272. & FORECAST, BY END USE, 2019-2035 (USD Billions)
      273. GCC Countries GeoMarket
      274. SIZE ESTIMATES & FORECAST, BY DATA TYPE, 2019-2035 (USD Billions)
      275. GCC
      276. Countries GeoMarket SIZE ESTIMATES & FORECAST, BY REGIONAL, 2019-2035 (USD Billions)
      277. South
      278. Africa GeoMarket SIZE ESTIMATES & FORECAST, BY APPLICATION, 2019-2035 (USD Billions)
      279. South
      280. Africa GeoMarket SIZE ESTIMATES & FORECAST, BY TECHNOLOGY, 2019-2035 (USD Billions)
      281. South
      282. Africa GeoMarket SIZE ESTIMATES & FORECAST, BY END USE, 2019-2035 (USD Billions)
      283. South
      284. Africa GeoMarket SIZE ESTIMATES & FORECAST, BY DATA TYPE, 2019-2035 (USD Billions)
      285. South
      286. Africa GeoMarket SIZE ESTIMATES & FORECAST, BY REGIONAL, 2019-2035 (USD Billions)
      287. Rest
      288. of MEA GeoMarket SIZE ESTIMATES & FORECAST, BY APPLICATION, 2019-2035 (USD Billions)
      289. Rest
      290. of MEA GeoMarket SIZE ESTIMATES & FORECAST, BY TECHNOLOGY, 2019-2035 (USD Billions)
      291. Rest
      292. of MEA GeoMarket SIZE ESTIMATES & FORECAST, BY END USE, 2019-2035 (USD Billions)
      293. Rest
      294. of MEA GeoMarket SIZE ESTIMATES & FORECAST, BY DATA TYPE, 2019-2035 (USD Billions)
      295. Rest
      296. of MEA GeoMarket SIZE ESTIMATES & FORECAST, BY REGIONAL, 2019-2035 (USD Billions)
      297. PRODUCT
      298. LAUNCH/PRODUCT DEVELOPMENT/APPROVAL
      299. ACQUISITION/PARTNERSHIP
      300. LIST
      301. Of figures
    7. MARKET SYNOPSIS
    8. NORTH AMERICA GEOMARKET ANALYSIS
      1. US GEOMARKET ANALYSIS BY APPLICATION
      2. US GEOMARKET ANALYSIS BY TECHNOLOGY
      3. US
      4. GEOMARKET ANALYSIS BY END USE
    9. US GEOMARKET
      1. ANALYSIS BY DATA TYPE
    10. US GEOMARKET ANALYSIS
      1. BY REGIONAL
    11. CANADA GEOMARKET ANALYSIS
      1. BY APPLICATION
    12. CANADA GEOMARKET ANALYSIS
      1. BY TECHNOLOGY
    13. CANADA GEOMARKET ANALYSIS
      1. BY END USE
    14. CANADA GEOMARKET ANALYSIS
      1. BY DATA TYPE
    15. CANADA GEOMARKET ANALYSIS
      1. BY REGIONAL
    16. EUROPE GEOMARKET ANALYSIS
      1. GERMANY GEOMARKET ANALYSIS BY APPLICATION
      2. GERMANY GEOMARKET ANALYSIS BY TECHNOLOGY
      3. GERMANY GEOMARKET ANALYSIS BY END USE
      4. GERMANY GEOMARKET ANALYSIS BY DATA TYPE
      5. GERMANY GEOMARKET ANALYSIS BY REGIONAL
      6. UK GEOMARKET ANALYSIS BY APPLICATION
      7. UK GEOMARKET ANALYSIS BY TECHNOLOGY
      8. UK GEOMARKET ANALYSIS BY END USE
      9. UK
      10. GEOMARKET ANALYSIS BY DATA TYPE
    17. UK GEOMARKET
      1. ANALYSIS BY REGIONAL
    18. FRANCE GEOMARKET
      1. ANALYSIS BY APPLICATION
    19. FRANCE GEOMARKET
      1. ANALYSIS BY TECHNOLOGY
    20. FRANCE GEOMARKET
      1. ANALYSIS BY END USE
    21. FRANCE GEOMARKET
      1. ANALYSIS BY DATA TYPE
    22. FRANCE GEOMARKET
      1. ANALYSIS BY REGIONAL
    23. RUSSIA GEOMARKET
      1. ANALYSIS BY APPLICATION
    24. RUSSIA GEOMARKET
      1. ANALYSIS BY TECHNOLOGY
    25. RUSSIA GEOMARKET
      1. ANALYSIS BY END USE
    26. RUSSIA GEOMARKET
      1. ANALYSIS BY DATA TYPE
    27. RUSSIA GEOMARKET
      1. ANALYSIS BY REGIONAL
    28. ITALY GEOMARKET
      1. ANALYSIS BY APPLICATION
    29. ITALY GEOMARKET
      1. ANALYSIS BY TECHNOLOGY
    30. ITALY GEOMARKET
      1. ANALYSIS BY END USE
    31. ITALY GEOMARKET ANALYSIS
      1. BY DATA TYPE
    32. ITALY GEOMARKET ANALYSIS
      1. BY REGIONAL
    33. SPAIN GEOMARKET ANALYSIS
      1. BY APPLICATION
    34. SPAIN GEOMARKET ANALYSIS
      1. BY TECHNOLOGY
    35. SPAIN GEOMARKET ANALYSIS
      1. BY END USE
      2. SPAIN GEOMARKET ANALYSIS BY
      3. DATA TYPE
      4. SPAIN GEOMARKET ANALYSIS BY
      5. REGIONAL
    36. REST OF EUROPE GEOMARKET ANALYSIS
      1. BY APPLICATION
    37. REST OF EUROPE GEOMARKET
      1. ANALYSIS BY TECHNOLOGY
      2. REST OF EUROPE
      3. GEOMARKET ANALYSIS BY END USE
      4. REST OF
      5. EUROPE GEOMARKET ANALYSIS BY DATA TYPE
      6. REST
      7. OF EUROPE GEOMARKET ANALYSIS BY REGIONAL
      8. APAC
    38. GEOMARKET ANALYSIS
    39. CHINA GEOMARKET ANALYSIS
      1. BY APPLICATION
    40. CHINA GEOMARKET ANALYSIS
      1. BY TECHNOLOGY
    41. CHINA GEOMARKET ANALYSIS
      1. BY END USE
      2. CHINA GEOMARKET ANALYSIS BY
      3. DATA TYPE
      4. CHINA GEOMARKET ANALYSIS BY
      5. REGIONAL
      6. INDIA GEOMARKET ANALYSIS BY
      7. APPLICATION
    42. INDIA GEOMARKET ANALYSIS
      1. BY TECHNOLOGY
    43. INDIA GEOMARKET ANALYSIS
      1. BY END USE
      2. INDIA GEOMARKET ANALYSIS BY
      3. DATA TYPE
      4. INDIA GEOMARKET ANALYSIS BY
      5. REGIONAL
      6. JAPAN GEOMARKET ANALYSIS BY
      7. APPLICATION
    44. JAPAN GEOMARKET ANALYSIS
      1. BY TECHNOLOGY
    45. JAPAN GEOMARKET ANALYSIS
      1. BY END USE
      2. JAPAN GEOMARKET ANALYSIS BY
      3. DATA TYPE
      4. JAPAN GEOMARKET ANALYSIS BY
      5. REGIONAL
    46. SOUTH KOREA GEOMARKET ANALYSIS
      1. BY APPLICATION
    47. SOUTH KOREA GEOMARKET
      1. ANALYSIS BY TECHNOLOGY
    48. SOUTH KOREA GEOMARKET
      1. ANALYSIS BY END USE
    49. SOUTH KOREA GEOMARKET
      1. ANALYSIS BY DATA TYPE
    50. SOUTH KOREA GEOMARKET
      1. ANALYSIS BY REGIONAL
    51. MALAYSIA GEOMARKET
      1. ANALYSIS BY APPLICATION
    52. MALAYSIA GEOMARKET
      1. ANALYSIS BY TECHNOLOGY
    53. MALAYSIA GEOMARKET
      1. ANALYSIS BY END USE
    54. MALAYSIA GEOMARKET
      1. ANALYSIS BY DATA TYPE
    55. MALAYSIA GEOMARKET
      1. ANALYSIS BY REGIONAL
    56. THAILAND GEOMARKET
      1. ANALYSIS BY APPLICATION
    57. THAILAND GEOMARKET
      1. ANALYSIS BY TECHNOLOGY
    58. THAILAND GEOMARKET
      1. ANALYSIS BY END USE
    59. THAILAND GEOMARKET
      1. ANALYSIS BY DATA TYPE
    60. THAILAND GEOMARKET
      1. ANALYSIS BY REGIONAL
    61. INDONESIA GEOMARKET
      1. ANALYSIS BY APPLICATION
    62. INDONESIA GEOMARKET
      1. ANALYSIS BY TECHNOLOGY
    63. INDONESIA GEOMARKET
      1. ANALYSIS BY END USE
    64. INDONESIA GEOMARKET
      1. ANALYSIS BY DATA TYPE
    65. INDONESIA GEOMARKET
      1. ANALYSIS BY REGIONAL
    66. REST OF APAC GEOMARKET
      1. ANALYSIS BY APPLICATION
      2. REST OF APAC
      3. GEOMARKET ANALYSIS BY TECHNOLOGY
      4. REST
      5. OF APAC GEOMARKET ANALYSIS BY END USE
      6. REST
      7. OF APAC GEOMARKET ANALYSIS BY DATA TYPE
      8. REST
      9. OF APAC GEOMARKET ANALYSIS BY REGIONAL
      10. SOUTH
    67. AMERICA GEOMARKET ANALYSIS
    68. BRAZIL GEOMARKET
      1. ANALYSIS BY APPLICATION
    69. BRAZIL GEOMARKET
      1. ANALYSIS BY TECHNOLOGY
    70. BRAZIL GEOMARKET
      1. ANALYSIS BY END USE
    71. BRAZIL GEOMARKET
      1. ANALYSIS BY DATA TYPE
    72. BRAZIL GEOMARKET
      1. ANALYSIS BY REGIONAL
    73. MEXICO GEOMARKET
      1. ANALYSIS BY APPLICATION
    74. MEXICO GEOMARKET
      1. ANALYSIS BY TECHNOLOGY
    75. MEXICO GEOMARKET
      1. ANALYSIS BY END USE
    76. MEXICO GEOMARKET
      1. ANALYSIS BY DATA TYPE
    77. MEXICO GEOMARKET
      1. ANALYSIS BY REGIONAL
    78. ARGENTINA GEOMARKET
      1. ANALYSIS BY APPLICATION
    79. ARGENTINA GEOMARKET
      1. ANALYSIS BY TECHNOLOGY
    80. ARGENTINA GEOMARKET
      1. ANALYSIS BY END USE
    81. ARGENTINA GEOMARKET
      1. ANALYSIS BY DATA TYPE
    82. ARGENTINA GEOMARKET
      1. ANALYSIS BY REGIONAL
      2. REST OF SOUTH AMERICA
      3. GEOMARKET ANALYSIS BY APPLICATION
      4. REST
      5. OF SOUTH AMERICA GEOMARKET ANALYSIS BY TECHNOLOGY
      6. REST OF SOUTH AMERICA GEOMARKET ANALYSIS BY END USE
      7. REST OF SOUTH AMERICA GEOMARKET ANALYSIS BY DATA TYPE
      8. REST OF SOUTH AMERICA GEOMARKET ANALYSIS BY REGIONAL
    83. MEA GEOMARKET ANALYSIS
      1. GCC
      2. COUNTRIES GEOMARKET ANALYSIS BY APPLICATION
      3. GCC
      4. COUNTRIES GEOMARKET ANALYSIS BY TECHNOLOGY
      5. GCC
      6. COUNTRIES GEOMARKET ANALYSIS BY END USE
      7. GCC
      8. COUNTRIES GEOMARKET ANALYSIS BY DATA TYPE
      9. GCC
      10. COUNTRIES GEOMARKET ANALYSIS BY REGIONAL
      11. SOUTH
      12. AFRICA GEOMARKET ANALYSIS BY APPLICATION
      13. SOUTH
      14. AFRICA GEOMARKET ANALYSIS BY TECHNOLOGY
      15. SOUTH
      16. AFRICA GEOMARKET ANALYSIS BY END USE
      17. SOUTH
      18. AFRICA GEOMARKET ANALYSIS BY DATA TYPE
      19. SOUTH
      20. AFRICA GEOMARKET ANALYSIS BY REGIONAL
      21. REST
      22. OF MEA GEOMARKET ANALYSIS BY APPLICATION
      23. REST
      24. OF MEA GEOMARKET ANALYSIS BY TECHNOLOGY
      25. REST
      26. OF MEA GEOMARKET ANALYSIS BY END USE
      27. REST
      28. OF MEA GEOMARKET ANALYSIS BY DATA TYPE
      29. REST
      30. OF MEA GEOMARKET ANALYSIS BY REGIONAL
      31. KEY
    84. BUYING CRITERIA OF GEOMARKET
      1. RESEARCH
      2. PROCESS OF MRFR
    85. DRO ANALYSIS OF GEOMARKET
      1. DRIVERS IMPACT ANALYSIS: GEOMARKET
      2. RESTRAINTS IMPACT ANALYSIS: GEOMARKET
      3. SUPPLY / VALUE CHAIN: GEOMARKET
      4. GEOMARKET,
      5. BY APPLICATION, 2025 (% SHARE)
      6. GEOMARKET,
      7. BY APPLICATION, 2019 TO 2035 (USD Billions)
      8. GEOMARKET,
      9. BY TECHNOLOGY, 2025 (% SHARE)
      10. GEOMARKET,
      11. BY TECHNOLOGY, 2019 TO 2035 (USD Billions)
      12. GEOMARKET,
      13. BY END USE, 2025 (% SHARE)
      14. GEOMARKET,
      15. BY END USE, 2019 TO 2035 (USD Billions)
      16. GEOMARKET,
      17. BY DATA TYPE, 2025 (% SHARE)
      18. GEOMARKET,
      19. BY DATA TYPE, 2019 TO 2035 (USD Billions)
      20. GEOMARKET,
      21. BY REGIONAL, 2025 (% SHARE)
      22. GEOMARKET,
      23. BY REGIONAL, 2019 TO 2035 (USD Billions)
      24. BENCHMARKING
      25. OF MAJOR COMPETITORS

    Geo Market Segmentation

    • GeoMarket By Application (USD Billion, 2019-2035)

      • Urban Development
      • Environmental Monitoring
      • Disaster Management
      • Natural Resource Management
    • GeoMarket By Technology (USD Billion, 2019-2035)

      • Geospatial Analysis
      • Remote Sensing
      • GPS Technology
      • Geographic Information System
    • GeoMarket By End Use (USD Billion, 2019-2035)

      • Government
      • Commercial
      • Academic
      • Non-Profit Organizations
    • GeoMarket By Data Type (USD Billion, 2019-2035)

      • Vector Data
      • Raster Data
      • Point Cloud Data
    • GeoMarket By Regional (USD Billion, 2019-2035)

      • North America
      • Europe
      • South America
      • Asia Pacific
      • Middle East and Africa

    GeoMarket Regional Outlook (USD Billion, 2019-2035)

    • North America Outlook (USD Billion, 2019-2035)

      • North America GeoMarket by Application Type

        • Urban Development
        • Environmental Monitoring
        • Disaster Management
        • Natural Resource Management
      • North America GeoMarket by Technology Type

        • Geospatial Analysis
        • Remote Sensing
        • GPS Technology
        • Geographic Information System
      • North America GeoMarket by End Use Type

        • Government
        • Commercial
        • Academic
        • Non-Profit Organizations
      • North America GeoMarket by Data Type

        • Vector Data
        • Raster Data
        • Point Cloud Data
      • North America GeoMarket by Regional Type

        • US
        • Canada
      • US Outlook (USD Billion, 2019-2035)
      • US GeoMarket by Application Type

        • Urban Development
        • Environmental Monitoring
        • Disaster Management
        • Natural Resource Management
      • US GeoMarket by Technology Type

        • Geospatial Analysis
        • Remote Sensing
        • GPS Technology
        • Geographic Information System
      • US GeoMarket by End Use Type

        • Government
        • Commercial
        • Academic
        • Non-Profit Organizations
      • US GeoMarket by Data Type

        • Vector Data
        • Raster Data
        • Point Cloud Data
      • CANADA Outlook (USD Billion, 2019-2035)
      • CANADA GeoMarket by Application Type

        • Urban Development
        • Environmental Monitoring
        • Disaster Management
        • Natural Resource Management
      • CANADA GeoMarket by Technology Type

        • Geospatial Analysis
        • Remote Sensing
        • GPS Technology
        • Geographic Information System
      • CANADA GeoMarket by End Use Type

        • Government
        • Commercial
        • Academic
        • Non-Profit Organizations
      • CANADA GeoMarket by Data Type

        • Vector Data
        • Raster Data
        • Point Cloud Data
    • Europe Outlook (USD Billion, 2019-2035)

      • Europe GeoMarket by Application Type

        • Urban Development
        • Environmental Monitoring
        • Disaster Management
        • Natural Resource Management
      • Europe GeoMarket by Technology Type

        • Geospatial Analysis
        • Remote Sensing
        • GPS Technology
        • Geographic Information System
      • Europe GeoMarket by End Use Type

        • Government
        • Commercial
        • Academic
        • Non-Profit Organizations
      • Europe GeoMarket by Data Type

        • Vector Data
        • Raster Data
        • Point Cloud Data
      • Europe GeoMarket by Regional Type

        • Germany
        • UK
        • France
        • Russia
        • Italy
        • Spain
        • Rest of Europe
      • GERMANY Outlook (USD Billion, 2019-2035)
      • GERMANY GeoMarket by Application Type

        • Urban Development
        • Environmental Monitoring
        • Disaster Management
        • Natural Resource Management
      • GERMANY GeoMarket by Technology Type

        • Geospatial Analysis
        • Remote Sensing
        • GPS Technology
        • Geographic Information System
      • GERMANY GeoMarket by End Use Type

        • Government
        • Commercial
        • Academic
        • Non-Profit Organizations
      • GERMANY GeoMarket by Data Type

        • Vector Data
        • Raster Data
        • Point Cloud Data
      • UK Outlook (USD Billion, 2019-2035)
      • UK GeoMarket by Application Type

        • Urban Development
        • Environmental Monitoring
        • Disaster Management
        • Natural Resource Management
      • UK GeoMarket by Technology Type

        • Geospatial Analysis
        • Remote Sensing
        • GPS Technology
        • Geographic Information System
      • UK GeoMarket by End Use Type

        • Government
        • Commercial
        • Academic
        • Non-Profit Organizations
      • UK GeoMarket by Data Type

        • Vector Data
        • Raster Data
        • Point Cloud Data
      • FRANCE Outlook (USD Billion, 2019-2035)
      • FRANCE GeoMarket by Application Type

        • Urban Development
        • Environmental Monitoring
        • Disaster Management
        • Natural Resource Management
      • FRANCE GeoMarket by Technology Type

        • Geospatial Analysis
        • Remote Sensing
        • GPS Technology
        • Geographic Information System
      • FRANCE GeoMarket by End Use Type

        • Government
        • Commercial
        • Academic
        • Non-Profit Organizations
      • FRANCE GeoMarket by Data Type

        • Vector Data
        • Raster Data
        • Point Cloud Data
      • RUSSIA Outlook (USD Billion, 2019-2035)
      • RUSSIA GeoMarket by Application Type

        • Urban Development
        • Environmental Monitoring
        • Disaster Management
        • Natural Resource Management
      • RUSSIA GeoMarket by Technology Type

        • Geospatial Analysis
        • Remote Sensing
        • GPS Technology
        • Geographic Information System
      • RUSSIA GeoMarket by End Use Type

        • Government
        • Commercial
        • Academic
        • Non-Profit Organizations
      • RUSSIA GeoMarket by Data Type

        • Vector Data
        • Raster Data
        • Point Cloud Data
      • ITALY Outlook (USD Billion, 2019-2035)
      • ITALY GeoMarket by Application Type

        • Urban Development
        • Environmental Monitoring
        • Disaster Management
        • Natural Resource Management
      • ITALY GeoMarket by Technology Type

        • Geospatial Analysis
        • Remote Sensing
        • GPS Technology
        • Geographic Information System
      • ITALY GeoMarket by End Use Type

        • Government
        • Commercial
        • Academic
        • Non-Profit Organizations
      • ITALY GeoMarket by Data Type

        • Vector Data
        • Raster Data
        • Point Cloud Data
      • SPAIN Outlook (USD Billion, 2019-2035)
      • SPAIN GeoMarket by Application Type

        • Urban Development
        • Environmental Monitoring
        • Disaster Management
        • Natural Resource Management
      • SPAIN GeoMarket by Technology Type

        • Geospatial Analysis
        • Remote Sensing
        • GPS Technology
        • Geographic Information System
      • SPAIN GeoMarket by End Use Type

        • Government
        • Commercial
        • Academic
        • Non-Profit Organizations
      • SPAIN GeoMarket by Data Type

        • Vector Data
        • Raster Data
        • Point Cloud Data
      • REST OF EUROPE Outlook (USD Billion, 2019-2035)
      • REST OF EUROPE GeoMarket by Application Type

        • Urban Development
        • Environmental Monitoring
        • Disaster Management
        • Natural Resource Management
      • REST OF EUROPE GeoMarket by Technology Type

        • Geospatial Analysis
        • Remote Sensing
        • GPS Technology
        • Geographic Information System
      • REST OF EUROPE GeoMarket by End Use Type

        • Government
        • Commercial
        • Academic
        • Non-Profit Organizations
      • REST OF EUROPE GeoMarket by Data Type

        • Vector Data
        • Raster Data
        • Point Cloud Data
    • APAC Outlook (USD Billion, 2019-2035)

      • APAC GeoMarket by Application Type

        • Urban Development
        • Environmental Monitoring
        • Disaster Management
        • Natural Resource Management
      • APAC GeoMarket by Technology Type

        • Geospatial Analysis
        • Remote Sensing
        • GPS Technology
        • Geographic Information System
      • APAC GeoMarket by End Use Type

        • Government
        • Commercial
        • Academic
        • Non-Profit Organizations
      • APAC GeoMarket by Data Type

        • Vector Data
        • Raster Data
        • Point Cloud Data
      • APAC GeoMarket by Regional Type

        • China
        • India
        • Japan
        • South Korea
        • Malaysia
        • Thailand
        • Indonesia
        • Rest of APAC
      • CHINA Outlook (USD Billion, 2019-2035)
      • CHINA GeoMarket by Application Type

        • Urban Development
        • Environmental Monitoring
        • Disaster Management
        • Natural Resource Management
      • CHINA GeoMarket by Technology Type

        • Geospatial Analysis
        • Remote Sensing
        • GPS Technology
        • Geographic Information System
      • CHINA GeoMarket by End Use Type

        • Government
        • Commercial
        • Academic
        • Non-Profit Organizations
      • CHINA GeoMarket by Data Type

        • Vector Data
        • Raster Data
        • Point Cloud Data
      • INDIA Outlook (USD Billion, 2019-2035)
      • INDIA GeoMarket by Application Type

        • Urban Development
        • Environmental Monitoring
        • Disaster Management
        • Natural Resource Management
      • INDIA GeoMarket by Technology Type

        • Geospatial Analysis
        • Remote Sensing
        • GPS Technology
        • Geographic Information System
      • INDIA GeoMarket by End Use Type

        • Government
        • Commercial
        • Academic
        • Non-Profit Organizations
      • INDIA GeoMarket by Data Type

        • Vector Data
        • Raster Data
        • Point Cloud Data
      • JAPAN Outlook (USD Billion, 2019-2035)
      • JAPAN GeoMarket by Application Type

        • Urban Development
        • Environmental Monitoring
        • Disaster Management
        • Natural Resource Management
      • JAPAN GeoMarket by Technology Type

        • Geospatial Analysis
        • Remote Sensing
        • GPS Technology
        • Geographic Information System
      • JAPAN GeoMarket by End Use Type

        • Government
        • Commercial
        • Academic
        • Non-Profit Organizations
      • JAPAN GeoMarket by Data Type

        • Vector Data
        • Raster Data
        • Point Cloud Data
      • SOUTH KOREA Outlook (USD Billion, 2019-2035)
      • SOUTH KOREA GeoMarket by Application Type

        • Urban Development
        • Environmental Monitoring
        • Disaster Management
        • Natural Resource Management
      • SOUTH KOREA GeoMarket by Technology Type

        • Geospatial Analysis
        • Remote Sensing
        • GPS Technology
        • Geographic Information System
      • SOUTH KOREA GeoMarket by End Use Type

        • Government
        • Commercial
        • Academic
        • Non-Profit Organizations
      • SOUTH KOREA GeoMarket by Data Type

        • Vector Data
        • Raster Data
        • Point Cloud Data
      • MALAYSIA Outlook (USD Billion, 2019-2035)
      • MALAYSIA GeoMarket by Application Type

        • Urban Development
        • Environmental Monitoring
        • Disaster Management
        • Natural Resource Management
      • MALAYSIA GeoMarket by Technology Type

        • Geospatial Analysis
        • Remote Sensing
        • GPS Technology
        • Geographic Information System
      • MALAYSIA GeoMarket by End Use Type

        • Government
        • Commercial
        • Academic
        • Non-Profit Organizations
      • MALAYSIA GeoMarket by Data Type

        • Vector Data
        • Raster Data
        • Point Cloud Data
      • THAILAND Outlook (USD Billion, 2019-2035)
      • THAILAND GeoMarket by Application Type

        • Urban Development
        • Environmental Monitoring
        • Disaster Management
        • Natural Resource Management
      • THAILAND GeoMarket by Technology Type

        • Geospatial Analysis
        • Remote Sensing
        • GPS Technology
        • Geographic Information System
      • THAILAND GeoMarket by End Use Type

        • Government
        • Commercial
        • Academic
        • Non-Profit Organizations
      • THAILAND GeoMarket by Data Type

        • Vector Data
        • Raster Data
        • Point Cloud Data
      • INDONESIA Outlook (USD Billion, 2019-2035)
      • INDONESIA GeoMarket by Application Type

        • Urban Development
        • Environmental Monitoring
        • Disaster Management
        • Natural Resource Management
      • INDONESIA GeoMarket by Technology Type

        • Geospatial Analysis
        • Remote Sensing
        • GPS Technology
        • Geographic Information System
      • INDONESIA GeoMarket by End Use Type

        • Government
        • Commercial
        • Academic
        • Non-Profit Organizations
      • INDONESIA GeoMarket by Data Type

        • Vector Data
        • Raster Data
        • Point Cloud Data
      • REST OF APAC Outlook (USD Billion, 2019-2035)
      • REST OF APAC GeoMarket by Application Type

        • Urban Development
        • Environmental Monitoring
        • Disaster Management
        • Natural Resource Management
      • REST OF APAC GeoMarket by Technology Type

        • Geospatial Analysis
        • Remote Sensing
        • GPS Technology
        • Geographic Information System
      • REST OF APAC GeoMarket by End Use Type

        • Government
        • Commercial
        • Academic
        • Non-Profit Organizations
      • REST OF APAC GeoMarket by Data Type

        • Vector Data
        • Raster Data
        • Point Cloud Data
    • South America Outlook (USD Billion, 2019-2035)

      • South America GeoMarket by Application Type

        • Urban Development
        • Environmental Monitoring
        • Disaster Management
        • Natural Resource Management
      • South America GeoMarket by Technology Type

        • Geospatial Analysis
        • Remote Sensing
        • GPS Technology
        • Geographic Information System
      • South America GeoMarket by End Use Type

        • Government
        • Commercial
        • Academic
        • Non-Profit Organizations
      • South America GeoMarket by Data Type

        • Vector Data
        • Raster Data
        • Point Cloud Data
      • South America GeoMarket by Regional Type

        • Brazil
        • Mexico
        • Argentina
        • Rest of South America
      • BRAZIL Outlook (USD Billion, 2019-2035)
      • BRAZIL GeoMarket by Application Type

        • Urban Development
        • Environmental Monitoring
        • Disaster Management
        • Natural Resource Management
      • BRAZIL GeoMarket by Technology Type

        • Geospatial Analysis
        • Remote Sensing
        • GPS Technology
        • Geographic Information System
      • BRAZIL GeoMarket by End Use Type

        • Government
        • Commercial
        • Academic
        • Non-Profit Organizations
      • BRAZIL GeoMarket by Data Type

        • Vector Data
        • Raster Data
        • Point Cloud Data
      • MEXICO Outlook (USD Billion, 2019-2035)
      • MEXICO GeoMarket by Application Type

        • Urban Development
        • Environmental Monitoring
        • Disaster Management
        • Natural Resource Management
      • MEXICO GeoMarket by Technology Type

        • Geospatial Analysis
        • Remote Sensing
        • GPS Technology
        • Geographic Information System
      • MEXICO GeoMarket by End Use Type

        • Government
        • Commercial
        • Academic
        • Non-Profit Organizations
      • MEXICO GeoMarket by Data Type

        • Vector Data
        • Raster Data
        • Point Cloud Data
      • ARGENTINA Outlook (USD Billion, 2019-2035)
      • ARGENTINA GeoMarket by Application Type

        • Urban Development
        • Environmental Monitoring
        • Disaster Management
        • Natural Resource Management
      • ARGENTINA GeoMarket by Technology Type

        • Geospatial Analysis
        • Remote Sensing
        • GPS Technology
        • Geographic Information System
      • ARGENTINA GeoMarket by End Use Type

        • Government
        • Commercial
        • Academic
        • Non-Profit Organizations
      • ARGENTINA GeoMarket by Data Type

        • Vector Data
        • Raster Data
        • Point Cloud Data
      • REST OF SOUTH AMERICA Outlook (USD Billion, 2019-2035)
      • REST OF SOUTH AMERICA GeoMarket by Application Type

        • Urban Development
        • Environmental Monitoring
        • Disaster Management
        • Natural Resource Management
      • REST OF SOUTH AMERICA GeoMarket by Technology Type

        • Geospatial Analysis
        • Remote Sensing
        • GPS Technology
        • Geographic Information System
      • REST OF SOUTH AMERICA GeoMarket by End Use Type

        • Government
        • Commercial
        • Academic
        • Non-Profit Organizations
      • REST OF SOUTH AMERICA GeoMarket by Data Type

        • Vector Data
        • Raster Data
        • Point Cloud Data
    • MEA Outlook (USD Billion, 2019-2035)

      • MEA GeoMarket by Application Type

        • Urban Development
        • Environmental Monitoring
        • Disaster Management
        • Natural Resource Management
      • MEA GeoMarket by Technology Type

        • Geospatial Analysis
        • Remote Sensing
        • GPS Technology
        • Geographic Information System
      • MEA GeoMarket by End Use Type

        • Government
        • Commercial
        • Academic
        • Non-Profit Organizations
      • MEA GeoMarket by Data Type

        • Vector Data
        • Raster Data
        • Point Cloud Data
      • MEA GeoMarket by Regional Type

        • GCC Countries
        • South Africa
        • Rest of MEA
      • GCC COUNTRIES Outlook (USD Billion, 2019-2035)
      • GCC COUNTRIES GeoMarket by Application Type

        • Urban Development
        • Environmental Monitoring
        • Disaster Management
        • Natural Resource Management
      • GCC COUNTRIES GeoMarket by Technology Type

        • Geospatial Analysis
        • Remote Sensing
        • GPS Technology
        • Geographic Information System
      • GCC COUNTRIES GeoMarket by End Use Type

        • Government
        • Commercial
        • Academic
        • Non-Profit Organizations
      • GCC COUNTRIES GeoMarket by Data Type

        • Vector Data
        • Raster Data
        • Point Cloud Data
      • SOUTH AFRICA Outlook (USD Billion, 2019-2035)
      • SOUTH AFRICA GeoMarket by Application Type

        • Urban Development
        • Environmental Monitoring
        • Disaster Management
        • Natural Resource Management
      • SOUTH AFRICA GeoMarket by Technology Type

        • Geospatial Analysis
        • Remote Sensing
        • GPS Technology
        • Geographic Information System
      • SOUTH AFRICA GeoMarket by End Use Type

        • Government
        • Commercial
        • Academic
        • Non-Profit Organizations
      • SOUTH AFRICA GeoMarket by Data Type

        • Vector Data
        • Raster Data
        • Point Cloud Data
      • REST OF MEA Outlook (USD Billion, 2019-2035)
      • REST OF MEA GeoMarket by Application Type

        • Urban Development
        • Environmental Monitoring
        • Disaster Management
        • Natural Resource Management
      • REST OF MEA GeoMarket by Technology Type

        • Geospatial Analysis
        • Remote Sensing
        • GPS Technology
        • Geographic Information System
      • REST OF MEA GeoMarket by End Use Type

        • Government
        • Commercial
        • Academic
        • Non-Profit Organizations
      • REST OF MEA GeoMarket by Data Type

        • Vector Data
        • Raster Data
        • Point Cloud Data
    Infographic

    Free Sample Request

    Kindly complete the form below to receive a free sample of this Report

    Get Free Sample

    Customer Strories

    “I am very pleased with how market segments have been defined in a relevant way for my purposes (such as "Portable Freezers & refrigerators" and "last-mile"). In general the report is well structured. Thanks very much for your efforts.”

    Victoria Milne

    Founder
    Case Study
    Chemicals and Materials

    Compare Licence

    ×
    Features License Type
    Single User Multiuser License Enterprise User
    Price $4,950 $5,950 $7,250
    Maximum User Access Limit 1 User Upto 10 Users Unrestricted Access Throughout the Organization
    Free Customization
    Direct Access to Analyst
    Deliverable Format
    Platform Access
    Discount on Next Purchase 10% 15% 15%
    Printable Versions