×
  • Cat-intel
  • MedIntelliX
  • Resources
  • About Us
  • Hero Background
    English
    Chinese
    French
    Japanese
    Korean
    German
    Spanish

    Generative AI in Oil & Gas Market Size

    ID: MRFR/ICT/10669-HCR
    128 Pages
    Aarti Dhapte
    October 2025

    Generative AI in Oil & Gas Market Research Report By Function (Data Analysis and Interpretation, Predictive Modeling, Anomaly Detection, Decision Support, and Others), Application (Asset Maintenance, Drilling Optimization, Exploration & Production, Reservoir Modeling), Deployment (On-Premise, and Cloud-Based), End-User (Oil & Gas Companies, Drilling Contractors, Equipment Manufactur...

    Share:
    Download PDF ×

    We do not share your information with anyone. However, we may send you emails based on your report interest from time to time. You may contact us at any time to opt-out.

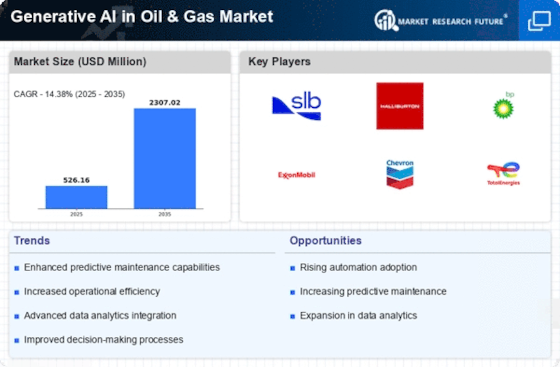
    Generative AI in Oil & Gas Market Infographic
    Purchase Options

    Generative Ai In Oil Gas Size

    Generative AI in Oil & Gas Market Growth Projections and Opportunities

    Generative AI, a subset of artificial intelligence (AI) that focuses on creating new data rather than analyzing existing data, is making significant strides in transforming the oil and gas market dynamics. In this industry, which heavily relies on data-driven decision-making, generative AI is proving to be a game-changer. One key area where generative AI is making an impact is in the optimization of exploration and production processes. By leveraging vast amounts of geological and seismic data, generative AI algorithms can simulate various drilling scenarios, helping oil and gas companies identify the most promising locations for extraction.

    Moreover, generative AI is revolutionizing the field of reservoir modeling. Traditionally, building accurate reservoir models required significant time and resources. However, with the advent of generative AI, companies can now generate detailed 3D models of underground reservoirs more quickly and efficiently. These models not only improve the understanding of subsurface structures but also enable better reservoir management strategies, ultimately leading to increased production rates and reduced operational costs.

    Furthermore, generative AI is enhancing predictive maintenance practices within the oil and gas sector. By analyzing sensor data from equipment such as pumps, valves, and turbines, AI algorithms can detect anomalies and predict potential failures before they occur. This proactive approach to maintenance not only minimizes downtime but also extends the lifespan of critical assets, resulting in substantial cost savings for oil and gas companies.

    In addition to operational efficiencies, generative AI is driving innovation in the realm of sustainability and environmental stewardship. By optimizing drilling and extraction processes, AI algorithms can help reduce the environmental footprint of oil and gas operations. For example, by minimizing the number of wells drilled and optimizing extraction techniques, companies can mitigate the impact on sensitive ecosystems and reduce greenhouse gas emissions.

    Moreover, generative AI is facilitating the development of next-generation materials and fuels that are more efficient and environmentally friendly. By analyzing vast datasets on chemical compositions and material properties, AI algorithms can design novel materials with enhanced durability, corrosion resistance, and thermal conductivity. Similarly, AI-driven simulations can optimize the composition of biofuels and synthetic fuels, making them more efficient and cost-effective alternatives to traditional fossil fuels.

    However, despite the numerous benefits that generative AI offers, its widespread adoption in the oil and gas industry is not without challenges. One major hurdle is the need for massive amounts of high-quality data to train AI algorithms effectively. In an industry where data availability can be limited, especially in remote exploration sites, acquiring and curating the necessary datasets can be a daunting task. Additionally, there are concerns surrounding data privacy and security, especially when dealing with sensitive geological and operational data.

    Furthermore, there is a skills gap within the industry, with a shortage of professionals who possess the expertise to develop and deploy generative AI solutions effectively. Bridging this gap will require significant investment in training and education programs focused on AI and data science.
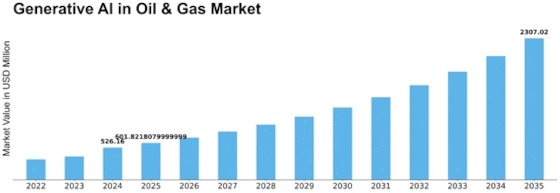
    Generative AI in Oil & Gas Market Size Graph
    Author
    Aarti Dhapte
    Team Lead - Research

    She holds an experience of about 6+ years in Market Research and Business Consulting, working under the spectrum of Information Communication Technology, Telecommunications and Semiconductor domains. Aarti conceptualizes and implements a scalable business strategy and provides strategic leadership to the clients. Her expertise lies in market estimation, competitive intelligence, pipeline analysis, customer assessment, etc.

    Leave a Comment

    FAQs

    What is the projected market valuation for Generative AI in the Oil & Gas sector by 2035?

    The projected market valuation for Generative AI in the Oil & Gas sector is 2307.02 USD Million by 2035.

    What was the overall market valuation for Generative AI in Oil & Gas in 2024?

    The overall market valuation for Generative AI in Oil & Gas was 526.16 USD Million in 2024.

    What is the expected CAGR for the Generative AI in Oil & Gas market from 2025 to 2035?

    The expected CAGR for the Generative AI in Oil & Gas market during the forecast period 2025 - 2035 is 14.38%.

    Which companies are considered key players in the Generative AI in Oil & Gas market?

    Key players in the market include Schlumberger, Halliburton, BP, ExxonMobil, Chevron, TotalEnergies, Equinor, ConocoPhillips, and Baker Hughes.

    What are the main functions of Generative AI in the Oil & Gas market and their valuations?

    Main functions include Data Analysis and Interpretation (460.0 USD Million), Predictive Modelling (600.0 USD Million), and Anomaly Detection (400.0 USD Million).

    How does the deployment mode affect the market valuation of Generative AI in Oil & Gas?

    The market valuation for deployment modes shows On-premise at 1000.0 USD Million and Cloud-based at 1307.02 USD Million.

    Market Summary

    As per MRFR analysis, the Generative AI in Oil & Gas Market Size was estimated at 526.16 USD Million in 2024. The Generative AI in Oil & Gas industry is projected to grow from 601.83 USD Million in 2025 to 2307.02 USD Million by 2035, exhibiting a compound annual growth rate (CAGR) of 14.38 during the forecast period 2025 - 2035.

    Key Market Trends & Highlights

    The Generative AI in Oil & Gas Market is poised for substantial growth driven by technological advancements and sustainability initiatives.

    • North America remains the largest market for Generative AI in Oil & Gas Market, reflecting robust investment in advanced technologies.
    • Asia-Pacific is emerging as the fastest-growing region, with increasing adoption of AI solutions in oil and gas operations.
    • The Data Analysis and Interpretation segment leads the market, while Predictive Modelling is rapidly gaining traction due to its innovative applications.
    • Key market drivers include enhanced data analytics capabilities and improved exploration techniques, which are crucial for operational efficiency.

    Market Size & Forecast

    2024 Market Size 526.16 (USD Million)
    2035 Market Size 2307.02 (USD Million)
    CAGR (2025 - 2035) 14.38%
    Largest Regional Market Share in 2024 North America

    Major Players

    <p>Schlumberger (US), Halliburton (US), BP (GB), ExxonMobil (US), Chevron (US), TotalEnergies (FR), Equinor (NO), ConocoPhillips (US), Baker Hughes (US)</p>

    Market Trends

    The Generative AI in Oil & Gas Market is currently experiencing a transformative phase, driven by advancements in artificial intelligence technologies. Companies within this sector are increasingly adopting generative AI to enhance operational efficiency, optimize resource management, and improve decision-making processes. This technology appears to facilitate predictive maintenance, enabling firms to anticipate equipment failures and reduce downtime. Furthermore, the integration of generative AI into exploration and production activities suggests a potential for more accurate geological modeling and simulation, which could lead to more effective resource extraction strategies. In addition to operational improvements, the Generative AI in Oil & Gas Market is likely to witness a growing emphasis on sustainability. As environmental concerns gain prominence, organizations are exploring AI-driven solutions to minimize their carbon footprint and enhance energy efficiency. This shift towards greener practices may not only align with regulatory requirements but also resonate with stakeholders who prioritize corporate responsibility. Overall, the Generative AI in Oil & Gas Market is poised for significant evolution, with technology playing a crucial role in shaping the future of the industry.

    Enhanced Predictive Maintenance

    Generative AI is being utilized to improve predictive maintenance strategies within the oil and gas sector. By analyzing vast amounts of operational data, AI systems can identify patterns that indicate potential equipment failures. This proactive approach allows companies to schedule maintenance activities more effectively, thereby minimizing unplanned downtime and optimizing operational efficiency.

    Advanced Geological Modeling

    The application of generative AI in geological modeling is transforming exploration activities. AI algorithms can process complex geological data to create more accurate models of subsurface formations. This capability enhances the precision of resource estimation and supports better decision-making in drilling and extraction processes.

    Sustainability and Environmental Impact

    As the industry faces increasing pressure to adopt sustainable practices, generative AI is emerging as a tool for reducing environmental impact. AI-driven solutions can optimize energy consumption and improve waste management, aligning operational practices with sustainability goals. This trend reflects a broader commitment to corporate responsibility and compliance with environmental regulations.

    Generative AI in Oil & Gas Market Market Drivers

    Enhanced Safety Protocols

    Safety remains a paramount concern in the Oil & Gas Market, and Generative AI is playing a pivotal role in enhancing safety protocols. By analyzing historical incident data and real-time operational metrics, AI can identify potential hazards and recommend preventive measures. This proactive approach to safety can lead to a reduction in workplace accidents and associated costs. Furthermore, Generative AI can simulate emergency scenarios, allowing companies to train personnel more effectively. As safety regulations become increasingly stringent, the adoption of AI-driven safety solutions is likely to be a key differentiator for companies aiming to maintain compliance and protect their workforce.

    Improved Exploration Techniques

    Generative AI in Oil & Gas Market is revolutionizing exploration techniques by providing advanced modeling and simulation capabilities. This technology allows for the creation of highly detailed geological models that can predict the presence of oil and gas reserves with greater accuracy. For instance, the use of AI-driven simulations can reduce exploration costs by up to 30%, as companies can identify the most promising drilling sites before committing significant resources. Additionally, Generative AI can analyze historical drilling data to enhance the understanding of subsurface conditions, leading to more informed decision-making. As the industry faces increasing pressure to discover new reserves, the adoption of Generative AI is likely to become a critical factor in maintaining competitiveness.

    Enhanced Data Analytics Capabilities

    The integration of Generative AI in Oil & Gas Market enhances data analytics capabilities, allowing companies to process vast amounts of data more efficiently. This technology enables the extraction of actionable insights from complex datasets, which is crucial for decision-making processes. As the industry generates approximately 2.5 quintillion bytes of data daily, the ability to analyze this information in real-time can lead to improved operational efficiency and reduced costs. Companies leveraging Generative AI can identify patterns and trends that may not be visible through traditional analytics methods, thus optimizing exploration and production activities. Furthermore, the predictive capabilities of Generative AI can lead to better forecasting of market demands and resource allocation, ultimately driving profitability.

    Operational Efficiency and Cost Reduction

    The implementation of Generative AI in Oil & Gas Market is associated with substantial improvements in operational efficiency and cost reduction. By automating routine tasks and optimizing workflows, companies can significantly lower operational costs. For example, AI-driven predictive maintenance can reduce equipment downtime by up to 20%, which translates into considerable savings. Moreover, the ability to simulate various operational scenarios allows companies to make informed decisions that enhance productivity. As the industry grapples with fluctuating oil prices, the need for cost-effective solutions becomes paramount. Generative AI not only streamlines operations but also enables companies to allocate resources more effectively, thereby enhancing overall profitability.

    Sustainability and Environmental Stewardship

    The growing emphasis on sustainability within the Oil & Gas Market is driving the adoption of Generative AI technologies. These tools can optimize resource extraction processes, minimizing environmental impact while maximizing efficiency. For instance, AI can analyze environmental data to identify the most sustainable practices for drilling and production. This not only helps companies comply with regulatory requirements but also enhances their reputation among stakeholders. As the industry faces increasing scrutiny regarding its environmental footprint, the integration of Generative AI is likely to be a crucial component in developing sustainable practices that align with global environmental goals.

    Market Segment Insights

    By Function: Data Analysis and Interpretation (Largest) vs. Predictive Modelling (Fastest-Growing)

    <p>In the Generative AI in Oil & Gas Market, the 'Function' segment showcases diverse applications with varying levels of market share. Data Analysis and Interpretation leads the segment, as companies increasingly rely on AI to streamline and enhance data processing capabilities. Predictive Modelling is gaining traction and rapidly emerging due to its ability to forecast operational outcomes, thus attracting significant attention from investors and stakeholders focused on innovation within the sector. As the industry evolves, the demand for advanced data-driven solutions has accelerated growth in Predictive Modelling, making it the fastest-growing area within the 'Function' segment. This trend is fueled by the increasing complexity of operational data in oil and gas exploration, where predictive analytics can prevent costly downtime and optimize resource allocation. Furthermore, as companies look towards sustainability, AI technologies that enhance predictive capabilities will play a vital role in achieving operational efficiency and environmental compliance.</p>

    <p>Data Analysis (Dominant) vs. Anomaly Detection (Emerging)</p>

    <p>The comparison between Data Analysis and Anomaly Detection reveals contrasting characteristics in the Generative AI segment. Data Analysis remains dominant as it encompasses a broad range of methodologies for examining and interpreting vast datasets, which are crucial for informed decision-making in the oil and gas markets. Its established techniques provide reliable insights, ensuring that organizations leverage their data effectively. On the other hand, Anomaly Detection is recognized as an emerging capability within the industry, addressing the need for advanced monitoring systems that can identify irregular patterns and potential operational risks. As companies intensify their focus on safety and security, the relevance of Anomaly Detection technology is anticipated to grow, complementing traditional data analysis to provide more robust analytical frameworks.</p>

    By Application: Exploration and Production (Largest) vs. Drilling Optimization (Fastest-Growing)

    <p>The application segment of the Generative AI in Oil & Gas Market showcases a varied distribution of market share among its core components. Exploration and Production leads as the largest segment, owing to its critical role in identifying new oil and gas reserves and improving production efficiency. This segment encompasses advanced AI technologies that assist in seismic data interpretation, leading to more effective decision-making processes in resource extraction. In contrast, Drilling Optimization emerges as the fastest-growing segment within this market. The increasing demand for efficient drilling processes, combined with the need to minimize operational costs, significantly drives this trend. Companies are increasingly adopting AI solutions that optimize drilling parameters and reduce downtime, showcasing a clear pivot toward technological innovations that streamline operations and enhance productivity.</p>

    <p>Exploration and Production: Dominant vs. Drilling Optimization: Emerging</p>

    <p>Exploration and Production represents the dominant force within the Generative AI in Oil & Gas Market. This segment is characterized by its reliance on AI to transform traditional exploration methods. By employing sophisticated algorithms and predictive analytics, companies can significantly enhance their ability to locate resources and optimize extraction processes. In contrast, Drilling Optimization is the emerging segment, focusing on the application of AI to refine drilling operations. The use of real-time data analytics and machine learning for drilling activities not only reduces costs but also improves accuracy, enabling operators to make more informed decisions while minimizing risks. The synergy of these two segments illustrates a comprehensive approach to advancing performance in the oil and gas industry.</p>

    By Deployment Mode: Cloud-based (Largest) vs. On-premise (Fastest-Growing)

    <p>In the Generative AI in Oil & Gas Market, the deployment mode segment exhibits a distinct division between cloud-based and on-premise solutions. Currently, cloud-based deployment holds the largest market share, driven by its scalability and cost efficiency. Organizations are increasingly opting for cloud solutions as they provide easier access to advanced AI technologies and facilitate collaboration across geographies. The flexibility to deploy resources without the burden of hefty infrastructure investments is making cloud models attractive to oil and gas companies. Conversely, the on-premise deployment mode is emerging as the fastest-growing option within this segment. This growth is primarily fueled by concerns over data security and regulatory compliance that many oil and gas companies face. By adopting an on-premise solution, companies can maintain tighter control over their sensitive data, ensuring adherence to internal policies and industry regulations. As technological advancements continue, the demand for on-premise solutions is expected to rise significantly, catering to specific security needs while leveraging generative AI capabilities.</p>

    <p>Deployment Mode: Cloud-based (Dominant) vs. On-premise (Emerging)</p>

    <p>Cloud-based solutions are dominating the deployment mode segment of the Generative AI market in Oil & Gas due to their convenience and lower upfront costs. They allow firms to rapidly scale resources and access cutting-edge AI tools, enabling improved operational efficiency and innovation. In contrast, on-premise deployments are emerging strongly as organizations prioritize data sovereignty, control, and compliance with stringent regulations. This deployment model allows companies to utilize generative AI technologies while closely managing the data generated and processed through specialized systems. Together, these two deployment modes illustrate the dynamic landscape of the Generative AI in Oil & Gas Market, where businesses are balancing operational flexibility with the need for robust security.</p>

    By End User: Oil & Gas Companies (Largest) vs. Drilling Contractors (Fastest-Growing)

    <p>In the Generative AI in Oil & Gas Market, Oil & Gas Companies dominate the segment, holding a substantial share due to their extensive operations and investment in technological advancements. This segment leads the market, supported by the need for enhanced efficiency and decision-making in exploration, production, and distribution processes. In contrast, Drilling Contractors, while smaller in share, represent the fastest-growing segment, driven by advancements in drilling technologies and the increasing adoption of AI to optimize drilling operations and reduce costs.</p>

    <p>Oil & Gas Companies (Dominant) vs. Drilling Contractors (Emerging)</p>

    <p>Oil & Gas Companies are characterized by their significant investments in Generative AI, using it to streamline operations, enhance predictive analytics, and improve safety measures across their extensive facilities. This segment is marked by large-scale projects that demand high efficiency and innovation. Drilling Contractors, on the other hand, are emerging as key players in this market, leveraging AI to enhance drilling efficiency, automate routine tasks, and optimize resource allocation. Their adaptability to new technologies allows them to stay competitive, responding quickly to the challenges of the oil and gas market.</p>

    Get more detailed insights about Generative AI in Oil & Gas Market Research Report – Forecast till 2035

    Regional Insights

    North America : Innovation and Investment Hub

    North America is the largest market for Generative AI in the Oil & Gas sector, holding approximately 45% of the global market share. The region benefits from significant investments in technology and innovation, driven by major oil companies and a favorable regulatory environment. The demand for AI-driven solutions is further propelled by the need for operational efficiency and cost reduction in oil extraction and processing. The United States is the dominant player in this market, with key companies like Schlumberger, Halliburton, and ExxonMobil leading the charge. Canada also plays a significant role, focusing on sustainable practices and technological advancements. The competitive landscape is characterized by rapid innovation and collaboration among industry leaders, ensuring that North America remains at the forefront of Generative AI applications in Oil & Gas.

    Europe : Sustainable Energy Transition

    Europe is witnessing a growing adoption of Generative AI in the Oil & Gas sector, accounting for approximately 30% of the global market share. The region's focus on sustainability and regulatory frameworks aimed at reducing carbon emissions are key drivers of this growth. Initiatives like the European Green Deal are catalyzing investments in AI technologies that enhance operational efficiency and environmental compliance. Leading countries in this market include the United Kingdom, Norway, and France, where companies like BP and TotalEnergies are actively integrating AI solutions. The competitive landscape is marked by collaborations between tech firms and oil companies, fostering innovation. As Europe transitions to greener energy sources, the role of Generative AI is expected to expand significantly, enhancing both productivity and sustainability in the sector.

    Asia-Pacific : Rapid Growth and Adoption

    Asia-Pacific is rapidly emerging as a significant player in the Generative AI market for Oil & Gas, holding about 20% of the global market share. The region's growth is fueled by increasing energy demands, technological advancements, and government initiatives promoting digital transformation in the oil sector. Countries like China and India are investing heavily in AI technologies to enhance exploration and production efficiency. China is leading the charge, with state-owned enterprises like Sinopec and CNOOC adopting AI solutions to optimize operations. India is also making strides, focusing on digitalization in its oil and gas sector. The competitive landscape is evolving, with both local and international players vying for market share, making Asia-Pacific a dynamic region for Generative AI applications in Oil & Gas.

    Middle East and Africa : Resource-Rich Opportunities

    The Middle East and Africa region is poised for growth in the Generative AI market within the Oil & Gas sector, accounting for approximately 5% of the global market share. The region's vast oil reserves and ongoing investments in technology are key growth drivers. Governments are increasingly recognizing the importance of AI in enhancing operational efficiency and sustainability in oil extraction processes. Leading countries include Saudi Arabia and the UAE, where national oil companies are exploring AI applications to optimize production and reduce costs. The competitive landscape is characterized by partnerships between local firms and global technology providers, fostering innovation. As the region continues to invest in digital transformation, the role of Generative AI is expected to expand, creating new opportunities in the Oil & Gas sector.

    Key Players and Competitive Insights

    Major market players are spending a lot of money on R&D to increase their product lines, which will help the Generative AI in Oil & Gas Market grow even more. Market participants are also taking a range of strategic initiatives to grow their worldwide footprint, with key market developments such as new product launches, mergers and acquisitions, contractual agreements, increased investments, and collaboration with other organizations. Competitors in the Generative AI in Oil & Gas industry must offer cost-effective items to expand and survive in an increasingly competitive and rising market environment.

    One of the primary business strategies adopted by manufacturers in the global Generative AI in Oil & Gas industry to benefit clients and expand the market sector is to manufacture locally to reduce operating costs. In recent years, Generative AI in Oil & Gas industry has provided Technology segment with some of the most significant benefits. The Generative AI in Oil & Gas Market major player such as Quantifind, OpenAI, Accenture, DataRobot, SAS, IBM, Microsoft, Adobe, NVIDIA, Intel, Google, and other market players.

    Microsoft Corporation is one of the world's largest and most influential technology companies. It is heavily invested in AI research and development. It offers AI-powered tools and services like Azure AI, Azure Machine Learning, and Cognitive Services for developers and businesses. In June 2023, Microsoft has collaborated with ExxonMobil provide its advanced digital technologies such as artificial intelligence & machine learning to make ExxonMobil’s Permian operations more efficient & without human intervention.

    Key Companies in the Generative AI in Oil & Gas Market market include

    Industry Developments

    August 2023: Wintershall Dea, the leading independent natural gas & oil companies in Europe is working with IBM Consulting to establish an AI Center of Competence (CoC) and for progressing multiple value-generating AI use cases, to support an efficient energy production & generate energy Industry AI Solutions. 

    May 2023: SparkCognition's AI algorithms will be used by Shell Plc, the largest oil producer in the U.S. Gulf of Mexico for deep sea exploration & production to increase offshore oil output.

    Future Outlook

    Generative AI in Oil & Gas Market Future Outlook

    <p>The Generative AI in Oil & Gas Market is projected to grow at a 14.38% CAGR from 2024 to 2035, driven by automation, data analytics, and enhanced operational efficiencies.</p>

    New opportunities lie in:

    • <p>Development of AI-driven predictive maintenance solutions for equipment reliability.</p>
    • <p>Implementation of generative design tools for optimizing drilling operations.</p>
    • <p>Creation of AI-based risk assessment platforms for project management.</p>

    <p>By 2035, the market is expected to be robust, driven by innovative AI applications.</p>

    Market Segmentation

    Generative AI in Oil & Gas Market End User Outlook

    • Oil & Gas Companies
    • Drilling Contractors
    • Equipment Manufacturers
    • Service Providers
    • Consulting Firms

    Generative AI in Oil & Gas Market Function Outlook

    • Data Analysis and Interpretation
    • Predictive Modelling
    • Anomaly Detection
    • Decision Support
    • Others

    Generative AI in Oil & Gas Market Application Outlook

    • Asset Maintenance
    • Drilling Optimization
    • Exploration and Production
    • Reservoir Modelling
    • Others

    Generative AI in Oil & Gas Market Deployment Mode Outlook

    • On-premise
    • Cloud-based

    Report Scope

    MARKET SIZE 2024526.16(USD Million)
    MARKET SIZE 2025601.83(USD Million)
    MARKET SIZE 20352307.02(USD Million)
    COMPOUND ANNUAL GROWTH RATE (CAGR)14.38% (2024 - 2035)
    REPORT COVERAGERevenue Forecast, Competitive Landscape, Growth Factors, and Trends
    BASE YEAR2024
    Market Forecast Period2025 - 2035
    Historical Data2019 - 2024
    Market Forecast UnitsUSD Million
    Key Companies ProfiledMarket analysis in progress
    Segments CoveredMarket segmentation analysis in progress
    Key Market OpportunitiesIntegration of Generative AI for predictive maintenance and optimization in oil extraction processes.
    Key Market DynamicsRising adoption of Generative Artificial Intelligence enhances operational efficiency and decision-making in the Oil and Gas sector.
    Countries CoveredNorth America, Europe, APAC, South America, MEA

    FAQs

    What is the projected market valuation for Generative AI in the Oil & Gas sector by 2035?

    The projected market valuation for Generative AI in the Oil & Gas sector is 2307.02 USD Million by 2035.

    What was the overall market valuation for Generative AI in Oil & Gas in 2024?

    The overall market valuation for Generative AI in Oil & Gas was 526.16 USD Million in 2024.

    What is the expected CAGR for the Generative AI in Oil & Gas market from 2025 to 2035?

    The expected CAGR for the Generative AI in Oil & Gas market during the forecast period 2025 - 2035 is 14.38%.

    Which companies are considered key players in the Generative AI in Oil & Gas market?

    Key players in the market include Schlumberger, Halliburton, BP, ExxonMobil, Chevron, TotalEnergies, Equinor, ConocoPhillips, and Baker Hughes.

    What are the main functions of Generative AI in the Oil & Gas market and their valuations?

    Main functions include Data Analysis and Interpretation (460.0 USD Million), Predictive Modelling (600.0 USD Million), and Anomaly Detection (400.0 USD Million).

    How does the deployment mode affect the market valuation of Generative AI in Oil & Gas?

    The market valuation for deployment modes shows On-premise at 1000.0 USD Million and Cloud-based at 1307.02 USD Million.

    1. SECTION I: EXECUTIVE SUMMARY AND KEY HIGHLIGHTS
      1. EXECUTIVE SUMMARY
        1. Market Overview
        2. Key Findings
        3. Market Segmentation
        4. Competitive Landscape
        5. Challenges and Opportunities
        6. Future Outlook
    2. SECTION II: SCOPING, METHODOLOGY AND MARKET STRUCTURE
      1. MARKET INTRODUCTION
        1. Definition
        2. Scope of the study
      2. RESEARCH METHODOLOGY
        1. Overview
        2. Data Mining
        3. Secondary Research
        4. Primary Research
        5. Forecasting Model
        6. Market Size Estimation
        7. Data Triangulation
        8. Validation
    3. SECTION III: QUALITATIVE ANALYSIS
      1. MARKET DYNAMICS
        1. Overview
        2. Drivers
        3. Restraints
        4. Opportunities
      2. MARKET FACTOR ANALYSIS
        1. Value chain Analysis
        2. Porter's Five Forces Analysis
        3. COVID-19 Impact Analysis
    4. SECTION IV: QUANTITATIVE ANALYSIS
      1. Information and Communications Technology, BY Function (USD Million)
        1. Data Analysis and Interpretation
        2. Predictive Modelling
        3. Anomaly Detection
        4. Decision Support
        5. Others
      2. Information and Communications Technology, BY Application (USD Million)
        1. Asset Maintenance
        2. Drilling Optimization
        3. Exploration and Production
        4. Reservoir Modelling
        5. Others
      3. Information and Communications Technology, BY Deployment Mode (USD Million)
        1. On-premise
        2. Cloud-based
      4. Information and Communications Technology, BY End User (USD Million)
        1. Oil & Gas Companies
        2. Drilling Contractors
        3. Equipment Manufacturers
        4. Service Providers
        5. Consulting Firms
      5. Information and Communications Technology, BY Region (USD Million)
        1. North America
        2. Europe
        3. APAC
        4. South America
        5. MEA
    5. SECTION V: COMPETITIVE ANALYSIS
      1. Competitive Landscape
        1. Overview
        2. Competitive Analysis
        3. Market share Analysis
        4. Major Growth Strategy in the Information and Communications Technology
        5. Competitive Benchmarking
        6. Leading Players in Terms of Number of Developments in the Information and Communications Technology
        7. Key developments and growth strategies
        8. Major Players Financial Matrix
      2. Company Profiles
        1. Schlumberger (US)
        2. Halliburton (US)
        3. BP (GB)
        4. ExxonMobil (US)
        5. Chevron (US)
        6. TotalEnergies (FR)
        7. Equinor (NO)
        8. ConocoPhillips (US)
        9. Baker Hughes (US)
      3. Appendix
        1. References
        2. Related Reports
    6. LIST OF FIGURES
      1. MARKET SYNOPSIS
      2. NORTH AMERICA MARKET ANALYSIS
      3. US MARKET ANALYSIS BY FUNCTION
      4. US MARKET ANALYSIS BY APPLICATION
      5. US MARKET ANALYSIS BY DEPLOYMENT MODE
      6. US MARKET ANALYSIS BY END USER
      7. CANADA MARKET ANALYSIS BY FUNCTION
      8. CANADA MARKET ANALYSIS BY APPLICATION
      9. CANADA MARKET ANALYSIS BY DEPLOYMENT MODE
      10. CANADA MARKET ANALYSIS BY END USER
      11. EUROPE MARKET ANALYSIS
      12. GERMANY MARKET ANALYSIS BY FUNCTION
      13. GERMANY MARKET ANALYSIS BY APPLICATION
      14. GERMANY MARKET ANALYSIS BY DEPLOYMENT MODE
      15. GERMANY MARKET ANALYSIS BY END USER
      16. UK MARKET ANALYSIS BY FUNCTION
      17. UK MARKET ANALYSIS BY APPLICATION
      18. UK MARKET ANALYSIS BY DEPLOYMENT MODE
      19. UK MARKET ANALYSIS BY END USER
      20. FRANCE MARKET ANALYSIS BY FUNCTION
      21. FRANCE MARKET ANALYSIS BY APPLICATION
      22. FRANCE MARKET ANALYSIS BY DEPLOYMENT MODE
      23. FRANCE MARKET ANALYSIS BY END USER
      24. RUSSIA MARKET ANALYSIS BY FUNCTION
      25. RUSSIA MARKET ANALYSIS BY APPLICATION
      26. RUSSIA MARKET ANALYSIS BY DEPLOYMENT MODE
      27. RUSSIA MARKET ANALYSIS BY END USER
      28. ITALY MARKET ANALYSIS BY FUNCTION
      29. ITALY MARKET ANALYSIS BY APPLICATION
      30. ITALY MARKET ANALYSIS BY DEPLOYMENT MODE
      31. ITALY MARKET ANALYSIS BY END USER
      32. SPAIN MARKET ANALYSIS BY FUNCTION
      33. SPAIN MARKET ANALYSIS BY APPLICATION
      34. SPAIN MARKET ANALYSIS BY DEPLOYMENT MODE
      35. SPAIN MARKET ANALYSIS BY END USER
      36. REST OF EUROPE MARKET ANALYSIS BY FUNCTION
      37. REST OF EUROPE MARKET ANALYSIS BY APPLICATION
      38. REST OF EUROPE MARKET ANALYSIS BY DEPLOYMENT MODE
      39. REST OF EUROPE MARKET ANALYSIS BY END USER
      40. APAC MARKET ANALYSIS
      41. CHINA MARKET ANALYSIS BY FUNCTION
      42. CHINA MARKET ANALYSIS BY APPLICATION
      43. CHINA MARKET ANALYSIS BY DEPLOYMENT MODE
      44. CHINA MARKET ANALYSIS BY END USER
      45. INDIA MARKET ANALYSIS BY FUNCTION
      46. INDIA MARKET ANALYSIS BY APPLICATION
      47. INDIA MARKET ANALYSIS BY DEPLOYMENT MODE
      48. INDIA MARKET ANALYSIS BY END USER
      49. JAPAN MARKET ANALYSIS BY FUNCTION
      50. JAPAN MARKET ANALYSIS BY APPLICATION
      51. JAPAN MARKET ANALYSIS BY DEPLOYMENT MODE
      52. JAPAN MARKET ANALYSIS BY END USER
      53. SOUTH KOREA MARKET ANALYSIS BY FUNCTION
      54. SOUTH KOREA MARKET ANALYSIS BY APPLICATION
      55. SOUTH KOREA MARKET ANALYSIS BY DEPLOYMENT MODE
      56. SOUTH KOREA MARKET ANALYSIS BY END USER
      57. MALAYSIA MARKET ANALYSIS BY FUNCTION
      58. MALAYSIA MARKET ANALYSIS BY APPLICATION
      59. MALAYSIA MARKET ANALYSIS BY DEPLOYMENT MODE
      60. MALAYSIA MARKET ANALYSIS BY END USER
      61. THAILAND MARKET ANALYSIS BY FUNCTION
      62. THAILAND MARKET ANALYSIS BY APPLICATION
      63. THAILAND MARKET ANALYSIS BY DEPLOYMENT MODE
      64. THAILAND MARKET ANALYSIS BY END USER
      65. INDONESIA MARKET ANALYSIS BY FUNCTION
      66. INDONESIA MARKET ANALYSIS BY APPLICATION
      67. INDONESIA MARKET ANALYSIS BY DEPLOYMENT MODE
      68. INDONESIA MARKET ANALYSIS BY END USER
      69. REST OF APAC MARKET ANALYSIS BY FUNCTION
      70. REST OF APAC MARKET ANALYSIS BY APPLICATION
      71. REST OF APAC MARKET ANALYSIS BY DEPLOYMENT MODE
      72. REST OF APAC MARKET ANALYSIS BY END USER
      73. SOUTH AMERICA MARKET ANALYSIS
      74. BRAZIL MARKET ANALYSIS BY FUNCTION
      75. BRAZIL MARKET ANALYSIS BY APPLICATION
      76. BRAZIL MARKET ANALYSIS BY DEPLOYMENT MODE
      77. BRAZIL MARKET ANALYSIS BY END USER
      78. MEXICO MARKET ANALYSIS BY FUNCTION
      79. MEXICO MARKET ANALYSIS BY APPLICATION
      80. MEXICO MARKET ANALYSIS BY DEPLOYMENT MODE
      81. MEXICO MARKET ANALYSIS BY END USER
      82. ARGENTINA MARKET ANALYSIS BY FUNCTION
      83. ARGENTINA MARKET ANALYSIS BY APPLICATION
      84. ARGENTINA MARKET ANALYSIS BY DEPLOYMENT MODE
      85. ARGENTINA MARKET ANALYSIS BY END USER
      86. REST OF SOUTH AMERICA MARKET ANALYSIS BY FUNCTION
      87. REST OF SOUTH AMERICA MARKET ANALYSIS BY APPLICATION
      88. REST OF SOUTH AMERICA MARKET ANALYSIS BY DEPLOYMENT MODE
      89. REST OF SOUTH AMERICA MARKET ANALYSIS BY END USER
      90. MEA MARKET ANALYSIS
      91. GCC COUNTRIES MARKET ANALYSIS BY FUNCTION
      92. GCC COUNTRIES MARKET ANALYSIS BY APPLICATION
      93. GCC COUNTRIES MARKET ANALYSIS BY DEPLOYMENT MODE
      94. GCC COUNTRIES MARKET ANALYSIS BY END USER
      95. SOUTH AFRICA MARKET ANALYSIS BY FUNCTION
      96. SOUTH AFRICA MARKET ANALYSIS BY APPLICATION
      97. SOUTH AFRICA MARKET ANALYSIS BY DEPLOYMENT MODE
      98. SOUTH AFRICA MARKET ANALYSIS BY END USER
      99. REST OF MEA MARKET ANALYSIS BY FUNCTION
      100. REST OF MEA MARKET ANALYSIS BY APPLICATION
      101. REST OF MEA MARKET ANALYSIS BY DEPLOYMENT MODE
      102. REST OF MEA MARKET ANALYSIS BY END USER
      103. KEY BUYING CRITERIA OF INFORMATION AND COMMUNICATIONS TECHNOLOGY
      104. RESEARCH PROCESS OF MRFR
      105. DRO ANALYSIS OF INFORMATION AND COMMUNICATIONS TECHNOLOGY
      106. DRIVERS IMPACT ANALYSIS: INFORMATION AND COMMUNICATIONS TECHNOLOGY
      107. RESTRAINTS IMPACT ANALYSIS: INFORMATION AND COMMUNICATIONS TECHNOLOGY
      108. SUPPLY / VALUE CHAIN: INFORMATION AND COMMUNICATIONS TECHNOLOGY
      109. INFORMATION AND COMMUNICATIONS TECHNOLOGY, BY FUNCTION, 2024 (% SHARE)
      110. INFORMATION AND COMMUNICATIONS TECHNOLOGY, BY FUNCTION, 2024 TO 2035 (USD Million)
      111. INFORMATION AND COMMUNICATIONS TECHNOLOGY, BY APPLICATION, 2024 (% SHARE)
      112. INFORMATION AND COMMUNICATIONS TECHNOLOGY, BY APPLICATION, 2024 TO 2035 (USD Million)
      113. INFORMATION AND COMMUNICATIONS TECHNOLOGY, BY DEPLOYMENT MODE, 2024 (% SHARE)
      114. INFORMATION AND COMMUNICATIONS TECHNOLOGY, BY DEPLOYMENT MODE, 2024 TO 2035 (USD Million)
      115. INFORMATION AND COMMUNICATIONS TECHNOLOGY, BY END USER, 2024 (% SHARE)
      116. INFORMATION AND COMMUNICATIONS TECHNOLOGY, BY END USER, 2024 TO 2035 (USD Million)
      117. BENCHMARKING OF MAJOR COMPETITORS
    7. LIST OF TABLES
      1. LIST OF ASSUMPTIONS
      2. 7.1.1
      3. North America MARKET SIZE ESTIMATES; FORECAST
        1. BY FUNCTION, 2025-2035 (USD Million)
        2. BY APPLICATION, 2025-2035 (USD Million)
        3. BY DEPLOYMENT MODE, 2025-2035 (USD Million)
        4. BY END USER, 2025-2035 (USD Million)
      4. US MARKET SIZE ESTIMATES; FORECAST
        1. BY FUNCTION, 2025-2035 (USD Million)
        2. BY APPLICATION, 2025-2035 (USD Million)
        3. BY DEPLOYMENT MODE, 2025-2035 (USD Million)
        4. BY END USER, 2025-2035 (USD Million)
      5. Canada MARKET SIZE ESTIMATES; FORECAST
        1. BY FUNCTION, 2025-2035 (USD Million)
        2. BY APPLICATION, 2025-2035 (USD Million)
        3. BY DEPLOYMENT MODE, 2025-2035 (USD Million)
        4. BY END USER, 2025-2035 (USD Million)
      6. Europe MARKET SIZE ESTIMATES; FORECAST
        1. BY FUNCTION, 2025-2035 (USD Million)
        2. BY APPLICATION, 2025-2035 (USD Million)
        3. BY DEPLOYMENT MODE, 2025-2035 (USD Million)
        4. BY END USER, 2025-2035 (USD Million)
      7. Germany MARKET SIZE ESTIMATES; FORECAST
        1. BY FUNCTION, 2025-2035 (USD Million)
        2. BY APPLICATION, 2025-2035 (USD Million)
        3. BY DEPLOYMENT MODE, 2025-2035 (USD Million)
        4. BY END USER, 2025-2035 (USD Million)
      8. UK MARKET SIZE ESTIMATES; FORECAST
        1. BY FUNCTION, 2025-2035 (USD Million)
        2. BY APPLICATION, 2025-2035 (USD Million)
        3. BY DEPLOYMENT MODE, 2025-2035 (USD Million)
        4. BY END USER, 2025-2035 (USD Million)
      9. France MARKET SIZE ESTIMATES; FORECAST
        1. BY FUNCTION, 2025-2035 (USD Million)
        2. BY APPLICATION, 2025-2035 (USD Million)
        3. BY DEPLOYMENT MODE, 2025-2035 (USD Million)
        4. BY END USER, 2025-2035 (USD Million)
      10. Russia MARKET SIZE ESTIMATES; FORECAST
        1. BY FUNCTION, 2025-2035 (USD Million)
        2. BY APPLICATION, 2025-2035 (USD Million)
        3. BY DEPLOYMENT MODE, 2025-2035 (USD Million)
        4. BY END USER, 2025-2035 (USD Million)
      11. Italy MARKET SIZE ESTIMATES; FORECAST
        1. BY FUNCTION, 2025-2035 (USD Million)
        2. BY APPLICATION, 2025-2035 (USD Million)
        3. BY DEPLOYMENT MODE, 2025-2035 (USD Million)
        4. BY END USER, 2025-2035 (USD Million)
      12. Spain MARKET SIZE ESTIMATES; FORECAST
        1. BY FUNCTION, 2025-2035 (USD Million)
        2. BY APPLICATION, 2025-2035 (USD Million)
        3. BY DEPLOYMENT MODE, 2025-2035 (USD Million)
        4. BY END USER, 2025-2035 (USD Million)
      13. Rest of Europe MARKET SIZE ESTIMATES; FORECAST
        1. BY FUNCTION, 2025-2035 (USD Million)
        2. BY APPLICATION, 2025-2035 (USD Million)
        3. BY DEPLOYMENT MODE, 2025-2035 (USD Million)
        4. BY END USER, 2025-2035 (USD Million)
      14. APAC MARKET SIZE ESTIMATES; FORECAST
        1. BY FUNCTION, 2025-2035 (USD Million)
        2. BY APPLICATION, 2025-2035 (USD Million)
        3. BY DEPLOYMENT MODE, 2025-2035 (USD Million)
        4. BY END USER, 2025-2035 (USD Million)
      15. China MARKET SIZE ESTIMATES; FORECAST
        1. BY FUNCTION, 2025-2035 (USD Million)
        2. BY APPLICATION, 2025-2035 (USD Million)
        3. BY DEPLOYMENT MODE, 2025-2035 (USD Million)
        4. BY END USER, 2025-2035 (USD Million)
      16. India MARKET SIZE ESTIMATES; FORECAST
        1. BY FUNCTION, 2025-2035 (USD Million)
        2. BY APPLICATION, 2025-2035 (USD Million)
        3. BY DEPLOYMENT MODE, 2025-2035 (USD Million)
        4. BY END USER, 2025-2035 (USD Million)
      17. Japan MARKET SIZE ESTIMATES; FORECAST
        1. BY FUNCTION, 2025-2035 (USD Million)
        2. BY APPLICATION, 2025-2035 (USD Million)
        3. BY DEPLOYMENT MODE, 2025-2035 (USD Million)
        4. BY END USER, 2025-2035 (USD Million)
      18. South Korea MARKET SIZE ESTIMATES; FORECAST
        1. BY FUNCTION, 2025-2035 (USD Million)
        2. BY APPLICATION, 2025-2035 (USD Million)
        3. BY DEPLOYMENT MODE, 2025-2035 (USD Million)
        4. BY END USER, 2025-2035 (USD Million)
      19. Malaysia MARKET SIZE ESTIMATES; FORECAST
        1. BY FUNCTION, 2025-2035 (USD Million)
        2. BY APPLICATION, 2025-2035 (USD Million)
        3. BY DEPLOYMENT MODE, 2025-2035 (USD Million)
        4. BY END USER, 2025-2035 (USD Million)
      20. Thailand MARKET SIZE ESTIMATES; FORECAST
        1. BY FUNCTION, 2025-2035 (USD Million)
        2. BY APPLICATION, 2025-2035 (USD Million)
        3. BY DEPLOYMENT MODE, 2025-2035 (USD Million)
        4. BY END USER, 2025-2035 (USD Million)
      21. Indonesia MARKET SIZE ESTIMATES; FORECAST
        1. BY FUNCTION, 2025-2035 (USD Million)
        2. BY APPLICATION, 2025-2035 (USD Million)
        3. BY DEPLOYMENT MODE, 2025-2035 (USD Million)
        4. BY END USER, 2025-2035 (USD Million)
      22. Rest of APAC MARKET SIZE ESTIMATES; FORECAST
        1. BY FUNCTION, 2025-2035 (USD Million)
        2. BY APPLICATION, 2025-2035 (USD Million)
        3. BY DEPLOYMENT MODE, 2025-2035 (USD Million)
        4. BY END USER, 2025-2035 (USD Million)
      23. South America MARKET SIZE ESTIMATES; FORECAST
        1. BY FUNCTION, 2025-2035 (USD Million)
        2. BY APPLICATION, 2025-2035 (USD Million)
        3. BY DEPLOYMENT MODE, 2025-2035 (USD Million)
        4. BY END USER, 2025-2035 (USD Million)
      24. Brazil MARKET SIZE ESTIMATES; FORECAST
        1. BY FUNCTION, 2025-2035 (USD Million)
        2. BY APPLICATION, 2025-2035 (USD Million)
        3. BY DEPLOYMENT MODE, 2025-2035 (USD Million)
        4. BY END USER, 2025-2035 (USD Million)
      25. Mexico MARKET SIZE ESTIMATES; FORECAST
        1. BY FUNCTION, 2025-2035 (USD Million)
        2. BY APPLICATION, 2025-2035 (USD Million)
        3. BY DEPLOYMENT MODE, 2025-2035 (USD Million)
        4. BY END USER, 2025-2035 (USD Million)
      26. Argentina MARKET SIZE ESTIMATES; FORECAST
        1. BY FUNCTION, 2025-2035 (USD Million)
        2. BY APPLICATION, 2025-2035 (USD Million)
        3. BY DEPLOYMENT MODE, 2025-2035 (USD Million)
        4. BY END USER, 2025-2035 (USD Million)
      27. Rest of South America MARKET SIZE ESTIMATES; FORECAST
        1. BY FUNCTION, 2025-2035 (USD Million)
        2. BY APPLICATION, 2025-2035 (USD Million)
        3. BY DEPLOYMENT MODE, 2025-2035 (USD Million)
        4. BY END USER, 2025-2035 (USD Million)
      28. MEA MARKET SIZE ESTIMATES; FORECAST
        1. BY FUNCTION, 2025-2035 (USD Million)
        2. BY APPLICATION, 2025-2035 (USD Million)
        3. BY DEPLOYMENT MODE, 2025-2035 (USD Million)
        4. BY END USER, 2025-2035 (USD Million)
      29. GCC Countries MARKET SIZE ESTIMATES; FORECAST
        1. BY FUNCTION, 2025-2035 (USD Million)
        2. BY APPLICATION, 2025-2035 (USD Million)
        3. BY DEPLOYMENT MODE, 2025-2035 (USD Million)
        4. BY END USER, 2025-2035 (USD Million)
      30. South Africa MARKET SIZE ESTIMATES; FORECAST
        1. BY FUNCTION, 2025-2035 (USD Million)
        2. BY APPLICATION, 2025-2035 (USD Million)
        3. BY DEPLOYMENT MODE, 2025-2035 (USD Million)
        4. BY END USER, 2025-2035 (USD Million)
      31. Rest of MEA MARKET SIZE ESTIMATES; FORECAST
        1. BY FUNCTION, 2025-2035 (USD Million)
        2. BY APPLICATION, 2025-2035 (USD Million)
        3. BY DEPLOYMENT MODE, 2025-2035 (USD Million)
        4. BY END USER, 2025-2035 (USD Million)
      32. PRODUCT LAUNCH/PRODUCT DEVELOPMENT/APPROVAL
      33. 7.31.1
      34. ACQUISITION/PARTNERSHIP
      35. 7.32.1

    Generative AI in Oil & Gas Market Segmentation

    Market Segmentation Overview

    • Detailed segmentation data will be available in the full report
    • Comprehensive analysis by multiple parameters
    • Regional and country-level breakdowns
    • Market size forecasts by segment
    Infographic

    Free Sample Request

    Kindly complete the form below to receive a free sample of this Report

    Get Free Sample

    Customer Strories

    “I am very pleased with how market segments have been defined in a relevant way for my purposes (such as "Portable Freezers & refrigerators" and "last-mile"). In general the report is well structured. Thanks very much for your efforts.”

    Victoria Milne

    Founder

    Compare Licence

    ×
    Features License Type
    Single User Multiuser License Enterprise User
    Price $4,950 $5,950 $7,250
    Maximum User Access Limit 1 User Upto 10 Users Unrestricted Access Throughout the Organization
    Free Customization
    Direct Access to Analyst
    Deliverable Format
    Platform Access
    Discount on Next Purchase 10% 15% 15%
    Printable Versions