• Cat-intel
  • MedIntelliX
  • Resources
  • About Us
  • Hero Background
    English
    Chinese
    French
    Japanese
    Korean
    German
    Spanish

    Generative AI in Oil & Gas Market Analysis

    ID: MRFR/ICT/10669-HCR
    128 Pages
    Aarti Dhapte
    October 2025

    Generative AI in Oil & Gas Market Research Report By Function (Data Analysis and Interpretation, Predictive Modeling, Anomaly Detection, Decision Support, and Others), Application (Asset Maintenance, Drilling Optimization, Exploration & Production, Reservoir Modeling), Deployment (On-Premise, and Cloud-Based), End-User (Oil & Gas Companies, Drilling Contractors, Equipment Manufactur...

    Share:
    Download PDF ×

    We do not share your information with anyone. However, we may send you emails based on your report interest from time to time. You may contact us at any time to opt-out.

    Generative AI in Oil & Gas Market Infographic
    $ 4,950.0
    $ 5,950.0
    $ 7,250.0

    Market Analysis

    In-depth Analysis of Generative AI in Oil & Gas Market Industry Landscape

    In the realm of the oil and gas industry, the integration of generative artificial intelligence (AI) brings forth a myriad of market factors that shape its adoption and impact. Firstly, cost efficiency emerges as a paramount consideration. Generative AI has the potential to streamline operations, optimize processes, and enhance decision-making, thereby reducing operational costs significantly. This cost-effectiveness is particularly appealing in an industry known for its high capital investments and tight profit margins.

    Moreover, the demand for enhanced productivity and efficiency serves as another crucial market factor. Generative AI technologies can analyze vast amounts of data to identify patterns, predict equipment failures, and optimize production schedules. By automating repetitive tasks and offering insights into complex systems, these AI solutions empower oil and gas companies to achieve higher levels of productivity and operational efficiency.

    Furthermore, the increasing emphasis on safety and risk management drives the adoption of generative AI in the oil and gas market. The ability of AI systems to monitor equipment health in real-time, detect anomalies, and predict potential hazards contributes significantly to maintaining a safe working environment. By mitigating risks and preventing accidents, these technologies help companies comply with stringent safety regulations and safeguard both personnel and assets.

    Additionally, the growing focus on sustainability and environmental responsibility plays a significant role in shaping the market dynamics of generative AI in the oil and gas sector. These technologies enable companies to optimize resource utilization, minimize waste, and reduce environmental impact. By optimizing processes and reducing emissions, generative AI contributes to the industry's efforts towards sustainable development and mitigating the environmental footprint of oil and gas operations.

    Moreover, the competitive landscape and market dynamics also influence the adoption of generative AI in the oil and gas sector. As companies seek to gain a competitive edge and differentiate themselves in the market, investing in advanced technologies such as generative AI becomes imperative. Early adopters of these technologies can capitalize on their benefits to improve operational efficiency, increase production, and enhance their market position.

    Furthermore, regulatory compliance serves as a significant market factor driving the adoption of generative AI in the oil and gas industry. With ever-evolving regulations governing safety, environmental protection, and data security, companies need robust solutions to ensure compliance. Generative AI systems offer advanced analytics capabilities that enable companies to monitor and report on various regulatory requirements effectively.

    Additionally, the global economic landscape and market trends influence the adoption of generative AI in the oil and gas sector. Economic fluctuations, supply-demand dynamics, and geopolitical factors all impact investment decisions and resource allocations within the industry. As companies navigate through market uncertainties, they seek innovative solutions such as generative AI to optimize operations, mitigate risks, and maintain profitability.

    Market Summary

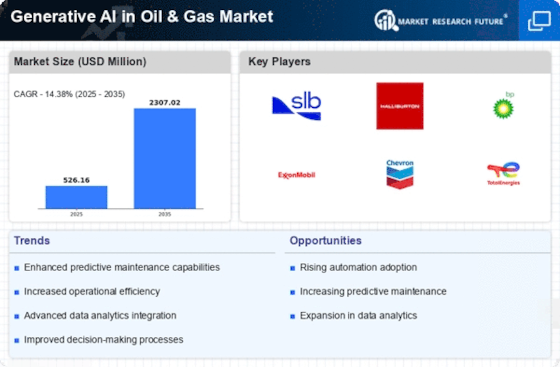
    As per Market Research Future Analysis, the Generative AI in Oil & Gas Market is projected to grow from USD 601.82 million in 2025 to USD 2307.02 million by 2035, with a CAGR of 14.38% during the forecast period. The market was valued at USD 526.16 million in 2024. Key drivers include the growing demand for exploration and production optimization and the need for data generation and augmentation. Generative AI enhances decision-making by creating accurate models of subsurface reservoirs and generating synthetic data to overcome challenges in real-world data collection.

    Key Market Trends & Highlights

    The Generative AI in Oil & Gas Market is witnessing significant growth driven by technological advancements and industry needs.

    • Market Size in 2024: USD 526.16 million. Projected Market Size by 2035: USD 2307.02 million. CAGR during 2025-2034: 14.38%. North America accounted for USD 115 million in 2022, holding a 31.76% market share.

    Market Size & Forecast

    2024 Market Size USD 526.16 million
    2035 Market Size USD 2307.02 million
    CAGR 14.38%

    Major Players

    <p>Key players include Quantifind, OpenAI, Accenture, DataRobot, SAS, IBM, Microsoft, Adobe, NVIDIA, Intel, and Google.</p>

    Market Trends

    <p>The integration of generative AI technologies in the oil and gas sector appears to enhance operational efficiency and decision-making processes, potentially leading to more sustainable practices and reduced environmental impact.</p>

    U.S. Department of Energy

    Generative AI in Oil & Gas Market Market Drivers

    Market Growth Projections

    The Global Generative AI in Oil & Gas Market Industry is poised for substantial growth, with projections indicating a market value of 524.8 USD Million in 2024 and an anticipated increase to 2307.0 USD Million by 2035. This growth trajectory suggests a compound annual growth rate (CAGR) of 14.41% from 2025 to 2035. Such figures underscore the increasing adoption of generative AI technologies across the industry, driven by the need for enhanced efficiency, sustainability, and innovation. As companies continue to invest in AI solutions, the market is likely to expand significantly, reflecting the transformative potential of these technologies.

    Increased Operational Efficiency

    The Global Generative AI in Oil & Gas Market Industry is witnessing a surge in demand for operational efficiency. Generative AI technologies enable companies to optimize drilling operations, enhance predictive maintenance, and streamline supply chain management. For instance, AI-driven analytics can reduce downtime by predicting equipment failures, thus saving costs. In 2024, the market is valued at 524.8 USD Million, reflecting the industry's commitment to leveraging advanced technologies for improved performance. As companies increasingly adopt these solutions, the potential for enhanced productivity and reduced operational costs becomes evident, positioning the industry for sustainable growth.

    Enhanced Data Analysis Capabilities

    The Global Generative AI in Oil & Gas Market Industry benefits significantly from advancements in data analysis capabilities. With vast amounts of data generated from exploration and production activities, generative AI tools can analyze complex datasets to uncover insights that were previously unattainable. This capability allows for better decision-making and risk management. Companies are increasingly utilizing AI to interpret geological data, leading to more accurate resource estimations. As the industry evolves, the reliance on sophisticated data analysis tools is likely to grow, further driving the market's expansion.

    Integration of IoT and AI Technologies

    The convergence of Internet of Things (IoT) and generative AI technologies is reshaping the Global Generative AI in Oil & Gas Market Industry. IoT devices collect real-time data from various operations, which generative AI can analyze to enhance decision-making processes. This integration allows for real-time monitoring and predictive analytics, leading to improved operational efficiency. As the industry embraces digital transformation, the synergy between IoT and AI is expected to drive innovation and create new business models. This trend is likely to contribute to the market's growth, with a projected CAGR of 14.41% from 2025 to 2035.

    Investment in Research and Development

    Investment in research and development (R&D) is a critical driver for the Global Generative AI in Oil & Gas Market Industry. Companies are allocating substantial resources to explore innovative applications of generative AI, aiming to enhance exploration techniques and optimize production processes. This focus on R&D not only fosters technological advancements but also positions firms competitively in a rapidly evolving market. As the industry seeks to address challenges such as resource depletion and operational inefficiencies, the commitment to R&D is likely to yield significant returns, further propelling market growth.

    Growing Demand for Sustainable Practices

    The Global Generative AI in Oil & Gas Market Industry is increasingly influenced by the demand for sustainable practices. As environmental concerns rise, companies are turning to generative AI to develop cleaner extraction methods and optimize resource usage. For example, AI can assist in designing processes that minimize waste and reduce emissions. This shift towards sustainability is not only a response to regulatory pressures but also aligns with the industry's long-term viability. The market is projected to reach 2307.0 USD Million by 2035, indicating a robust growth trajectory fueled by sustainability initiatives.

    Market Segment Insights

    Generative AI in Oil & Gas Market- Function Insights

    <p>The Generative AI in Oil &amp; Gas Market segmentation, based on Function, includes Data Analysis and Interpretation, Predictive Modelling, <a href="https://www.marketresearchfuture.com/reports/anomaly-detection-market-5756">Anomaly Detection</a>, Decision Support, and Others. The Data Analysis and Interpretation segment held the majority share in 2022 in the Generative AI in Oil &amp; Gas Market data and is projected to be the fast-growing segment in the forecast period. Data analysis and interpretation segment plays an important role in the application of Generative AI in the Oil &amp; Gas market. This segment involves using generative models to analyze complex datasets and interpret the insights gained from them.&nbsp;</p>

    <p>The Oil &amp; Gas industry generates vast amounts of data from sources such as sensors, equipment logs, seismic surveys, and production records. Generative AI can be used to process and analyze this complex data to extract meaningful patterns, correlations, and anomalies. Geological data, such as seismic data and well logs, can be challenging to interpret. <a href="https://www.marketresearchfuture.com/reports/generative-ai-market-11879">Generative AI</a> models can help geologists and engineers analyze these data types to identify potential reservoirs, predict rock formations, and assess drilling sites more accurately.</p>

    Generative AI in Oil & Gas Market- Application Insights

    <p>The Generative AI in Oil &amp; Gas Market segmentation, based on Application, includes Asset Maintenance, Drilling Optimization, Exploration and Production, Reservoir Modelling, and Others. The Asset Maintenance segment dominated the market growth in 2022 and is projected to be the faster-growing segment during the forecast period, 2023-2032. The Asset Maintenance segment is a crucial area of application for Generative AI in the Oil &amp; Gas market. It involves utilizing generative models to optimize the maintenance, reliability, and performance of equipment and assets used in exploration, drilling, production, and distribution.&nbsp;</p>

    <p>Generative AI models analyze data from sensors, equipment logs, and historical maintenance records to predict when equipment is likely to fail. This enables proactive maintenance scheduling, reducing downtime, and preventing costly unplanned shutdowns. Generative AI identifies patterns and anomalies in equipment data that might indicate impending failures. This early warning system allows operators to take preventive actions to mitigate the risks associated with equipment breakdowns.</p>

    <p>FIGURE 2: GENERATIVE AI IN OIL &amp; GAS MARKET, BY APPLICATION, 2023 &amp; 2032 (USD MILLION)</p>

    Generative AI in Oil & Gas Market – Deployment Mode Insights

    <p>The Generative AI in Oil &amp; Gas Market segmentation, based on Deployment Mode, includes on-premise, and cloud based. The on-premise segment held the majority share in 2022 in the Generative AI in Oil &amp; Gas Market data and is projected to be the fast-growing segment in the forecast period. The Cloud-based segment in Generative AI for the Oil &amp; Gas market refers to the deployment and utilization of generative AI solutions on cloud computing platforms.&nbsp;</p>

    <p>This approach offers numerous advantages to the industry, given the data-intensive and computationally demanding nature of Oil &amp; Gas operations. Cloud platforms provide the ability to scale up or down resources as needed. This is particularly beneficial for Oil &amp; Gas applications that require substantial computational power for training complex generative AI models or processing large datasets.</p>

    Generative AI in Oil & Gas Market – End User Insights

    <p>The Generative AI in Oil &amp; Gas Market segmentation, based on End User includes Oil &amp; Gas Companies, Drilling Contractors, Equipment Manufacturers, Service Providers, and Consulting Firms. The Oil &amp; Gas Companies held the majority share in 2022 in the Generative AI in Oil &amp; Gas Market data and is projected to be the fast-growing segment in the forecast period. Generative AI can assist oil and gas companies in modeling and simulating reservoir behavior, optimizing drilling techniques, and predicting oil and gas reserves.&nbsp;</p>

    <p>This aids in making informed decisions about exploration and production strategies. Oil and gas companies use generative AI for predictive maintenance, where algorithms analyze equipment data to predict potential failures.</p>

    Get more detailed insights about Generative AI in Oil & Gas Market Research Report – Forecast till 2034

    Regional Insights

    By region, the study provides the market insights into North America, Europe, Asia-Pacific, Middle East & Africa, and South America. North America Generative AI in Oil & Gas Market accounted for USD 115 million in 2022 with a share of around 31.76% and is expected to exhibit a significant CAGR growth during the study period. The Oil & Gas industry in North America generates vast amounts of data from exploration, production, refining, and distribution processes.

    Generative AI thrives on data, and the abundance of it in the region provides a fertile ground for its application. As advancements in AI and machine learning occur, they naturally find application in industries like Oil & Gas. Further, the major countries studied in the market report are: The U.S, Canada, Germany, France, UK, Italy, Spain, China, Japan, India, Australia, South Korea, and Brazil.

    Figure 3: GENERATIVE AI IN OIL & GAS MARKET SHARE BY REGION, 2023 & 2032 (USD Million)

    Generative AI in Oil & Gas Market Regional Insights

    Source: Secondary Research, Primary Research, Market Research Future Database and Analyst Review

    Europe Generative AI in Oil & Gas Market accounts for the second-largest market share. Europe is known for its technological prowess and innovation. As Generative AI represents a cutting-edge application of AI and machine learning, European companies and institutions are keen to adopt and harness its potential. Generative AI can help the Oil & Gas industry model and optimize processes to reduce environmental impact, aligning with the region's environmental goals.

    Moreover, Germany Generative AI in Oil & Gas Market held the largest market share, and the UK Generative AI in Oil & Gas Market was the fastest growing market in the European region.

    Asia-Pacific Generative AI in Oil & Gas Market accounts for the third-largest market share and is projected to continue increasing due to rapid technological adoption and diverse geological conditions. Asia-Pacific countries are embracing advanced technologies to enhance various industries. Generative AI's potential for data analysis, optimization, and prediction aligns with the region's technological ambitions. The region features diverse geological formations, presenting unique challenges for oil and gas exploration and production. Generative AI's ability to model and simulate these conditions is valuable in optimizing operations.

    Further, the China Generative AI in Oil & Gas Market held the largest market share, and the India Generative AI in Oil & Gas Market was the fastest growing market in the region.

    The Middle East & Africa Generative AI in Oil & Gas Market is rapidly growing due to its energy-centric economy and resource optimization. The Middle East is a major global hub for oil and gas production. Given the region's economic reliance on these resources, there is a strong incentive to adopt advanced technologies like Generative AI to enhance operational efficiency and competitiveness. Given the region's role as a major oil exporter, optimizing the extraction and production processes becomes paramount. Petroleum AI Applications assists in optimizing production and refining processes, leading to cost savings and improved resource management.

    Also, The South America Generative AI in Oil & Gas Market is growing due to resource-rich region and exploration potential. South America is rich in oil and gas resources, making it a significant player in the global energy market. The adoption of advanced technologies like Generative AI can enhance resource extraction and operational efficiency. Generative AI's ability to model subsurface conditions and optimize drilling techniques is particularly relevant in South America.

    Key Players and Competitive Insights

    Major market players are spending a lot of money on R&D to increase their product lines, which will help the Generative AI in Oil & Gas Market grow even more. Market participants are also taking a range of strategic initiatives to grow their worldwide footprint, with key market developments such as new product launches, mergers and acquisitions, contractual agreements, increased investments, and collaboration with other organizations. Competitors in the Generative AI in Oil & Gas industry must offer cost-effective items to expand and survive in an increasingly competitive and rising market environment.

    One of the primary business strategies adopted by manufacturers in the global Generative AI in Oil & Gas industry to benefit clients and expand the market sector is to manufacture locally to reduce operating costs. In recent years, Generative AI in Oil & Gas industry has provided Technology segment with some of the most significant benefits. The Generative AI in Oil & Gas Market major player such as Quantifind, OpenAI, Accenture, DataRobot, SAS, IBM, Microsoft, Adobe, NVIDIA, Intel, Google, and other market players.

    Microsoft Corporation is one of the world's largest and most influential technology companies. It is heavily invested in AI research and development. It offers AI-powered tools and services like Azure AI, Azure Machine Learning, and Cognitive Services for developers and businesses. In June 2023, Microsoft has collaborated with ExxonMobil provide its advanced digital technologies such as artificial intelligence & machine learning to make ExxonMobil’s Permian operations more efficient & without human intervention.

    Key Companies in the Generative AI in Oil & Gas Market market include

    Industry Developments

    August 2023: Wintershall Dea, the leading independent natural gas & oil companies in Europe is working with IBM Consulting to establish an AI Center of Competence (CoC) and for progressing multiple value-generating AI use cases, to support an efficient energy production & generate energy Industry AI Solutions. 

    May 2023: SparkCognition's AI algorithms will be used by Shell Plc, the largest oil producer in the U.S. Gulf of Mexico for deep sea exploration & production to increase offshore oil output.

    Future Outlook

    Generative AI in Oil & Gas Market Future Outlook

    <p>The Global Generative AI in Oil &amp; Gas Market is projected to grow at a 14.38% CAGR from 2025 to 2035, driven by technological advancements, operational efficiency, and enhanced data analytics capabilities.</p>

    New opportunities lie in:

    • <p>Develop AI-driven predictive maintenance solutions to reduce downtime and operational costs. Implement generative design algorithms for optimizing drilling and extraction processes. Leverage AI for real-time data analysis to enhance decision-making in exploration and production.</p>

    <p>By 2035, the market is expected to be robust, characterized by advanced AI integration and substantial revenue growth.</p>

    Market Segmentation

    Generative AI in Oil & Gas End-User Outlook (USD Million, 2019-2032)

    • Oil & Gas Companies
    • Drilling Contractors
    • Equipment Manufacturers
    • Service Providers
    • Consulting Firms

    Generative AI in Oil & Gas Function Outlook (USD Million, 2019-2032)

    • Data Analysis and Interpretation
    • Predictive Modelling
    • Anomaly Detection
    • Decision Support
    • Others

    Generative AI in Oil & Gas Regional Outlook (USD Million, 2019-2032)

    Generative AI in Oil & Gas Application Outlook (USD Million, 2019-2032)

    • Asset Maintenance
    • Drilling Optimization
    • Exploration and Production
    • Reservoir Modelling
    • Others

    Generative AI in Oil & Gas Deployment Mode Outlook (USD Million, 2019-2032)

    • On-premise
    • Cloud-based

    Report Scope

    Report Attribute/MetricDetails
    Market Size 2024526.15 (USD Million)
    Market Size 2025601.82 (USD Million)
    Market Size 20352307.02 (USD Million)
    Compound Annual Growth Rate (CAGR)14.38% (2025 - 2035)
    Report CoverageRevenue Forecast, Competitive Landscape, Growth Factors, and Trends
    Base Year2024
    Market Forecast Period2025 - 2035
    Historical Data2019 - 2023
    Market Forecast UnitsUSD Million
    Segments CoveredFunction, Application, Deployment Mode, End-User, and Region
    Geographies CoveredNorth America, Europe, Asia-Pacific Pacific, Middle East & Africa, and South America
    Countries CoveredThe U.S, Canada, Germany, France, UK, Italy, Spain, China, Japan, India, Australia, South Korea, and Brazil
    Key Companies ProfiledQuantifind, OpenAI, Accenture, DataRobot, SAS, IBM, Microsoft, Adobe, NVIDIA, Intel, Google, and other market players.
    Key Market OpportunitiesIncreased opportunities due to Generative AI’s capability of generating tailored solutions
    Key Market DynamicsGrowing demand for exploration and production optimization Rising demand for data generation and augmentation

    Market Highlights

    Author

    Aarti Dhapte
    Team Lead - Research

    She holds an experience of about 6+ years in market research and business consulting, working under the spectrum of information communication technology, telecommunications and semiconductor domains. aarti conceptualizes and implements a scalable business strategy and provides strategic leadership to the clients. her expertise lies in market estimation, competitive intelligence, pipeline analysis, customer assessment, etc.

    Leave a Comment

    Latest Comments

    John Doe
    john@example.com

    This is a great article! Really helped me understand the topic better.

    Posted on July 23, 2025, 10:15 AM
    Jane Smith
    jane@domain.com

    Thanks for sharing this. I’ve bookmarked it for later reference.

    Posted on July 22, 2025, 7:45 PM

    FAQs

    How much is the Generative AI in Oil & Gas Market?

    The Generative AI in Oil &amp; Gas Market size was valued at USD 526.15 million in 2024.

    What is the growth rate of the Generative AI in Oil & Gas Market?

    The global market is projected to grow at a CAGR of 14.38% during the forecast period, 2025-2034.

    Which region held the largest market share in the Generative AI in Oil & Gas Market?

    North America had the largest share in the Generative AI in Oil &amp; Gas Market.

    Who are the key players in the Generative AI in Oil & Gas Market?

    The key players in the market are Quantifind, OpenAI, Accenture, DataRobot, SAS, IBM, Microsoft, Adobe, NVIDIA, Intel, Google, and other market players.

    Which function led the Generative AI in Oil & Gas Market?

    Data Analysis and Interpretation dominated the market in 2022.

    Which application had the largest market share in the Generative AI in Oil & Gas Market?

    The Asset Maintenance application had the largest share in the global market

    1. Table of Contents
    2. Executive Summary
      1. Market Attractiveness Analysis
        1. Global Generative AI in Oil & Gas Market, by Function
        2. Global Generative AI in Oil & Gas Market, by Application
        3. Global Generative AI in Oil & Gas Market, by Deployment Mode
        4. Global Generative AI in Oil & Gas Market, by End-User
        5. Global Generative AI in Oil & Gas Market, by Region
    3. Market Introduction
      1. Definition
      2. Scope of the Study
      3. Market Structure
      4. Key Buying Criteria
      5. Macro Factor Indicator Analysis
    4. Research Methodology
      1. Research Process
      2. Primary Research
      3. Secondary Research
      4. Market Size Estimation
      5. Forecast Model
      6. List of Assumptions
    5. MARKET DYNAMICS
      1. Introduction
      2. Drivers
        1. Growing demand for exploration and production optimization
        2. Rising demand for data generation and augmentation
        3. Drivers impact analysis 
      3. Restraints 
        1. Accuracy and reliability of generative AI models heavily depend on the quality of the training data
        2. Restraint impact analysis 
      4. Opportunities 
        1. Increased opportunities due to Generative AI’s capability of generating tailored solutions
      5. Challenges
        1. Regulatory and safety concerns
      6. Covid-19 Impact Analysis
        1. Impact on Generative AI in Oil & Gas Market
        2. Impact on End Users during the Lockdowns
    6. MARKET FACTOR ANALYSIS
      1. Value Chain Analysis/Supply Chain Analysis
      2. Porter’s Five Forces Model
        1. Bargaining Power of Suppliers
        2. Bargaining Power of Buyers
        3. Threat of New Entrants
        4. Threat of Substitutes
        5. Intensity of Rivalry
    7. GLOBAL GENERATIVE AI IN OIL & GAS MARKET, BY FUNCTION
      1. Introduction
      2. Data Analysis and Interpretation
      3. Predictive Modelling
      4. Anomaly Detection
      5. Decision Support
      6. Others
    8. GLOBAL GENERATIVE AI IN OIL & GAS MARKET, BY APPLICATION
      1. Introduction
      2. Asset Maintenance
      3. Drilling Optimization
      4. Exploration and Production
      5. Reservoir Modelling
      6. Others
    9. GLOBAL GENERATIVE AI IN OIL & GAS MARKET, BY DEPLOYMENT MODE
      1. Introduction
      2. On-premise
      3. Cloud-based
    10. GLOBAL GENERATIVE AI IN OIL & GAS MARKET, BY END-USER
      1. Introduction
      2. Oil & Gas Companies
      3. Drilling Contractors
      4. Equipment Manufacturers
      5. Service Providers
      6. Consulting Firms
    11. GLOBAL GENERATIVE AI IN OIL & GAS MARKET SIZE ESTIMATION & FORECAST, BY REGION
      1. Introduction 
      2. North America
        1. Market Estimates & Forecast, by Country, 2018-2032
        2. Market Estimates & Forecast, by Function, 2018-2032
        3. Market Estimates & Forecast, by Application, 2018-2032
        4. Market Estimates & Forecast, by Deployment Mode, 2018-2032
        5. Market Estimates & Forecast, by End-User, 2018-2032
        6. US
        7. Canada
        8. Mexico
      3. Europe
        1. Market Estimates & Forecast, by Country, 2018-2032
        2. Market Estimates & Forecast, by Function, 2018-2032
        3. Market Estimates & Forecast, by Application, 2018-2032
        4. Market Estimates & Forecast, by Deployment Mode, 2018-2032
        5. Market Estimates & Forecast, by End-User, 2018-2032
        6. UK
        7. Germany
        8. France
        9. Italy
        10. Spain
        11. Rest of Europe
      4. Asia-Pacific
        1. Market Estimates & Forecast, by Country, 2018-2032
        2. Market Estimates & Forecast, by Function, 2018-2032
        3. Market Estimates & Forecast, by Application, 2018-2032
        4. Market Estimates & Forecast, by Deployment Mode, 2018-2032
        5. Market Estimates & Forecast, by End-User, 2018-2032
        6. China
        7. Japan
        8. India
        9. Australia
        10. Rest of Asia-Pacific
      5. Rest of the World
        1. Market Estimates & Forecast, by Function, 2018-2032
        2. Market Estimates & Forecast, by Application, 2018-2032
        3. Market Estimates & Forecast, by Deployment Mode, 2018-2032
        4. Market Estimates & Forecast, by End-User, 2018-2032
        5. Middle East & Africa
        6. South America
    12. Competitive Landscape
      1. Introduction
      2. Key Developments & Growth Strategies
      3. Competitor Benchmarking
      4. Vendor Share Analysis, 2022(% Share)
    13. COMPANY PROFILES
      1. Quantifind
        1. Company Overview
        2. Financial Overview
        3. Product Offered
        4. Key Developments
        5. SWOT Analysis
        6. Key Strategies
      2. OpenAI
        1. Company Overview
        2. Financial Overview
        3. Product Offered
        4. Key Developments
        5. SWOT Analysis
        6. Key Strategies 
      3. Accenture
        1. Company Overview
        2. Financial Overview
        3. Product Offered
        4. Key Developments
        5. SWOT Analysis
        6. Key Strategies
      4. DataRobot
        1. Company Overview
        2. Financial Overview
        3. Product Offered
        4. Key Developments
        5. SWOT Analysis
        6. Key Strategies
      5. SAS
        1. Company Overview
        2. Financial Overview
        3. Product Offered
        4. Key Developments
        5. SWOT Analysis
        6. Key Strategies
      6. IBM
        1. Company Overview
        2. Financial Overview
        3. Product Offered
        4. Key Developments
        5. SWOT Analysis
        6. Key Strategies
      7. Microsoft
        1. Company Overview
        2. Financial Overview
        3. Product Offered
        4. Key Developments
        5. SWOT Analysis
        6. Key Strategies
      8. Adobe
        1. Company Overview
        2. Financial Overview
        3. Product Offered
        4. Key Developments
        5. SWOT Analysis
        6. Key Strategies
      9. NVIDIA
        1. Company Overview
        2. Financial Overview
        3. Product Offered
        4. Key Developments
        5. SWOT Analysis
        6. Key Strategies
      10. Intel
        1. Company Overview
        2. Financial Overview
        3. Product Offered
        4. Key Developments
        5. SWOT Analysis
        6. Key Strategies
      11. Google
        1. Company Overview
        2. Financial Overview
        3. Product Offered
        4. Key Developments
        5. SWOT Analysis
        6. Key Strategies
      12. Others
        1. Company Overview
        2. Financial Overview
        3. Product Offered
        4. Key Developments
        5. SWOT Analysis
        6. Key Strategies
    14. List of Tables and Figures
      1. LIST OF TABLES
      2. TABLE 1 PRIMARY INTERVIEWS 19
      3. TABLE 2 LIST OF ASSUMPTIONS & LIMITATIONS 20
      4. TABLE 3 GLOBAL GENERATIVE AI IN OIL & GAS MARKET, BY FUNCTION, 2018–2032 (USD MILLION) 21
      5. TABLE 4 GLOBAL GENERATIVE AI IN OIL & GAS MARKET, BY APPLICATION, 2018–2032 (USD MILLION) 22
      6. TABLE 5 GLOBAL GENERATIVE AI IN OIL & GAS MARKET, BY DEPLOYMENT MODE, 2018–2032 (USD MILLION) 23
      7. TABLE 6 GLOBAL GENERATIVE AI IN OIL & GAS MARKET, BY END-USER, 2018–2032 (USD MILLION) 24
      8. TABLE 7 GLOBAL GENERATIVE AI IN OIL & GAS MARKET, BY REGION, 2018–2032 (USD MILLION) 25
      9. TABLE 8 NORTH AMERICA GENERATIVE AI IN OIL & GAS MARKET, BY COUNTRY, 2018–2032 (USD MILLION) 26
      10. TABLE 9 NORTH AMERICA GENERATIVE AI IN OIL & GAS MARKET, BY FUNCTION, 2018–2032 (USD MILLION) 27
      11. TABLE 10 NORTH AMERICA GENERATIVE AI IN OIL & GAS MARKET, BY APPLICATION, 2018–2032 (USD MILLION) 28
      12. TABLE 11 NORTH AMERICA GENERATIVE AI IN OIL & GAS MARKET, BY DEPLOYMENT MODE, 2018–2032 (USD MILLION) 29
      13. TABLE 12 NORTH AMERICA GENERATIVE AI IN OIL & GAS MARKET, BY END-USER, 2018–2032 (USD MILLION) 30
      14. TABLE 13 US GENERATIVE AI IN OIL & GAS MARKET, BY FUNCTION, 2018–2032 (USD MILLION) 31
      15. TABLE 14 US GENERATIVE AI IN OIL & GAS MARKET, BY APPLICATION, 2018–2032 (USD MILLION) 32
      16. TABLE 15 US GENERATIVE AI IN OIL & GAS MARKET, BY DEPLOYMENT MODE, 2018–2032 (USD MILLION) 33
      17. TABLE 16 US GENERATIVE AI IN OIL & GAS MARKET, BY END-USER, 2018–2032 (USD MILLION) 34
      18. TABLE 17 CANADA GENERATIVE AI IN OIL & GAS MARKET, BY FUNCTION, 2018–2032 (USD MILLION) 35
      19. TABLE 18 CANADA GENERATIVE AI IN OIL & GAS MARKET, BY APPLICATION, 2018–2032 (USD MILLION) 36
      20. TABLE 19 CANADA GENERATIVE AI IN OIL & GAS MARKET, BY DEPLOYMENT MODE, 2018–2032 (USD MILLION) 37
      21. TABLE 20 CANADA GENERATIVE AI IN OIL & GAS MARKET, BY END-USER, 2018–2032 (USD MILLION) 38
      22. TABLE 21 MEXICO GENERATIVE AI IN OIL & GAS MARKET, BY FUNCTION, 2018–2032 (USD MILLION) 39
      23. TABLE 22 MEXICO GENERATIVE AI IN OIL & GAS MARKET, BY APPLICATION, 2018–2032 (USD MILLION) 40
      24. TABLE 23 MEXICO GENERATIVE AI IN OIL & GAS MARKET, BY DEPLOYMENT MODE, 2018–2032 (USD MILLION) 41
      25. TABLE 24 MEXICO GENERATIVE AI IN OIL & GAS MARKET, BY END-USER, 2018–2032 (USD MILLION) 42
      26. TABLE 25 EUROPE GENERATIVE AI IN OIL & GAS MARKET, BY COUNTRY, 2018–2032 (USD MILLION) 43
      27. TABLE 26 EUROPE GENERATIVE AI IN OIL & GAS MARKET, BY FUNCTION, 2018–2032 (USD MILLION) 44
      28. TABLE 27 EUROPE GENERATIVE AI IN OIL & GAS MARKET, BY APPLICATION, 2018–2032 (USD MILLION) 45
      29. TABLE 28 EUROPE GENERATIVE AI IN OIL & GAS MARKET, BY DEPLOYMENT MODE, 2018–2032 (USD MILLION) 46
      30. TABLE 29 EUROPE GENERATIVE AI IN OIL & GAS MARKET, BY END-USER, 2018–2032 (USD MILLION) 47
      31. TABLE 30 UK GENERATIVE AI IN OIL & GAS MARKET, BY FUNCTION, 2018–2032 (USD MILLION) 48
      32. TABLE 31 UK GENERATIVE AI IN OIL & GAS MARKET, BY APPLICATION, 2018–2032 (USD MILLION) 49
      33. TABLE 32 UK GENERATIVE AI IN OIL & GAS MARKET, BY DEPLOYMENT MODE, 2018–2032 (USD MILLION) 50
      34. TABLE 33 UK GENERATIVE AI IN OIL & GAS MARKET, BY END-USER, 2018–2032 (USD MILLION) 51
      35. TABLE 34 GERMANY GENERATIVE AI IN OIL & GAS MARKET, BY FUNCTION, 2018–2032 (USD MILLION) 52
      36. TABLE 35 GERMANY GENERATIVE AI IN OIL & GAS MARKET, BY APPLICATION, 2018–2032 (USD MILLION) 53
      37. TABLE 36 GERMANY GENERATIVE AI IN OIL & GAS MARKET, BY DEPLOYMENT MODE, 2018–2032 (USD MILLION) 54
      38. TABLE 37 GERMANY GENERATIVE AI IN OIL & GAS MARKET, BY END-USER, 2018–2032 (USD MILLION) 55
      39. TABLE 38 FRANCE GENERATIVE AI IN OIL & GAS MARKET, BY FUNCTION, 2018–2032 (USD MILLION) 56
      40. TABLE 39 FRANCE GENERATIVE AI IN OIL & GAS MARKET, BY APPLICATION, 2018–2032 (USD MILLION) 57
      41. TABLE 40 FRANCE GENERATIVE AI IN OIL & GAS MARKET, BY DEPLOYMENT MODE, 2018–2032 (USD MILLION) 58
      42. TABLE 41 FRANCE GENERATIVE AI IN OIL & GAS MARKET, BY END-USER, 2018–2032 (USD MILLION) 59
      43. TABLE 42 SPAIN GENERATIVE AI IN OIL & GAS MARKET, BY FUNCTION, 2018–2032 (USD MILLION) 60
      44. TABLE 43 SPAIN GENERATIVE AI IN OIL & GAS MARKET, BY APPLICATION, 2018–2032 (USD MILLION) 61
      45. TABLE 44 SPAIN GENERATIVE AI IN OIL & GAS MARKET, BY DEPLOYMENT MODE, 2018–2032 (USD MILLION) 62
      46. TABLE 45 SPAIN GENERATIVE AI IN OIL & GAS MARKET, BY END-USER, 2018–2032 (USD MILLION) 63
      47. TABLE 46 ITALY GENERATIVE AI IN OIL & GAS MARKET, BY FUNCTION, 2018–2032 (USD MILLION) 64
      48. TABLE 47 ITALY GENERATIVE AI IN OIL & GAS MARKET, BY APPLICATION, 2018–2032 (USD MILLION) 65
      49. TABLE 48 ITALY GENERATIVE AI IN OIL & GAS MARKET, BY DEPLOYMENT MODE, 2018–2032 (USD MILLION) 66
      50. TABLE 49 ITALY GENERATIVE AI IN OIL & GAS MARKET, BY END-USER, 2018–2032 (USD MILLION) 67
      51. TABLE 50 REST OF EUROPE GENERATIVE AI IN OIL & GAS MARKET, BY FUNCTION, 2018–2032 (USD MILLION) 68
      52. TABLE 51 REST OF EUROPE GENERATIVE AI IN OIL & GAS MARKET, BY APPLICATION, 2018–2032 (USD MILLION) 69
      53. TABLE 52 REST OF EUROPE GENERATIVE AI IN OIL & GAS MARKET, BY DEPLOYMENT MODE, 2018–2032 (USD MILLION) 70
      54. TABLE 53 REST OF EUROPE GENERATIVE AI IN OIL & GAS MARKET, BY END-USER, 2018–2032 (USD MILLION) 71
      55. TABLE 54 ASIA-PACIFIC GENERATIVE AI IN OIL & GAS MARKET, BY COUNTRY, 2018–2032 (USD MILLION) 72
      56. TABLE 55 ASIA-PACIFIC GENERATIVE AI IN OIL & GAS MARKET, BY FUNCTION, 2018–2032 (USD MILLION) 73
      57. TABLE 56 ASIA-PACIFIC GENERATIVE AI IN OIL & GAS MARKET, BY APPLICATION, 2018–2032 (USD MILLION) 74
      58. TABLE 57 ASIA-PACIFIC GENERATIVE AI IN OIL & GAS MARKET, BY DEPLOYMENT MODE, 2018–2032 (USD MILLION) 75
      59. TABLE 58 ASIA-PACIFIC GENERATIVE AI IN OIL & GAS MARKET, BY END-USER, 2018–2032 (USD MILLION) 76
      60. TABLE 59 CHINA GENERATIVE AI IN OIL & GAS MARKET, BY FUNCTION, 2018–2032 (USD MILLION) 77
      61. TABLE 60 CHINA GENERATIVE AI IN OIL & GAS MARKET, BY APPLICATION, 2018–2032 (USD MILLION) 78
      62. TABLE 61 CHINA GENERATIVE AI IN OIL & GAS MARKET, BY DEPLOYMENT MODE, 2018–2032 (USD MILLION) 79
      63. TABLE 62 CHINA GENERATIVE AI IN OIL & GAS MARKET, BY END-USER, 2018–2032 (USD MILLION) 80
      64. TABLE 63 JAPAN GENERATIVE AI IN OIL & GAS MARKET, BY FUNCTION, 2018–2032 (USD MILLION) 81
      65. TABLE 64 JAPAN GENERATIVE AI IN OIL & GAS MARKET, BY APPLICATION, 2018–2032 (USD MILLION) 82
      66. TABLE 65 JAPAN GENERATIVE AI IN OIL & GAS MARKET, BY DEPLOYMENT MODE, 2018–2032 (USD MILLION) 83
      67. TABLE 66 JAPAN GENERATIVE AI IN OIL & GAS MARKET, BY END-USER, 2018–2032 (USD MILLION) 84
      68. TABLE 67 INDIA GENERATIVE AI IN OIL & GAS MARKET, BY FUNCTION, 2018–2032 (USD MILLION) 85
      69. TABLE 68 INDIA GENERATIVE AI IN OIL & GAS MARKET, BY APPLICATION, 2018–2032 (USD MILLION) 86
      70. TABLE 69 INDIA GENERATIVE AI IN OIL & GAS MARKET, BY DEPLOYMENT MODE, 2018–2032 (USD MILLION) 87
      71. TABLE 70 INDIA GENERATIVE AI IN OIL & GAS MARKET, BY END-USER, 2018–2032 (USD MILLION) 88
      72. TABLE 71 SOUTH KOREA GENERATIVE AI IN OIL & GAS MARKET, BY FUNCTION, 2018–2032 (USD MILLION) 89
      73. TABLE 72 SOUTH KOREA GENERATIVE AI IN OIL & GAS MARKET, BY APPLICATION, 2018–2032 (USD MILLION) 90
      74. TABLE 73 SOUTH KOREA GENERATIVE AI IN OIL & GAS MARKET, BY DEPLOYMENT MODE, 2018–2032 (USD MILLION) 91
      75. TABLE 74 SOUTH KOREA GENERATIVE AI IN OIL & GAS MARKET, BY END-USER, 2018–2032 (USD MILLION) 92
      76. TABLE 75 REST OF ASIA-PACIFIC GENERATIVE AI IN OIL & GAS MARKET, BY FUNCTION, 2018–2032 (USD MILLION) 93
      77. TABLE 76 REST OF ASIA-PACIFIC GENERATIVE AI IN OIL & GAS MARKET, BY APPLICATION, 2018–2032 (USD MILLION) 94
      78. TABLE 77 REST OF ASIA-PACIFIC GENERATIVE AI IN OIL & GAS MARKET, BY DEPLOYMENT MODE, 2018–2032 (USD MILLION) 95
      79. TABLE 78 REST OF ASIA-PACIFIC GENERATIVE AI IN OIL & GAS MARKET, BY END-USER, 2018–2032 (USD MILLION) 96
      80. TABLE 79 REST OF WORLD GENERATIVE AI IN OIL & GAS MARKET, BY COUNTRY, 2018–2032 (USD MILLION) 97
      81. TABLE 80 REST OF WORLD GENERATIVE AI IN OIL & GAS MARKET, BY FUNCTION, 2018–2032 (USD MILLION) 98
      82. TABLE 81 REST OF WORLD GENERATIVE AI IN OIL & GAS MARKET, BY APPLICATION, 2018–2032 (USD MILLION) 99
      83. TABLE 82 REST OF WORLD GENERATIVE AI IN OIL & GAS MARKET, BY DEPLOYMENT MODE, 2018–2032 (USD MILLION) 100
      84. TABLE 83 REST OF WORLD GENERATIVE AI IN OIL & GAS MARKET, BY END-USER, 2018–2032 (USD MILLION) 101
      85. TABLE 84 MIDDLE EAST & AFRICA GENERATIVE AI IN OIL & GAS MARKET, BY FUNCTION, 2018–2032 (USD MILLION) 102
      86. TABLE 85 MIDDLE EAST & AFRICA GENERATIVE AI IN OIL & GAS MARKET, BY APPLICATION, 2018–2032 (USD MILLION) 103
      87. TABLE 86 MIDDLE EAST & AFRICA GENERATIVE AI IN OIL & GAS MARKET, BY DEPLOYMENT MODE, 2018–2032 (USD MILLION) 104
      88. TABLE 87 MIDDLE EAST & AFRICA GENERATIVE AI IN OIL & GAS MARKET, BY END-USER, 2018–2032 (USD MILLION) 105
      89. TABLE 92 SOUTH AMERICA GENERATIVE AI IN OIL & GAS MARKET, BY FUNCTION, 2018–2032 (USD MILLION) 110
      90. TABLE 93 SOUTH AMERICA GENERATIVE AI IN OIL & GAS MARKET, BY APPLICATION, 2018–2032 (USD MILLION) 111
      91. TABLE 94 SOUTH AMERICA GENERATIVE AI IN OIL & GAS MARKET, BY DEPLOYMENT MODE, 2018–2032 (USD MILLION) 112
      92. TABLE 95 SOUTH AMERICA GENERATIVE AI IN OIL & GAS MARKET, BY END-USER, 2018–2032 (USD MILLION) 113
      93. TABLE 96 BUSINESS EXPANSIONS/PRODUCT LAUNCHES 114
      94. TABLE 97 PARTNERSHIPS/AGREEMENTS/CONTRACTS/COLLABORATIONS 115
      95. TABLE 98 ACQUISITIONS/MERGERS 116
      96. TABLE 99 QUANTIFIND : PRODUCTS OFFERED 117
      97. TABLE 100 QUANTIFIND : KEY DEVELOPMENT 118
      98. TABLE 101 OPENAI : PRODUCTS OFFERED 119
      99. TABLE 102 OPENAI : KEY DEVELOPMENT 120
      100. TABLE 103 ACCENTURE : PRODUCTS OFFERED 121
      101. TABLE 104 ACCENTURE : KEY DEVELOPMENT 122
      102. TABLE 105 DATAROBOT : PRODUCTS OFFERED 123
      103. TABLE 106 DATAROBOT : KEY DEVELOPMENT 124
      104. TABLE 107 SAS : PRODUCTS OFFERED 125
      105. TABLE 108 SAS : KEY DEVELOPMENT 126
      106. TABLE 109 IBM : PRODUCTS OFFERED 127
      107. TABLE 110 IBM : KEY DEVELOPMENT 128
      108. TABLE 111 MICROSOFT : PRODUCTS OFFERED 129
      109. TABLE 112 MICROSOFT : KEY DEVELOPMENT 130
      110. TABLE 113 ADOBE : PRODUCTS OFFERED 131
      111. TABLE 114 ADOBE : KEY DEVELOPMENT 132
      112. TABLE 115 NVIDIA : PRODUCTS OFFERED 133
      113. TABLE 116 NVIDIA : KEY DEVELOPMENT 134
      114. TABLE 117 INTEL : PRODUCTS OFFERED 135
      115. TABLE 118 INTEL : KEY DEVELOPMENT 136
      116. TABLE 119 GOOGLE : PRODUCTS OFFERED 137
      117. TABLE 120 GOOGLE : KEY DEVELOPMENT 138
      118. TABLE 121 OTHERS : PRODUCTS OFFERED 139
      119. TABLE 122 OTHERS : KEY DEVELOPMENT 140    LIST OF FIGURES
      120. FIGURE 1 MARKET SYNOPSIS 25
      121. FIGURE 2 MARKET ATTRACTIVENESS ANALYSIS: GLOBAL GENERATIVE AI IN OIL & GAS MARKET 26
      122. FIGURE 3 GLOBAL GENERATIVE AI IN OIL & GAS MARKET ANALYSIS, BY FUNCTION 27
      123. FIGURE 4 GLOBAL GENERATIVE AI IN OIL & GAS MARKET ANALYSIS, BY APPLICATION 28
      124. FIGURE 5 GLOBAL GENERATIVE AI IN OIL & GAS MARKET ANALYSIS, BY DEPLOYMENT MODE 29
      125. FIGURE 6 GLOBAL GENERATIVE AI IN OIL & GAS MARKET ANALYSIS, BY END-USER 30
      126. FIGURE 7 GLOBAL GENERATIVE AI IN OIL & GAS MARKET ANALYSIS, BY REGION 31
      127. FIGURE 8 GLOBAL GENERATIVE AI IN OIL & GAS MARKET: STRUCTURE 32
      128. FIGURE 9 RESEARCH PROCESS 33
      129. FIGURE 10 TOP-DOWN AND BOTTOM-UP AND APPROACHES 34
      130. FIGURE 11 NORTH AMERICA GENERATIVE AI IN OIL & GAS MARKET SIZE (USD MILLION) & MARKET SHARE (%), BY COUNTRY (2022 VS 2032) 35
      131. FIGURE 12 EUROPE GENERATIVE AI IN OIL & GAS MARKET SIZE (USD MILLION) & MARKET SHARE (%), BY COUNTRY (2022 VS 2032) 36
      132. FIGURE 13 ASIA PACIFIC GENERATIVE AI IN OIL & GAS MARKET SIZE (USD MILLION) & MARKET SHARE (%), BY COUNTRY (2022 VS 2032) 37
      133. FIGURE 14 MIDDLE EAST & AFRICA GENERATIVE AI IN OIL & GAS MARKET SIZE (USD MILLION) & MARKET SHARE (%), BY COUNTRY (2022 VS 2032) 38
      134. FIGURE 15 AFRICA GENERATIVE AI IN OIL & GAS MARKET SIZE (USD MILLION) & MARKET SHARE (%), BY COUNTRY (2022 VS 2032) 39
      135. FIGURE 16 SOUTH AMERICA GENERATIVE AI IN OIL & GAS MARKET SIZE (USD MILLION) & MARKET SHARE (%), BY COUNTRY (2022 VS 2032) 40
      136. FIGURE 17 MARKET DYNAMICS ANALYSIS OF THE GLOBAL GENERATIVE AI IN OIL & GAS MARKET 41
      137. FIGURE 18 DRIVER IMPACT ANALYSIS 42
      138. FIGURE 19 RESTRAINT IMPACT ANALYSIS 43
      139. FIGURE 20 VALUE CHAIN: GLOBAL GENERATIVE AI IN OIL & GAS MARKET 44
      140. FIGURE 21 Porter's Five Forces Analysis OF THE GLOBAL GENERATIVE AI IN OIL & GAS MARKET 45
      141. FIGURE 22 GLOBAL GENERATIVE AI IN OIL & GAS MARKET, BY FUNCTION, 2022 (% SHARE) 46
      142. FIGURE 23 GLOBAL GENERATIVE AI IN OIL & GAS MARKET, BY FUNCTION, 2022 VS 2032 (USD MILLION) 47
      143. FIGURE 24 GLOBAL GENERATIVE AI IN OIL & GAS MARKET, BY APPLICATION, 2022 (% SHARE) 48
      144. FIGURE 25 GLOBAL GENERATIVE AI IN OIL & GAS MARKET, BY APPLICATION, 2022 VS 2032 (USD MILLION) 49
      145. FIGURE 26 GLOBAL GENERATIVE AI IN OIL & GAS MARKET, BY END-USER, 2022 (% SHARE) 50
      146. FIGURE 27 GLOBAL GENERATIVE AI IN OIL & GAS MARKET, BY END-USER, 2022 VS 2032 (USD MILLION) 51
      147. FIGURE 28 GLOBAL GENERATIVE AI IN OIL & GAS MARKET, BY END-USER, 2022 VS 2032 (USD MILLION) 52
      148. FIGURE 29 GLOBAL GENERATIVE AI IN OIL & GAS MARKET, BY END-USER, 2022 VS 2032 (USD MILLION) 53
      149. FIGURE 30 GLOBAL GENERATIVE AI IN OIL & GAS MARKET, BY REGION, 2022 (% SHARE) 54
      150. FIGURE 31 GLOBAL GENERATIVE AI IN OIL & GAS MARKET, BY REGION, 2022 VS 2032 (USD MILLION) 55
      151. FIGURE 32 NORTH AMERICA GENERATIVE AI IN OIL & GAS MARKET, BY COUNTRY, 2022 (% SHARE) 56
      152. FIGURE 33 NORTH AMERICA GENERATIVE AI IN OIL & GAS MARKET, BY COUNTRY, 2022 VS 2032 (USD MILLION) 57
      153. FIGURE 34 NORTH AMERICA GENERATIVE AI IN OIL & GAS MARKET, BY FUNCTION, 2022-2032 (USD MILLION) 58
      154. FIGURE 35 NORTH AMERICA GENERATIVE AI IN OIL & GAS MARKET, BY APPLICATION, 2022-2032 (USD MILLION) 59
      155. FIGURE 36 NORTH AMERICA GENERATIVE AI IN OIL & GAS MARKET, BY END-USER, 2022-2032 (USD MILLION) 60
      156. FIGURE 37 NORTH AMERICA GENERATIVE AI IN OIL & GAS MARKET, BY END-USER, 2022-2032 (USD MILLION) 61
      157. FIGURE 38 EUROPE GENERATIVE AI IN OIL & GAS MARKET, BY COUNTRY, 2022 (% SHARE) 62
      158. FIGURE 39 EUROPE GENERATIVE AI IN OIL & GAS MARKET, BY COUNTRY, 2022 VS 2032 (USD MILLION) 63
      159. FIGURE 40 EUROPE GENERATIVE AI IN OIL & GAS MARKET, BY FUNCTION, 2022-2032 (USD MILLION) 64
      160. FIGURE 41 EUROPE GENERATIVE AI IN OIL & GAS MARKET, BY APPLICATION, 2022-2032 (USD MILLION) 65
      161. FIGURE 42 EUROPE GENERATIVE AI IN OIL & GAS MARKET, BY END-USER, 2022-2032 (USD MILLION) 66
      162. FIGURE 43 EUROPE GENERATIVE AI IN OIL & GAS MARKET, BY END-USER, 2022-2032 (USD MILLION) 67
      163. FIGURE 44 ASIA-PACIFIC GENERATIVE AI IN OIL & GAS MARKET, BY COUNTRY, 2022 (% SHARE) 68
      164. FIGURE 45 ASIA-PACIFIC GENERATIVE AI IN OIL & GAS MARKET, BY COUNTRY, 2022 VS 2032 (USD MILLION) 69
      165. FIGURE 46 ASIA-PACIFIC GENERATIVE AI IN OIL & GAS MARKET, BY FUNCTION, 2022-2032 (USD MILLION) 70
      166. FIGURE 47 ASIA-PACIFIC GENERATIVE AI IN OIL & GAS MARKET, BY APPLICATION, 2022-2032 (USD MILLION) 71
      167. FIGURE 48 ASIA-PACIFIC GENERATIVE AI IN OIL & GAS MARKET, BY END-USER, 2022-2032 (USD MILLION) 72
      168. FIGURE 49 ASIA-PACIFIC GENERATIVE AI IN OIL & GAS MARKET, BY END-USER, 2022-2032 (USD MILLION) 73
      169. FIGURE 50 MIDDLE EAST & AFRICA GENERATIVE AI IN OIL & GAS MARKET, BY COUNTRY, 2022 (% SHARE) 74
      170. FIGURE 51 MIDDLE EAST & AFRICA GENERATIVE AI IN OIL & GAS MARKET, BY COUNTRY, 2022 VS 2032 (USD MILLION) 75
      171. FIGURE 52 MIDDLE EAST & AFRICA GENERATIVE AI IN OIL & GAS MARKET, BY FUNCTION, 2022-2032 (USD MILLION) 76
      172. FIGURE 53 MIDDLE EAST & AFRICA GENERATIVE AI IN OIL & GAS MARKET, BY APPLICATION, 2022-2032 (USD MILLION) 77
      173. FIGURE 54 MIDDLE EAST & AFRICA GENERATIVE AI IN OIL & GAS MARKET, BY END-USER, 2022-2032 (USD MILLION) 78
      174. FIGURE 55 MIDDLE EAST & AFRICA GENERATIVE AI IN OIL & GAS MARKET, BY END-USER, 2022-2032 (USD MILLION) 79
      175. FIGURE 62 SOUTH AMERICA GENERATIVE AI IN OIL & GAS MARKET, BY COUNTRY, 2022 (% SHARE) 86
      176. FIGURE 63 SOUTH AMERICA GENERATIVE AI IN OIL & GAS MARKET, BY COUNTRY, 2022 VS 2032 (USD MILLION) 87
      177. FIGURE 64 SOUTH AMERICA GENERATIVE AI IN OIL & GAS MARKET, BY FUNCTION, 2022-2032 (USD MILLION) 88
      178. FIGURE 65 SOUTH AMERICA GENERATIVE AI IN OIL & GAS MARKET, BY APPLICATION, 2022-2032 (USD MILLION) 89
      179. FIGURE 66 SOUTH AMERICA GENERATIVE AI IN OIL & GAS MARKET, BY END-USER, 2022-2032 (USD MILLION) 90
      180. FIGURE 67 SOUTH AMERICA GENERATIVE AI IN OIL & GAS MARKET, BY END-USER, 2022-2032 (USD MILLION) 91
      181. FIGURE 68 GLOBAL GENERATIVE AI IN OIL & GAS MARKET: COMPETITIVE BENCHMARKING 92
      182. FIGURE 69 VENDOR SHARE ANALYSIS (2022) (%) 93
      183. FIGURE 70 QUANTIFIND : FINANCIAL OVERVIEW SNAPSHOT 94
      184. FIGURE 71 QUANTIFIND : SWOT ANALYSIS 95
      185. FIGURE 72 OPENAI : FINANCIAL OVERVIEW SNAPSHOT 96
      186. FIGURE 73 OPENAI : SWOT ANALYSIS 97
      187. FIGURE 74 ACCENTURE : FINANCIAL OVERVIEW SNAPSHOT 98
      188. FIGURE 75 ACCENTURE : SWOT ANALYSIS 99
      189. FIGURE 76 DATAROBOT : FINANCIAL OVERVIEW SNAPSHOT 100
      190. FIGURE 77 DATAROBOT : SWOT ANALYSIS 101
      191. FIGURE 78 SAS : FINANCIAL OVERVIEW SNAPSHOT 102
      192. FIGURE 79 SAS : SWOT ANALYSIS 103
      193. FIGURE 80 IBM : FINANCIAL OVERVIEW SNAPSHOT 104
      194. FIGURE 81 IBM : SWOT ANALYSIS 105
      195. FIGURE 82 MICROSOFT : FINANCIAL OVERVIEW SNAPSHOT 106
      196. FIGURE 83 MICROSOFT : SWOT ANALYSIS 107
      197. FIGURE 84 ADOBE : FINANCIAL OVERVIEW SNAPSHOT 108
      198. FIGURE 85 ADOBE : SWOT ANALYSIS 109
      199. FIGURE 86 NVIDIA : FINANCIAL OVERVIEW SNAPSHOT 110
      200. FIGURE 87 NVIDIA : SWOT ANALYSIS 111
      201. FIGURE 88 INTEL : FINANCIAL OVERVIEW SNAPSHOT 112
      202. FIGURE 89 INTEL : SWOT ANALYSIS 113
      203. FIGURE 90 GOOGLE : FINANCIAL OVERVIEW SNAPSHOT 114
      204. FIGURE 91 GOOGLE : SWOT ANALYSIS 115
      205. FIGURE 92 OTHERS : FINANCIAL OVERVIEW SNAPSHOT 116
      206. FIGURE 93 OTHERS : SWOT ANALYSIS 117

    Generative AI in Oil & Gas Market Segmentation

    Market Segmentation Overview

    • Detailed segmentation data will be available in the full report
    • Comprehensive analysis by multiple parameters
    • Regional and country-level breakdowns
    • Market size forecasts by segment
    Infographic

    Free Sample Request

    Kindly complete the form below to receive a free sample of this Report

    Get Free Sample

    Customer Strories

    “I am very pleased with how market segments have been defined in a relevant way for my purposes (such as "Portable Freezers & refrigerators" and "last-mile"). In general the report is well structured. Thanks very much for your efforts.”

    Victoria Milne

    Founder
    Case Study
    Chemicals and Materials