Gel Battery Market (2026 - 2035)

ID: MRFR/EnP/8976-HCR 111 Pages Anshula Mandaokar Last Updated: October 16, 2026
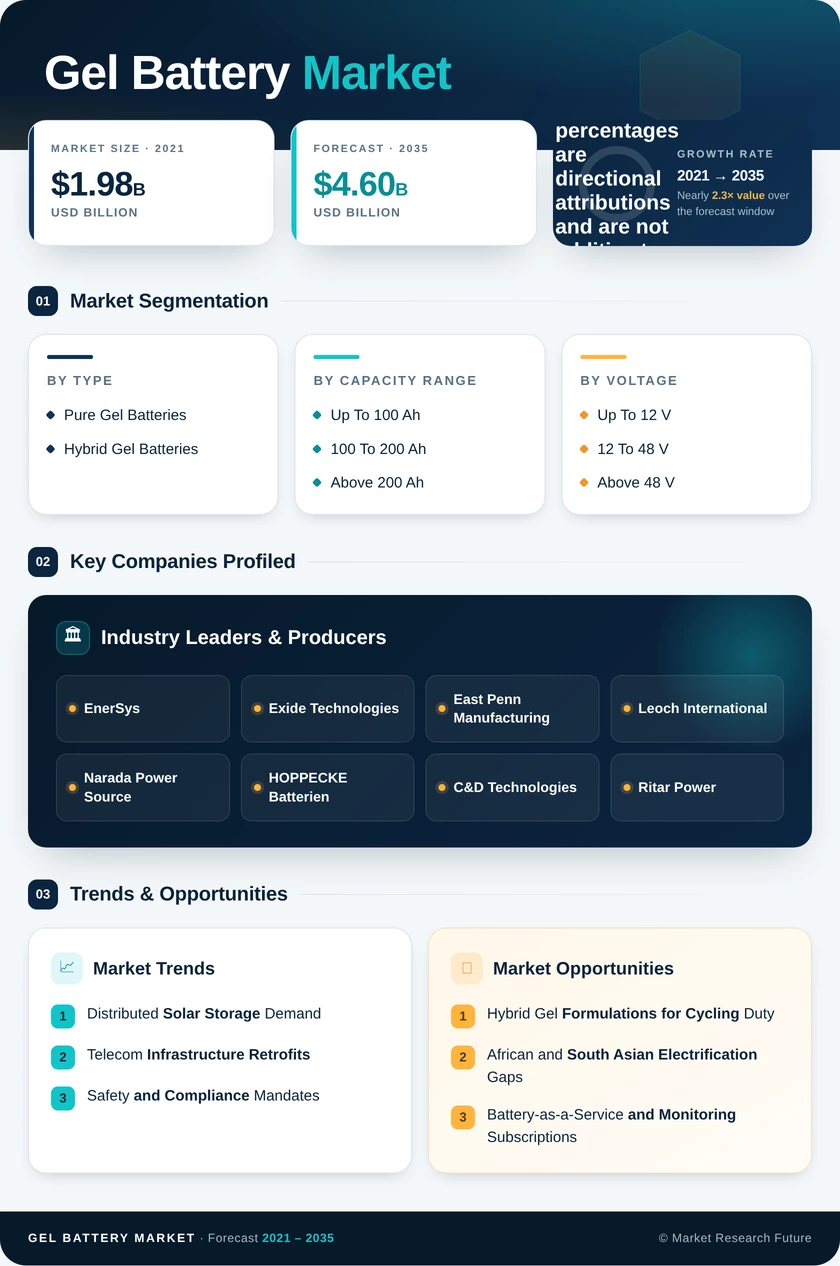
Gel Battery Market Research Report By Type (Pure Gel Batteries, Hybrid Gel Batteries), By Capacity Range (Up To 100 Ah, 100 To 200 Ah, Above 200 Ah), By Voltage (Up To 12 V, 12 To 48 V, Above 48 V), By Application (Renewable Energy Storage, Telecommunications, UPS & Data Centres, Marine & Recreational Vehicles, Medical & Mobility Equipment, Others), By End-User (Industrial, Commercial, Residential, Government & Defence) - Forecast to 2035
Gel Battery Market
Market Size
Forecast Period2026-2035
CAGR (2026-2035)6.6%
2025 Market SizeUSD 2.43 Billion
2035 Market SizeUSD 4.60 Billion
Key Players
EnerSys
Exide Technologies
East Penn Manufacturing
Leoch International
Narada Power Source
HOPPECKE Batterien
Opportunities
  • Hybrid Gel Formulations for Cycling Duty
  • African and South Asian Electrification Gaps
  • Battery-as-a-Service and Monitoring Subscriptions
  1. 1 Market Overview | |
    1. 1.1 Study Assumptions & Market Definition | |
    2. 1.2 Scope of the Study | |
    3. 1.3 Research Methodology | |
  2. 2 Market Summary & Key Report Takeaways | |
    1. 2.1 By Technology | |
    2. 2.2 By Sector | |
    3. 2.3 By Geography | |
  3. 3 Market Size & Forecast (2021–2035) | |
    1. 3.1 Historical Market Size (2021–2025) | |
    2. 3.2 Current & Forecast Market Size (2026–2035) | |
    3. 3.3 Market Size by Revenue (USD Billion) | |
    4. 3.4 Year-over-Year Growth Analysis | |
  4. 4 Driver Impact Analysis | |
    1. 4.1 Distributed Solar Storage Demand | |
    2. 4.2 Telecom Infrastructure Retrofits | |
    3. 4.3 Safety and Compliance Mandates | |
    4. 4.4 Backup Power for Critical Facilities | |
  5. 5 Restraints Impact Analysis | |
    1. 5.1 Lithium Price Compression | |
    2. 5.2 Raw Material Exposure | |
    3. 5.3 Regulatory Burden on Lead Handling | |
  6. 6 Opportunity Analysis | |
    1. 6.1 Hybrid Gel Formulations for Cycling Duty | |
    2. 6.2 African and South Asian Electrification Gaps | |
    3. 6.3 Battery-as-a-Service and Monitoring Subscriptions | |
    4. 6.4 Circular Supply Chains and Recovered Lead | |
    5. 6.5 Marine and Recreational Vehicle Retrofits | |
    6. 6.6 Industry Value Chain Analysis | |
    7. 6.7 Porter's Five Forces Analysis | |
  7. 7 Regional Market Share & Country-Level Analysis | |
    1. 7.1 North America | | |
      1. 7.1.1 US | | |
      2. 7.1.2 Canada | | |
      3. 7.1.3 Mexico | |
    2. 7.2 Europe | | |
      1. 7.2.1 Germany | | |
      2. 7.2.2 UK | | |
      3. 7.2.3 France | | |
      4. 7.2.4 Italy | | |
      5. 7.2.5 Spain | | |
      6. 7.2.6 Nordic Countries | | |
      7. 7.2.7 Russia | | |
      8. 7.2.8 Rest of Europe | |
    3. 7.3 Asia-Pacific | | |
      1. 7.3.1 China | | |
      2. 7.3.2 India | | |
      3. 7.3.3 Japan | | |
      4. 7.3.4 South Korea | | |
      5. 7.3.5 ASEAN | | |
      6. 7.3.6 Rest of Asia-Pacific | |
    4. 7.4 South America | | |
      1. 7.4.1 Brazil | | |
      2. 7.4.2 Argentina | | |
      3. 7.4.3 Rest of South America | |
    5. 7.5 Middle East & Africa | | |
      1. 7.5.1 Saudi Arabia | | |
      2. 7.5.2 UAE | | |
      3. 7.5.3 South Africa | | |
      4. 7.5.4 Egypt | | |
      5. 7.5.5 Rest of Middle East & Africa | |
  8. 8 Future Outlook (2026–2035) | |
    1. 8.1 Electrification Supercycle | |
    2. 8.2 Intelligent Fleet Management | |
    3. 8.3 Circularity as Competitive Moat | |
    4. 8.4 Coexistence Rather Than Displacement | |
  9. 9 Segmentation Analysis | |
    1. 9.1 By Type | | |
      1. 9.1.1 Pure Gel Batteries | | |
      2. 9.1.2 Hybrid Gel Batteries | |
    2. 9.2 By Capacity Range | | |
      1. 9.2.1 Up To 100 Ah | | |
      2. 9.2.2 100 To 200 Ah | | |
      3. 9.2.3 Above 200 Ah | |
    3. 9.3 By Voltage | | |
      1. 9.3.1 Up To 12 V | | |
      2. 9.3.2 12 To 48 V | | |
      3. 9.3.3 Above 48 V | |
    4. 9.4 By Application | | |
      1. 9.4.1 Renewable Energy Storage | | |
      2. 9.4.2 Telecommunications | | |
      3. 9.4.3 UPS & Data Centres | | |
      4. 9.4.4 Marine & Recreational Vehicles | | |
      5. 9.4.5 Medical & Mobility Equipment | | |
      6. 9.4.6 Others | |
    5. 9.5 By End-User | | |
      1. 9.5.1 Industrial | | |
      2. 9.5.2 Commercial | | |
      3. 9.5.3 Residential | | |
      4. 9.5.4 Government & Defence | |
  10. 10 Competitive Landscape | |
    1. 10.1 Market Share Analysis (2026) | |
    2. 10.2 Competitive Benchmarking Matrix | |
    3. 10.3 Company Profiles | | |
      1. 10.3.1 EnerSys | | |
      2. 10.3.2 Exide Technologies | | |
      3. 10.3.3 East Penn Manufacturing | | |
      4. 10.3.4 Leoch International | | |
      5. 10.3.5 Narada Power Source | | |
      6. 10.3.6 Trojan Battery Company | | |
      7. 10.3.7 HOPPECKE Batterien | | |
      8. 10.3.8 C&D Technologies | | |
      9. 10.3.9 Ritar Power | | |
      10. 10.3.10 Sacred Sun | | |
      11. 10.3.11 Amara Raja Energy & Mobility | | |
      12. 10.3.12 Victron Energy | |
  11. 11 Recent News & Developments | |
  12. 12 Report Scope & Methodology | |
    1. 12.1 Study Period & Base Year | |
    2. 12.2 Data Sources & Citations | |
    3. 12.3 Abbreviations | |
  13. 13 Detailed Sources & Citations | |
  14. 14 Frequently Asked Questions | | LIST OF TABLES | |
  15. TABLE 1 Global Gel Battery Market Size & Forecast, by Revenue (USD Billion), 2021–2035 | |
  16. TABLE 2 Global Gel Battery Market – Year-over-Year Growth Analysis, 2021–2035 | |
  17. TABLE 3 Driver Impact Analysis Matrix, 2026–2035 | |
  18. TABLE 4 Restraint Impact Analysis Matrix, 2026–2035 | |
  19. TABLE 5 Global Gel Battery Market Size, by Region, 2021–2035 (USD Billion) | |
  20. TABLE 6 North America Gel Battery Market Size, by Country, 2021–2035 (USD Billion) | |
  21. TABLE 7 Europe Gel Battery Market Size, by Country, 2021–2035 (USD Billion) | |
  22. TABLE 8 Asia-Pacific Gel Battery Market Size, by Country, 2021–2035 (USD Billion) | |
  23. TABLE 9 South America Gel Battery Market Size, by Country, 2021–2035 (USD Billion) | |
  24. TABLE 10 Middle East & Africa Gel Battery Market Size, by Country, 2021–2035 (USD Billion) | |
  25. TABLE 11 Global Gel Battery Market Size, by Type, 2021–2035 (USD Billion) | |
  26. TABLE 12 Global Gel Battery Market Size, by Capacity Range, 2021–2035 (USD Billion) | |
  27. TABLE 13 Global Gel Battery Market Size, by Voltage, 2021–2035 (USD Billion) | |
  28. TABLE 14 Global Gel Battery Market Size, by Application, 2021–2035 (USD Billion) | |
  29. TABLE 15 Global Gel Battery Market Size, by End-User, 2021–2035 (USD Billion) | |
  30. TABLE 16 North America Gel Battery Market Size, by Application, 2021–2035 (USD Billion) | |
  31. TABLE 17 Europe Gel Battery Market Size, by Application, 2021–2035 (USD Billion) | |
  32. TABLE 18 Asia-Pacific Gel Battery Market Size, by Application, 2021–2035 (USD Billion) | |
  33. TABLE 19 South America Gel Battery Market Size, by End-User, 2021–2035 (USD Billion) | |
  34. TABLE 20 Middle East & Africa Gel Battery Market Size, by End-User, 2021–2035 (USD Billion) | |
  35. TABLE 21 Competitive Benchmarking Matrix – Global Gel Battery Market, 2026 | |
  36. TABLE 22 Company Profiles – Key Players, Global Gel Battery Market | |
  37. TABLE 23 Recent Developments & Strategic Announcements, 2023–2025 | |
  38. TABLE 24 Report Scope & Methodology Summary | |
  39. TABLE 25 Detailed Sources & Citations Index | | LIST OF FIGURES | |
  40. FIGURE 1 Global Gel Battery Market – Market Dynamics Overview (Drivers, Restraints, Opportunities) | |
  41. FIGURE 2 Industry Value Chain Analysis – Gel Battery Market | |
  42. FIGURE 3 Porter's Five Forces Analysis – Gel Battery Market | |
  43. FIGURE 4 Global Gel Battery Market Size Trend, 2021–2035 (USD Billion) | |
  44. FIGURE 5 Year-over-Year Growth Trend, 2022–2035 (%) | |
  45. FIGURE 6 Market Share by Type, 2025 vs 2035 (%) | |
  46. FIGURE 7 Market Share by Capacity Range, 2025 (%) | |
  47. FIGURE 8 Market Share by Voltage, 2025 (%) | |
  48. FIGURE 9 Market Share by Application, 2025 (%) | |
  49. FIGURE 10 Market Share by End-User, 2025 (%) | |
  50. FIGURE 11 Regional Revenue Share, 2025 (%) | |
  51. FIGURE 12 Regional CAGR Comparison, 2026–2035 (%) | |
  52. FIGURE 13 Country-Level Revenue Contribution – Asia-Pacific, 2025 (%) | |
  53. FIGURE 14 Competitive Landscape – Revenue Share Range Distribution, 2026 | |
  54. FIGURE 15 Strategic Positioning Map – Leading Manufacturers

Segmentation Quick Reference

DimensionSub-SegmentsDominant SegmentFastest Growing Segment
By TypePure Gel Batteries; Hybrid Gel BatteriesPure Gel BatteriesHybrid Gel Batteries
By Capacity RangeUp To 100 Ah; 100 To 200 Ah; Above 200 AhUp To 100 Ah100 To 200 Ah
By VoltageUp To 12 V; 12 To 48 V; Above 48 VUp To 12 V12 To 48 V
By ApplicationRenewable Energy Storage; Telecommunications; UPS & Data Centres; Marine & Recreational Vehicles; Medical & Mobility Equipment; OthersRenewable Energy StorageRenewable Energy Storage
By End-UserIndustrial; Commercial; Residential; Government & DefenceIndustrialCommercial
By GeographyNorth America; Europe; Asia-Pacific; South America; Middle East & AfricaAsia-PacificAsia-Pacific


Market Segmentation Overview

By Type

Sub-SegmentKey Trend
Pure Gel BatteriesCost-led defence against lithium in stationary backup duty
Hybrid Gel BatteriesImproved charge acceptance opening solar and cycling applications


Type economics split cleanly between volume and margin. Pure gel carries the installed base and the price sensitivity; hybrid designs win the tenders where cycling frequency once disqualified the technology entirely.

By Capacity Range

Sub-SegmentKey Trend
Up To 100 AhResidential rooftop and small UPS proliferation
100 To 200 AhTelecom cabinet standardisation driving fastest growth
Above 200 AhIndustrial and utility banks with long replacement cycles


Capacity selection tracks enclosure constraints more than energy requirements. Installers build strings from standard blocks, so the 100–200 Ah band benefits from being the natural fit for telecom and commercial cabinet footprints.

By Voltage

Sub-SegmentKey Trend
Up To 12 VModular series-string construction across all applications
12 To 48 VHybrid inverter and rectifier standards pulling demand upward
Above 48 VSpecialised industrial DC and traction applications


Voltage migration is quietly reshaping product roadmaps. As inverter manufacturers converge on 48 V nominal architectures, battery suppliers are redesigning form factors and terminal layouts to match rack conventions rather than legacy shelf dimensions.

By Application

Sub-SegmentKey Trend
Renewable Energy StorageOff-grid and hybrid solar remain the anchor demand pool
TelecommunicationsDiesel displacement at tower sites in high-temperature geographies
UPS & Data CentresEdge compute buildout sustaining sealed backup specification
Marine & Recreational VehiclesInsurance and fire-code pressure favouring sealed installations
Medical & Mobility EquipmentSteady replacement demand with premium pricing
OthersSecurity, signage, and agricultural control systems


Application demand concentrates where ventilation is unavailable, and service visits are costly. That single operating characteristic explains why renewable storage and telecommunications together account for well over half of global consumption.

By End-User

Sub-SegmentKey Trend
IndustrialPredictable replacement cycles tied to plant maintenance windows
CommercialFastest expansion as new facilities add backup requirements
ResidentialLoad-shedding and rooftop solar attach rates lifting volume
Government & DefenceField communications and facility resilience procurement


End-user growth differentials come down to installed-base age. Industrial demand is replacement-driven and stable; commercial demand is expansion-driven and therefore compounds faster through the forecast decade.




Download PDF ×

We do not share your information with anyone. However, we may send you emails based on your report interest from time to time. You may contact us at any time to opt-out.