Request Free Sample ×

Kindly complete the form below to receive a free sample of this Report

* Please use a valid business email

Leading companies partner with us for data-driven Insights

clients tt-cursor
Hero Background

GCC Teledermatology Market

ID: MRFR/HC/49984-HCR
200 Pages
Rahul Gotadki
Last Updated: April 06, 2026

GCC Teledermatology Market Research Report: Size, Share, Trend Analysis By Technology (Store and Forward, Real-Time Consultation, Remote Patient Monitoring), By End Use (Hospitals, Diagnostic Laboratories, Home Healthcare), By Applications (Skin Cancer Diagnosis, Psoriasis Treatment, Dermatological Consultation) and By Service Model (Cloud-Based Services, Web-Based Services, Software as a Service) - Growth Outlook & Industry Forecast 2025 To 2035

Share:
Download PDF ×

We do not share your information with anyone. However, we may send you emails based on your report interest from time to time. You may contact us at any time to opt-out.

GCC Teledermatology Market Infographic
Purchase Options
  1. 1 SECTION I: EXECUTIVE SUMMARY AND KEY HIGHLIGHTS
  2.   1.1 EXECUTIVE SUMMARY
  3.     1.1.1 Market Overview
  4.     1.1.2 Key Findings
  5.     1.1.3 Market Segmentation
  6.     1.1.4 Competitive Landscape
  7.     1.1.5 Challenges and Opportunities
  8.     1.1.6 Future Outlook
  9. 2 SECTION II: SCOPING, METHODOLOGY AND MARKET STRUCTURE
  10.   2.1 MARKET INTRODUCTION
  11.     2.1.1 Definition
  12.     2.1.2 Scope of the study
  13.       2.1.2.1 Research Objective
  14.       2.1.2.2 Assumption
  15.       2.1.2.3 Limitations
  16.   2.2 RESEARCH METHODOLOGY
  17.     2.2.1 Overview
  18.     2.2.2 Data Mining
  19.     2.2.3 Secondary Research
  20.     2.2.4 Primary Research
  21.       2.2.4.1 Primary Interviews and Information Gathering Process
  22.       2.2.4.2 Breakdown of Primary Respondents
  23.     2.2.5 Forecasting Model
  24.     2.2.6 Market Size Estimation
  25.       2.2.6.1 Bottom-Up Approach
  26.       2.2.6.2 Top-Down Approach
  27.     2.2.7 Data Triangulation
  28.     2.2.8 Validation
  29. 3 SECTION III: QUALITATIVE ANALYSIS
  30.   3.1 MARKET DYNAMICS
  31.     3.1.1 Overview
  32.     3.1.2 Drivers
  33.     3.1.3 Restraints
  34.     3.1.4 Opportunities
  35.   3.2 MARKET FACTOR ANALYSIS
  36.     3.2.1 Value chain Analysis
  37.     3.2.2 Porter's Five Forces Analysis
  38.       3.2.2.1 Bargaining Power of Suppliers
  39.       3.2.2.2 Bargaining Power of Buyers
  40.       3.2.2.3 Threat of New Entrants
  41.       3.2.2.4 Threat of Substitutes
  42.       3.2.2.5 Intensity of Rivalry
  43.     3.2.3 COVID-19 Impact Analysis
  44.       3.2.3.1 Market Impact Analysis
  45.       3.2.3.2 Regional Impact
  46.       3.2.3.3 Opportunity and Threat Analysis
  47. 4 SECTION IV: QUANTITATIVE ANALYSIS
  48.   4.1 Food, Beverages & Nutrition, BY Technology (USD Million)
  49.     4.1.1 Store and Forward
  50.     4.1.2 Real-Time Consultation
  51.     4.1.3 Remote Patient Monitoring
  52.   4.2 Food, Beverages & Nutrition, BY End Use (USD Million)
  53.     4.2.1 Hospitals
  54.     4.2.2 Diagnostic Laboratories
  55.     4.2.3 Home Healthcare
  56.   4.3 Food, Beverages & Nutrition, BY Application (USD Million)
  57.     4.3.1 Skin Cancer Diagnosis
  58.     4.3.2 Psoriasis Treatment
  59.     4.3.3 Dermatological Consultation
  60.   4.4 Food, Beverages & Nutrition, BY Service Model (USD Million)
  61.     4.4.1 Cloud-Based Services
  62.     4.4.2 Web-Based Services
  63.     4.4.3 Software as a Service
  64. 5 SECTION V: COMPETITIVE ANALYSIS
  65.   5.1 Competitive Landscape
  66.     5.1.1 Overview
  67.     5.1.2 Competitive Analysis
  68.     5.1.3 Market share Analysis
  69.     5.1.4 Major Growth Strategy in the Food, Beverages & Nutrition
  70.     5.1.5 Competitive Benchmarking
  71.     5.1.6 Leading Players in Terms of Number of Developments in the Food, Beverages & Nutrition
  72.     5.1.7 Key developments and growth strategies
  73.       5.1.7.1 New Product Launch/Service Deployment
  74.       5.1.7.2 Merger & Acquisitions
  75.       5.1.7.3 Joint Ventures
  76.     5.1.8 Major Players Financial Matrix
  77.       5.1.8.1 Sales and Operating Income
  78.       5.1.8.2 Major Players R&D Expenditure. 2023
  79.   5.2 Company Profiles
  80.     5.2.1 DermTech (US)
  81.       5.2.1.1 Financial Overview
  82.       5.2.1.2 Products Offered
  83.       5.2.1.3 Key Developments
  84.       5.2.1.4 SWOT Analysis
  85.       5.2.1.5 Key Strategies
  86.     5.2.2 Maven Clinic (US)
  87.       5.2.2.1 Financial Overview
  88.       5.2.2.2 Products Offered
  89.       5.2.2.3 Key Developments
  90.       5.2.2.4 SWOT Analysis
  91.       5.2.2.5 Key Strategies
  92.     5.2.3 Doxy.me (US)
  93.       5.2.3.1 Financial Overview
  94.       5.2.3.2 Products Offered
  95.       5.2.3.3 Key Developments
  96.       5.2.3.4 SWOT Analysis
  97.       5.2.3.5 Key Strategies
  98.     5.2.4 Zocdoc (US)
  99.       5.2.4.1 Financial Overview
  100.       5.2.4.2 Products Offered
  101.       5.2.4.3 Key Developments
  102.       5.2.4.4 SWOT Analysis
  103.       5.2.4.5 Key Strategies
  104.     5.2.5 SkinVision (NL)
  105.       5.2.5.1 Financial Overview
  106.       5.2.5.2 Products Offered
  107.       5.2.5.3 Key Developments
  108.       5.2.5.4 SWOT Analysis
  109.       5.2.5.5 Key Strategies
  110.     5.2.6 TeleDerm (AU)
  111.       5.2.6.1 Financial Overview
  112.       5.2.6.2 Products Offered
  113.       5.2.6.3 Key Developments
  114.       5.2.6.4 SWOT Analysis
  115.       5.2.6.5 Key Strategies
  116.     5.2.7 MDLIVE (US)
  117.       5.2.7.1 Financial Overview
  118.       5.2.7.2 Products Offered
  119.       5.2.7.3 Key Developments
  120.       5.2.7.4 SWOT Analysis
  121.       5.2.7.5 Key Strategies
  122.     5.2.8 HealthTap (US)
  123.       5.2.8.1 Financial Overview
  124.       5.2.8.2 Products Offered
  125.       5.2.8.3 Key Developments
  126.       5.2.8.4 SWOT Analysis
  127.       5.2.8.5 Key Strategies
  128.   5.3 Appendix
  129.     5.3.1 References
  130.     5.3.2 Related Reports
  131. 6 LIST OF FIGURES
  132.   6.1 MARKET SYNOPSIS
  133.   6.2 GCC MARKET ANALYSIS BY TECHNOLOGY
  134.   6.3 GCC MARKET ANALYSIS BY END USE
  135.   6.4 GCC MARKET ANALYSIS BY APPLICATION
  136.   6.5 GCC MARKET ANALYSIS BY SERVICE MODEL
  137.   6.6 KEY BUYING CRITERIA OF FOOD, BEVERAGES & NUTRITION
  138.   6.7 RESEARCH PROCESS OF MRFR
  139.   6.8 DRO ANALYSIS OF FOOD, BEVERAGES & NUTRITION
  140.   6.9 DRIVERS IMPACT ANALYSIS: FOOD, BEVERAGES & NUTRITION
  141.   6.10 RESTRAINTS IMPACT ANALYSIS: FOOD, BEVERAGES & NUTRITION
  142.   6.11 SUPPLY / VALUE CHAIN: FOOD, BEVERAGES & NUTRITION
  143.   6.12 FOOD, BEVERAGES & NUTRITION, BY TECHNOLOGY, 2024 (% SHARE)
  144.   6.13 FOOD, BEVERAGES & NUTRITION, BY TECHNOLOGY, 2024 TO 2035 (USD Million)
  145.   6.14 FOOD, BEVERAGES & NUTRITION, BY END USE, 2024 (% SHARE)
  146.   6.15 FOOD, BEVERAGES & NUTRITION, BY END USE, 2024 TO 2035 (USD Million)
  147.   6.16 FOOD, BEVERAGES & NUTRITION, BY APPLICATION, 2024 (% SHARE)
  148.   6.17 FOOD, BEVERAGES & NUTRITION, BY APPLICATION, 2024 TO 2035 (USD Million)
  149.   6.18 FOOD, BEVERAGES & NUTRITION, BY SERVICE MODEL, 2024 (% SHARE)
  150.   6.19 FOOD, BEVERAGES & NUTRITION, BY SERVICE MODEL, 2024 TO 2035 (USD Million)
  151.   6.20 BENCHMARKING OF MAJOR COMPETITORS
  152. 7 LIST OF TABLES
  153.   7.1 LIST OF ASSUMPTIONS
  154.     7.1.1
  155.   7.2 GCC MARKET SIZE ESTIMATES; FORECAST
  156.     7.2.1 BY TECHNOLOGY, 2025-2035 (USD Million)
  157.     7.2.2 BY END USE, 2025-2035 (USD Million)
  158.     7.2.3 BY APPLICATION, 2025-2035 (USD Million)
  159.     7.2.4 BY SERVICE MODEL, 2025-2035 (USD Million)
  160.   7.3 PRODUCT LAUNCH/PRODUCT DEVELOPMENT/APPROVAL
  161.     7.3.1
  162.   7.4 ACQUISITION/PARTNERSHIP
  163.     7.4.1

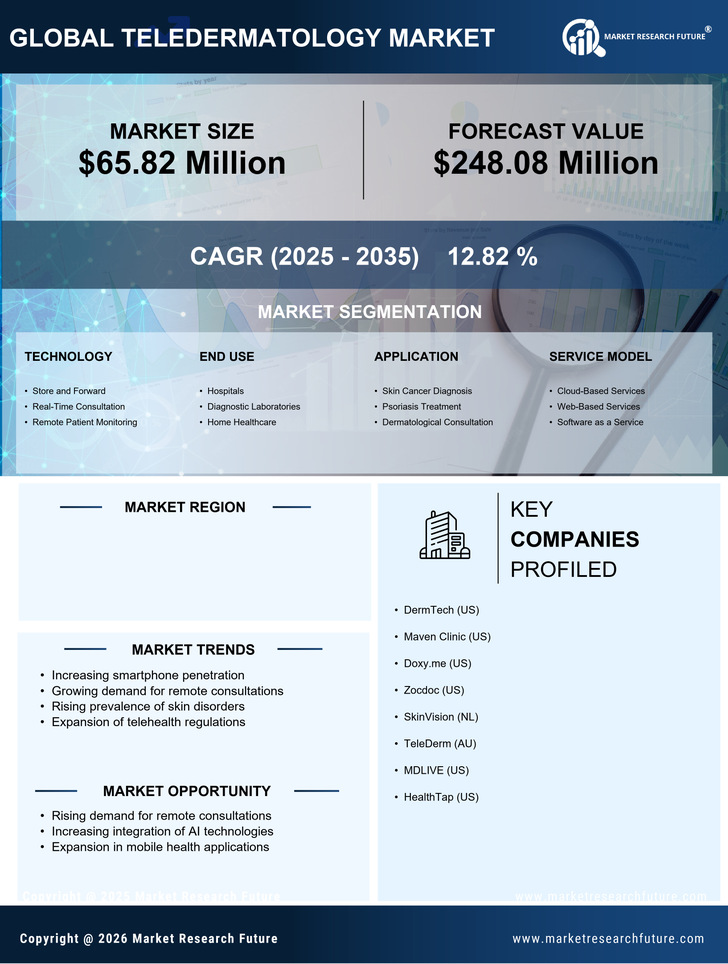
GCC Food, Beverages & Nutrition Market Segmentation

Food, Beverages & Nutrition By Technology (USD Million, 2025-2035)

  • Store and Forward
  • Real-Time Consultation
  • Remote Patient Monitoring

Food, Beverages & Nutrition By End Use (USD Million, 2025-2035)

  • Hospitals
  • Diagnostic Laboratories
  • Home Healthcare

Food, Beverages & Nutrition By Application (USD Million, 2025-2035)

  • Skin Cancer Diagnosis
  • Psoriasis Treatment
  • Dermatological Consultation

Food, Beverages & Nutrition By Service Model (USD Million, 2025-2035)

  • Cloud-Based Services
  • Web-Based Services
  • Software as a Service

Compare Licence

×
Features License Type
Single User Multiuser License Enterprise User
Price $4,950 $5,950 $7,250
Maximum User Access Limit 1 User Upto 10 Users Unrestricted Access Throughout the Organization
Free Customization
Direct Access to Analyst
Deliverable Format
Platform Access
Discount on Next Purchase 10% 15% 15%
Printable Versions