Request Free Sample ×

Kindly complete the form below to receive a free sample of this Report

* Please use a valid business email

Leading companies partner with us for data-driven Insights

clients tt-cursor
Hero Background

GCC AI in Transportation Market

ID: MRFR/ICT/57098-HCR
200 Pages
Kiran Jinkalwad
Last Updated: April 06, 2026

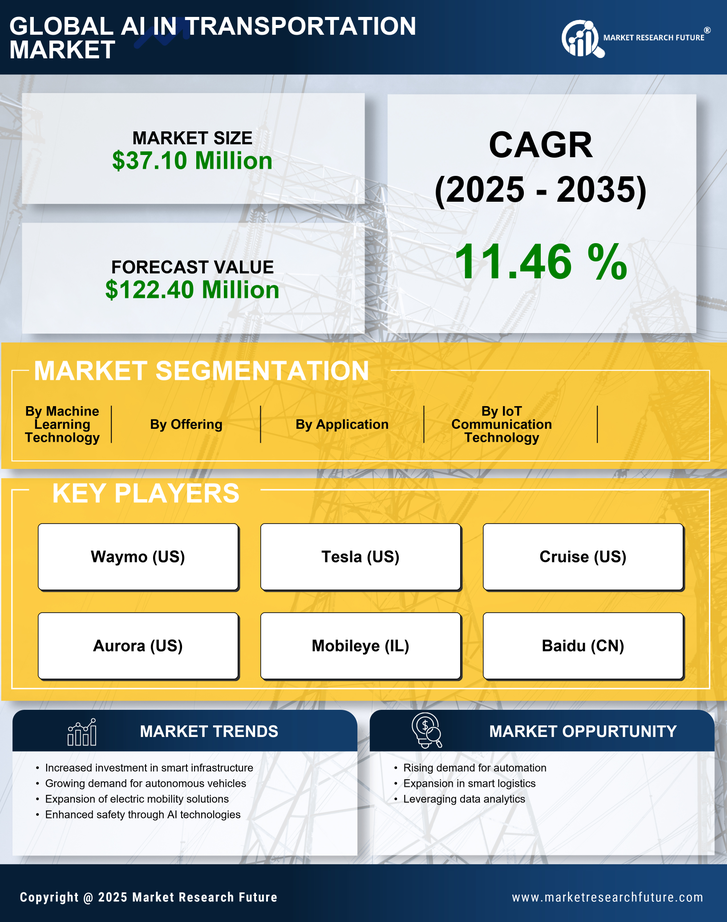
GCC AI in Transportation Market Research Report By Offering (Hardware, Services, Software), By IoT Communication Technology (Cellular, LPWAN, LoRaWAN, Z-Wave, Zigbee, NFC, Bluetooth, Others), By Application (Autonomous Truck, Semi-autonomous Truck, Truck Platooning, Human-Machine Interface (HMI), Predictive Maintenance, Precision & Mapping, Traffic Detection, Computer Vision-Powered Parking Management, Road Condition Monitoring, Automatic Traffic Incident Detection, Driver Monitoring, Others), and By Machine Learning Technology (Deep Learning, Computer Vision, Natural Language Processing, Context Awareness)- Forecast to 2035

Share:
Download PDF ×

We do not share your information with anyone. However, we may send you emails based on your report interest from time to time. You may contact us at any time to opt-out.

GCC AI in Transportation Market Infographic
Purchase Options
  1. 1 SECTION I: EXECUTIVE SUMMARY AND KEY HIGHLIGHTS
  2.   1.1 EXECUTIVE SUMMARY
  3.     1.1.1 Market Overview
  4.     1.1.2 Key Findings
  5.     1.1.3 Market Segmentation
  6.     1.1.4 Competitive Landscape
  7.     1.1.5 Challenges and Opportunities
  8.     1.1.6 Future Outlook
  9. 2 SECTION II: SCOPING, METHODOLOGY AND MARKET STRUCTURE
  10.   2.1 MARKET INTRODUCTION
  11.     2.1.1 Definition
  12.     2.1.2 Scope of the study
  13.       2.1.2.1 Research Objective
  14.       2.1.2.2 Assumption
  15.       2.1.2.3 Limitations
  16.   2.2 RESEARCH METHODOLOGY
  17.     2.2.1 Overview
  18.     2.2.2 Data Mining
  19.     2.2.3 Secondary Research
  20.     2.2.4 Primary Research
  21.       2.2.4.1 Primary Interviews and Information Gathering Process
  22.       2.2.4.2 Breakdown of Primary Respondents
  23.     2.2.5 Forecasting Model
  24.     2.2.6 Market Size Estimation
  25.       2.2.6.1 Bottom-Up Approach
  26.       2.2.6.2 Top-Down Approach
  27.     2.2.7 Data Triangulation
  28.     2.2.8 Validation
  29. 3 SECTION III: QUALITATIVE ANALYSIS
  30.   3.1 MARKET DYNAMICS
  31.     3.1.1 Overview
  32.     3.1.2 Drivers
  33.     3.1.3 Restraints
  34.     3.1.4 Opportunities
  35.   3.2 MARKET FACTOR ANALYSIS
  36.     3.2.1 Value chain Analysis
  37.     3.2.2 Porter's Five Forces Analysis
  38.       3.2.2.1 Bargaining Power of Suppliers
  39.       3.2.2.2 Bargaining Power of Buyers
  40.       3.2.2.3 Threat of New Entrants
  41.       3.2.2.4 Threat of Substitutes
  42.       3.2.2.5 Intensity of Rivalry
  43.     3.2.3 COVID-19 Impact Analysis
  44.       3.2.3.1 Market Impact Analysis
  45.       3.2.3.2 Regional Impact
  46.       3.2.3.3 Opportunity and Threat Analysis
  47. 4 SECTION IV: QUANTITATIVE ANALYSIS
  48.   4.1 Information and Communications Technology, BY Offering (USD Million)
  49.     4.1.1 Hardware
  50.     4.1.2 Services
  51.     4.1.3 Software
  52.   4.2 Information and Communications Technology, BY IoT Communication Technology (USD Million)
  53.     4.2.1 Cellular
  54.     4.2.2 LPWAN
  55.     4.2.3 LoRaWAN
  56.     4.2.4 Z-Wave
  57.     4.2.5 Zigbee
  58.     4.2.6 NFC
  59.     4.2.7 Bluetooth
  60.     4.2.8 Others
  61.   4.3 Information and Communications Technology, BY Application (USD Million)
  62.     4.3.1 Autonomous Truck
  63.     4.3.2 Semi-autonomous Truck
  64.     4.3.3 Truck Platooning
  65.     4.3.4 Human-Machine Interface (HMI)
  66.     4.3.5 Predictive Maintenance
  67.     4.3.6 Precision & Mapping
  68.     4.3.7 Traffic Detection
  69.     4.3.8 Computer Vision-Powered Parking Management
  70.     4.3.9 Road Condition Monitoring
  71.     4.3.10 Automatic Traffic Incident Detection
  72.     4.3.11 Driver Monitoring
  73.     4.3.12 Others
  74.   4.4 Information and Communications Technology, BY Machine Learning Technology (USD Million)
  75.     4.4.1 Deep Learning
  76.     4.4.2 Computer Vision
  77.     4.4.3 Natural Language Processing
  78.     4.4.4 Context Awareness
  79. 5 SECTION V: COMPETITIVE ANALYSIS
  80.   5.1 Competitive Landscape
  81.     5.1.1 Overview
  82.     5.1.2 Competitive Analysis
  83.     5.1.3 Market share Analysis
  84.     5.1.4 Major Growth Strategy in the Information and Communications Technology
  85.     5.1.5 Competitive Benchmarking
  86.     5.1.6 Leading Players in Terms of Number of Developments in the Information and Communications Technology
  87.     5.1.7 Key developments and growth strategies
  88.       5.1.7.1 New Product Launch/Service Deployment
  89.       5.1.7.2 Merger & Acquisitions
  90.       5.1.7.3 Joint Ventures
  91.     5.1.8 Major Players Financial Matrix
  92.       5.1.8.1 Sales and Operating Income
  93.       5.1.8.2 Major Players R&D Expenditure. 2023
  94.   5.2 Company Profiles
  95.     5.2.1 Waymo (US)
  96.       5.2.1.1 Financial Overview
  97.       5.2.1.2 Products Offered
  98.       5.2.1.3 Key Developments
  99.       5.2.1.4 SWOT Analysis
  100.       5.2.1.5 Key Strategies
  101.     5.2.2 Tesla (US)
  102.       5.2.2.1 Financial Overview
  103.       5.2.2.2 Products Offered
  104.       5.2.2.3 Key Developments
  105.       5.2.2.4 SWOT Analysis
  106.       5.2.2.5 Key Strategies
  107.     5.2.3 Cruise (US)
  108.       5.2.3.1 Financial Overview
  109.       5.2.3.2 Products Offered
  110.       5.2.3.3 Key Developments
  111.       5.2.3.4 SWOT Analysis
  112.       5.2.3.5 Key Strategies
  113.     5.2.4 Aurora (US)
  114.       5.2.4.1 Financial Overview
  115.       5.2.4.2 Products Offered
  116.       5.2.4.3 Key Developments
  117.       5.2.4.4 SWOT Analysis
  118.       5.2.4.5 Key Strategies
  119.     5.2.5 Mobileye (IL)
  120.       5.2.5.1 Financial Overview
  121.       5.2.5.2 Products Offered
  122.       5.2.5.3 Key Developments
  123.       5.2.5.4 SWOT Analysis
  124.       5.2.5.5 Key Strategies
  125.     5.2.6 Baidu (CN)
  126.       5.2.6.1 Financial Overview
  127.       5.2.6.2 Products Offered
  128.       5.2.6.3 Key Developments
  129.       5.2.6.4 SWOT Analysis
  130.       5.2.6.5 Key Strategies
  131.     5.2.7 Nuro (US)
  132.       5.2.7.1 Financial Overview
  133.       5.2.7.2 Products Offered
  134.       5.2.7.3 Key Developments
  135.       5.2.7.4 SWOT Analysis
  136.       5.2.7.5 Key Strategies
  137.     5.2.8 Zoox (US)
  138.       5.2.8.1 Financial Overview
  139.       5.2.8.2 Products Offered
  140.       5.2.8.3 Key Developments
  141.       5.2.8.4 SWOT Analysis
  142.       5.2.8.5 Key Strategies
  143.     5.2.9 Pony.ai (CN)
  144.       5.2.9.1 Financial Overview
  145.       5.2.9.2 Products Offered
  146.       5.2.9.3 Key Developments
  147.       5.2.9.4 SWOT Analysis
  148.       5.2.9.5 Key Strategies
  149.   5.3 Appendix
  150.     5.3.1 References
  151.     5.3.2 Related Reports
  152. 6 LIST OF FIGURES
  153.   6.1 MARKET SYNOPSIS
  154.   6.2 GCC MARKET ANALYSIS BY OFFERING
  155.   6.3 GCC MARKET ANALYSIS BY IOT COMMUNICATION TECHNOLOGY
  156.   6.4 GCC MARKET ANALYSIS BY APPLICATION
  157.   6.5 GCC MARKET ANALYSIS BY MACHINE LEARNING TECHNOLOGY
  158.   6.6 KEY BUYING CRITERIA OF INFORMATION AND COMMUNICATIONS TECHNOLOGY
  159.   6.7 RESEARCH PROCESS OF MRFR
  160.   6.8 DRO ANALYSIS OF INFORMATION AND COMMUNICATIONS TECHNOLOGY
  161.   6.9 DRIVERS IMPACT ANALYSIS: INFORMATION AND COMMUNICATIONS TECHNOLOGY
  162.   6.10 RESTRAINTS IMPACT ANALYSIS: INFORMATION AND COMMUNICATIONS TECHNOLOGY
  163.   6.11 SUPPLY / VALUE CHAIN: INFORMATION AND COMMUNICATIONS TECHNOLOGY
  164.   6.12 INFORMATION AND COMMUNICATIONS TECHNOLOGY, BY OFFERING, 2024 (% SHARE)
  165.   6.13 INFORMATION AND COMMUNICATIONS TECHNOLOGY, BY OFFERING, 2024 TO 2035 (USD Million)
  166.   6.14 INFORMATION AND COMMUNICATIONS TECHNOLOGY, BY IOT COMMUNICATION TECHNOLOGY, 2024 (% SHARE)
  167.   6.15 INFORMATION AND COMMUNICATIONS TECHNOLOGY, BY IOT COMMUNICATION TECHNOLOGY, 2024 TO 2035 (USD Million)
  168.   6.16 INFORMATION AND COMMUNICATIONS TECHNOLOGY, BY APPLICATION, 2024 (% SHARE)
  169.   6.17 INFORMATION AND COMMUNICATIONS TECHNOLOGY, BY APPLICATION, 2024 TO 2035 (USD Million)
  170.   6.18 INFORMATION AND COMMUNICATIONS TECHNOLOGY, BY MACHINE LEARNING TECHNOLOGY, 2024 (% SHARE)
  171.   6.19 INFORMATION AND COMMUNICATIONS TECHNOLOGY, BY MACHINE LEARNING TECHNOLOGY, 2024 TO 2035 (USD Million)
  172.   6.20 BENCHMARKING OF MAJOR COMPETITORS
  173. 7 LIST OF TABLES
  174.   7.1 LIST OF ASSUMPTIONS
  175.     7.1.1
  176.   7.2 GCC MARKET SIZE ESTIMATES; FORECAST
  177.     7.2.1 BY OFFERING, 2025-2035 (USD Million)
  178.     7.2.2 BY IOT COMMUNICATION TECHNOLOGY, 2025-2035 (USD Million)
  179.     7.2.3 BY APPLICATION, 2025-2035 (USD Million)
  180.     7.2.4 BY MACHINE LEARNING TECHNOLOGY, 2025-2035 (USD Million)
  181.   7.3 PRODUCT LAUNCH/PRODUCT DEVELOPMENT/APPROVAL
  182.     7.3.1
  183.   7.4 ACQUISITION/PARTNERSHIP
  184.     7.4.1

GCC Information and Communications Technology Market Segmentation

Information and Communications Technology By Offering (USD Million, 2025-2035)

  • Hardware
  • Services
  • Software

Information and Communications Technology By IoT Communication Technology (USD Million, 2025-2035)

  • Cellular
  • LPWAN
  • LoRaWAN
  • Z-Wave
  • Zigbee
  • NFC
  • Bluetooth
  • Others

Information and Communications Technology By Application (USD Million, 2025-2035)

  • Autonomous Truck
  • Semi-autonomous Truck
  • Truck Platooning
  • Human-Machine Interface (HMI)
  • Predictive Maintenance
  • Precision & Mapping
  • Traffic Detection
  • Computer Vision-Powered Parking Management
  • Road Condition Monitoring
  • Automatic Traffic Incident Detection
  • Driver Monitoring
  • Others

Information and Communications Technology By Machine Learning Technology (USD Million, 2025-2035)

  • Deep Learning
  • Computer Vision
  • Natural Language Processing
  • Context Awareness

Compare Licence

×
Features License Type
Single User Multiuser License Enterprise User
Price $4,950 $5,950 $7,250
Maximum User Access Limit 1 User Upto 10 Users Unrestricted Access Throughout the Organization
Free Customization
Direct Access to Analyst
Deliverable Format
Platform Access
Discount on Next Purchase 10% 15% 15%
Printable Versions