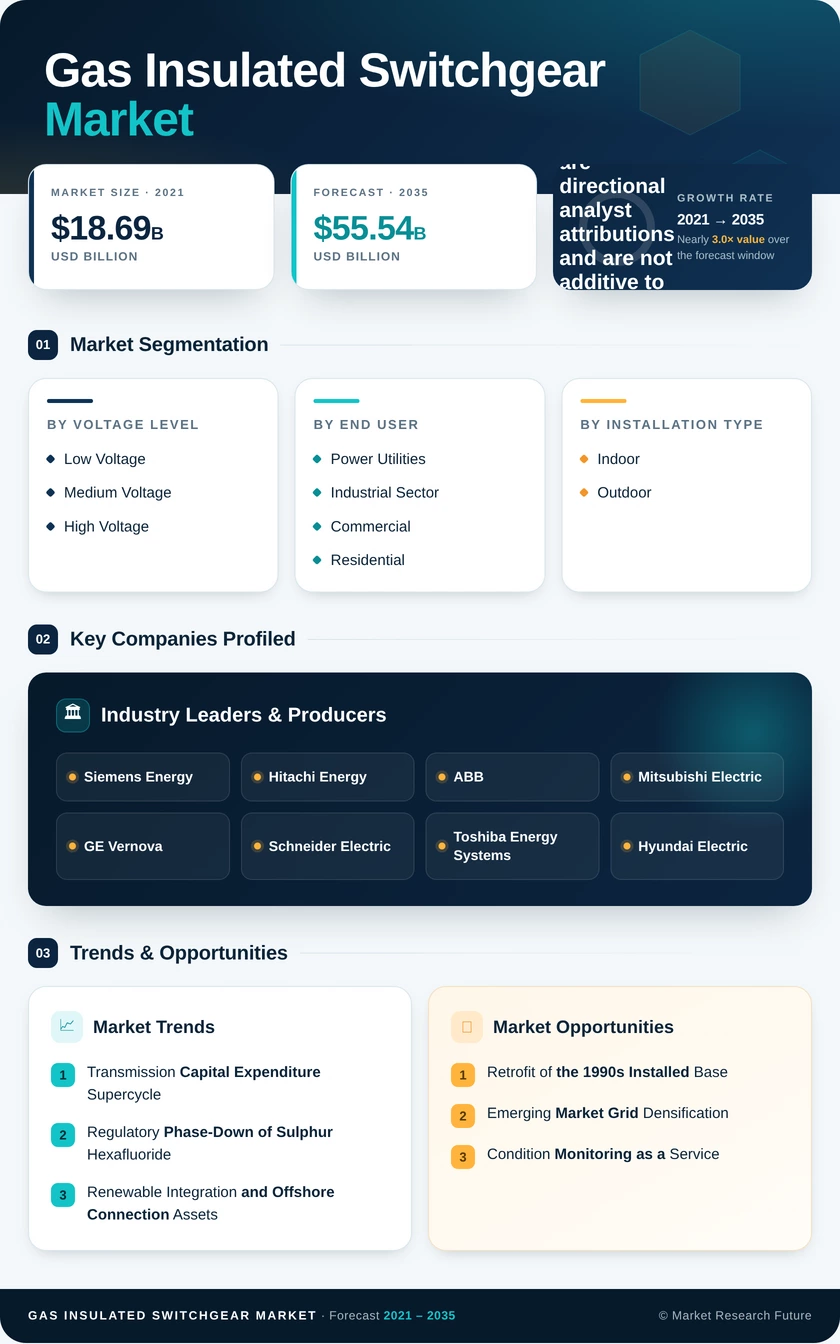
Gas Insulated Switchgear Market (2026 - 2035)

ID: MRFR/EnP/0602-CR 111 Pages Chitranshi Jaiswal Last Updated: October 31, 2026
Gas Insulated Switchgear Market Research Report By Voltage Level (Low Voltage, Medium Voltage, High Voltage), By End User (Power Utilities, Industrial Sector, Commercial and Residential), By Installation Type (Indoor, Outdoor) - Forecast to 2035
Gas Insulated Switchgear Market
Market Size
Forecast Period2026-2035
CAGR (2026-2035)8.6%
2025 Market SizeUSD 24.35 Billion
2035 Market SizeUSD 55.54 Billion
Key Players
Siemens Energy
Hitachi Energy
ABB
Mitsubishi Electric
GE Vernova
Schneider Electric
Opportunities
  • Retrofit of the 1990s Installed Base
  • Emerging Market Grid Densification
  • Condition Monitoring as a Service
  1. 1 Market Overview | |
    1. 1.1 Study Assumptions & Market Definition | |
    2. 1.2 Scope of the Study | |
    3. 1.3 Research Methodology | |
  2. 2 Market Summary & Key Takeaways | |
    1. 2.1 Key Takeaways by Voltage Level | |
    2. 2.2 Key Takeaways by End User | |
    3. 2.3 Key Takeaways by Geography | |
  3. 3 Global Market Size & Forecast (2021–2035) | |
    1. 3.1 Historical Market Size (2021–2024) | |
    2. 3.2 Base Year Assessment (2025) | |
    3. 3.3 Forecast Market Size (2026–2035) | |
    4. 3.4 Year-over-Year Growth Analysis | |
  4. 4 Market Drivers Analysis | |
    1. 4.1 Transmission Capital Expenditure Supercycle | |
    2. 4.2 Regulatory Phase-Down of Sulphur Hexafluoride | |
    3. 4.3 Renewable Integration and Offshore Connection Assets | |
    4. 4.4 Data Centre and Industrial Load Growth | |
    5. 4.5 Driver Impact Matrix | |
  5. 5 Market Restraints Analysis | |
    1. 5.1 The Capital Cost Premium | |
    2. 5.2 Supply Chain and Lead Time Pressure | |
    3. 5.3 Skills and Commissioning Complexity | |
    4. 5.4 Restraint Impact Matrix | |
  6. 6 Market Opportunity Analysis | |
    1. 6.1 Retrofit of the 1990s Installed Base | |
    2. 6.2 Emerging Market Grid Densification | |
    3. 6.3 Condition Monitoring as a Service | |
    4. 6.4 Hybrid Configurations for Brownfield Sites | |
    5. 6.5 Offshore and Floating Wind Platforms | |
    6. 6.6 Industry Value Chain Analysis | |
    7. 6.7 Porter's Five Forces Analysis | |
  7. 7 Regional Analysis | |
    1. 7.1 North America | | |
      1. 7.1.1 US | | |
      2. 7.1.2 Canada | | |
      3. 7.1.3 Mexico | |
    2. 7.2 Europe | | |
      1. 7.2.1 Germany | | |
      2. 7.2.2 UK | | |
      3. 7.2.3 France | | |
      4. 7.2.4 Italy | | |
      5. 7.2.5 Spain | | |
      6. 7.2.6 Nordic Countries | | |
      7. 7.2.7 Russia | | |
      8. 7.2.8 Rest of Europe | |
    3. 7.3 Asia-Pacific | | |
      1. 7.3.1 China | | |
      2. 7.3.2 India | | |
      3. 7.3.3 Japan | | |
      4. 7.3.4 South Korea | | |
      5. 7.3.5 ASEAN | | |
      6. 7.3.6 Rest of Asia-Pacific | |
    4. 7.4 South America | | |
      1. 7.4.1 Brazil | | |
      2. 7.4.2 Argentina | | |
      3. 7.4.3 Rest of South America | |
    5. 7.5 Middle East & Africa | | |
      1. 7.5.1 Saudi Arabia | | |
      2. 7.5.2 UAE | | |
      3. 7.5.3 South Africa | | |
      4. 7.5.4 Egypt | | |
      5. 7.5.5 Rest of Middle East & Africa | |
  8. 8 Future Outlook (2026–2035) | |
    1. 8.1 Autonomous and Predictive Substation Operations | |
    2. 8.2 The Electrification Supercycle | |
    3. 8.3 Interoperability and Protocol Convergence | |
    4. 8.4 Sustainability Disclosure and Lifecycle Scoring | |
  9. 9 Segmentation Analysis | |
    1. 9.1 By Voltage Level | | |
      1. 9.1.1 Low Voltage | | |
      2. 9.1.2 Medium Voltage | | |
      3. 9.1.3 High Voltage | |
    2. 9.2 By End User | | |
      1. 9.2.1 Power Utilities | | |
      2. 9.2.2 Industrial Sector | | |
      3. 9.2.3 Commercial and Residential | |
    3. 9.3 By Installation Type | | |
      1. 9.3.1 Indoor | | |
      2. 9.3.2 Outdoor | |
  10. 10 Competitive Landscape | |
    1. 10.1 Market Concentration Analysis (2026) | |
    2. 10.2 Competitive Benchmarking Matrix | |
    3. 10.3 Company Profiles | | |
      1. 10.3.1 Siemens Energy | | |
      2. 10.3.2 Hitachi Energy | | |
      3. 10.3.3 ABB | | |
      4. 10.3.4 Mitsubishi Electric | | |
      5. 10.3.5 GE Vernova | | |
      6. 10.3.6 Schneider Electric | | |
      7. 10.3.7 Toshiba Energy Systems & Solutions | | |
      8. 10.3.8 Hyundai Electric & Energy Systems | | |
      9. 10.3.9 Fuji Electric | | |
      10. 10.3.10 Meidensha Corporation | | |
      11. 10.3.11 CG Power and Industrial Solutions | | |
      12. 10.3.12 TBEA / Chint Electric | |
  11. 11 Recent Developments & News (2023–2025) | |
  12. 12 Report Scope & Methodology | |
    1. 12.1 Study Period & Base Year | |
    2. 12.2 Valuation Currency & Conventions | |
    3. 12.3 Abbreviations | |
  13. 13 Detailed Sources & Citations | |
  14. 14 Frequently Asked Questions | | LIST OF TABLES | |
  15. TABLE 1 Global Gas Insulated Switchgear Market Size & Forecast, by Revenue (USD Billion), 2021–2035 | |
  16. TABLE 2 Global Gas Insulated Switchgear Market — Year-over-Year Growth Analysis, 2021–2035 | |
  17. TABLE 3 Driver Impact Analysis Matrix, 2026–2035 | |
  18. TABLE 4 Restraint Impact Analysis Matrix, 2026–2035 | |
  19. TABLE 5 Global Market Size, by Voltage Level, 2021–2035 (USD Billion) | |
  20. TABLE 6 Global Market Size, by End User, 2021–2035 (USD Billion) | |
  21. TABLE 7 Global Market Size, by Installation Type, 2021–2035 (USD Billion) | |
  22. TABLE 8 Global Market Size, by Region, 2021–2035 (USD Billion) | |
  23. TABLE 9 North America Market Size, by Country, 2021–2035 (USD Billion) | |
  24. TABLE 10 Europe Market Size, by Country, 2021–2035 (USD Billion) | |
  25. TABLE 11 Asia-Pacific Market Size, by Country, 2021–2035 (USD Billion) | |
  26. TABLE 12 South America Market Size, by Country, 2021–2035 (USD Billion) | |
  27. TABLE 13 Middle East & Africa Market Size, by Country, 2021–2035 (USD Billion) | |
  28. TABLE 14 North America Market Size, by Voltage Level, 2021–2035 (USD Billion) | |
  29. TABLE 15 North America Market Size, by End User, 2021–2035 (USD Billion) | |
  30. TABLE 16 Europe Market Size, by Voltage Level, 2021–2035 (USD Billion) | |
  31. TABLE 17 Europe Market Size, by End User, 2021–2035 (USD Billion) | |
  32. TABLE 18 Asia-Pacific Market Size, by Voltage Level, 2021–2035 (USD Billion) | |
  33. TABLE 19 Asia-Pacific Market Size, by End User, 2021–2035 (USD Billion) | |
  34. TABLE 20 South America Market Size, by Voltage Level, 2021–2035 (USD Billion) | |
  35. TABLE 21 Middle East & Africa Market Size, by Voltage Level, 2021–2035 (USD Billion) | |
  36. TABLE 22 Competitive Benchmarking Matrix, 2026 | |
  37. TABLE 23 Company Profiles — Key Players | |
  38. TABLE 24 Recent Developments & Strategic Announcements, 2023–2025 | |
  39. TABLE 25 Report Scope & Methodology Summary | |
  40. TABLE 26 Detailed Sources & Citations Index | | LIST OF FIGURES | |
  41. FIGURE 1 Market Dynamics Overview — Drivers, Restraints and Opportunities | |
  42. FIGURE 2 Industry Value Chain Analysis | |
  43. FIGURE 3 Porter's Five Forces Assessment | |
  44. FIGURE 4 Global Market Size Trend, 2021–2035 (USD Billion) | |
  45. FIGURE 5 Year-over-Year Growth Curve, 2022–2035 | |
  46. FIGURE 6 Market Share by Voltage Level, 2025 vs 2035 | |
  47. FIGURE 7 Market Share by End User, 2025 vs 2035 | |
  48. FIGURE 8 Market Share by Installation Type, 2025 | |
  49. FIGURE 9 Regional Share Distribution, 2025 | |
  50. FIGURE 10 Regional CAGR Comparison, 2026–2035 | |
  51. FIGURE 11 Country-Level Contribution within Asia-Pacific, 2025 | |
  52. FIGURE 12 Competitive Landscape — Estimated Revenue Share Bands, 2026 | |
  53. FIGURE 13 Strategic Positioning Map — Portfolio Breadth vs Service Footprint | |
  54. FIGURE 14 SF6-Alternative Product Qualification Timeline, 2023–2032

Segmentation Quick Reference

DimensionSub-SegmentsDominant SegmentFastest Growing Segment
By Voltage LevelLow Voltage; Medium Voltage; High VoltageHigh VoltageMedium Voltage
By End UserPower Utilities; Industrial Sector; Commercial and ResidentialPower UtilitiesCommercial and Residential
By Installation TypeIndoor; OutdoorOutdoorIndoor
By GeographyNorth America; Europe; Asia-Pacific; South America; Middle East & AfricaAsia-PacificAsia-Pacific


Market Segmentation Overview

By Voltage Level

Sub-SegmentKey Trend
Low VoltageGrowth tied to packaged industrial skids and building distribution rooms
Medium VoltageFirst segment affected by fluorinated-gas deadlines; fastest unit turnover
High VoltageLargest revenue pool; driven by interconnection and offshore assets


Voltage class determines almost everything downstream — enclosure design, testing regime, buyer identity, and price per bay. High-voltage equipment dominates revenue while medium-voltage assemblies dominate unit volume, and the two segments respond to different signals: transmission planning cycles on one side, distribution regulation on the other.

By End User

Sub-SegmentKey Trend
Power UtilitiesFramework agreements running five to seven years; specification-setting buyers
Industrial SectorMining, petrochemical and semiconductor loads favouring sealed plant
Commercial and ResidentialData centres and mixed-use developments paying premiums for schedule certainty


Utility buyers still write the technical standards that everyone else adopts, but purchasing power is shifting. Hyperscale data centre developers and industrial campus owners now approach manufacturers directly, reserving production slots ahead of tender close and changing how order books are built.

By Installation Type

Sub-SegmentKey Trend
IndoorUrban substations, basements and offshore platforms; strongest growth trajectory
OutdoorUtility switchyards and generation step-up; larger installed base


Installation environment shapes enclosure rating, corrosion protection, and service access design. Indoor deployment accelerates wherever planning authorities resist visible infrastructure or land economics make above-ground yards untenable, while outdoor arrangements retain the volume base across interior grids with abundant space.

By Geography

Sub-SegmentKey Trend
North AmericaInterconnection queue backlog and wildfire hardening programmes
EuropeFluorinated-gas substitution deadlines and offshore wind connection assets
Asia-PacificUltra-high-voltage corridors and dense urban substation build-out
South AmericaTransmission auction pipeline and mining load expansion
Middle East & AfricaGiga-project networks and regional interconnection


Geographic demand splits cleanly along two axes: land economics and regulatory pressure. Asia-Pacific leads on the first, Europe on the second, and the Middle East combines a young installed base with construction volume that few regions can match through the forecast decade.




Download PDF ×

We do not share your information with anyone. However, we may send you emails based on your report interest from time to time. You may contact us at any time to opt-out.