France France Continuous Renal Replacement Therapy Market Segmentation
France Continuous Renal Replacement Therapy Market By Product Type (USD Million, 2025-2035)
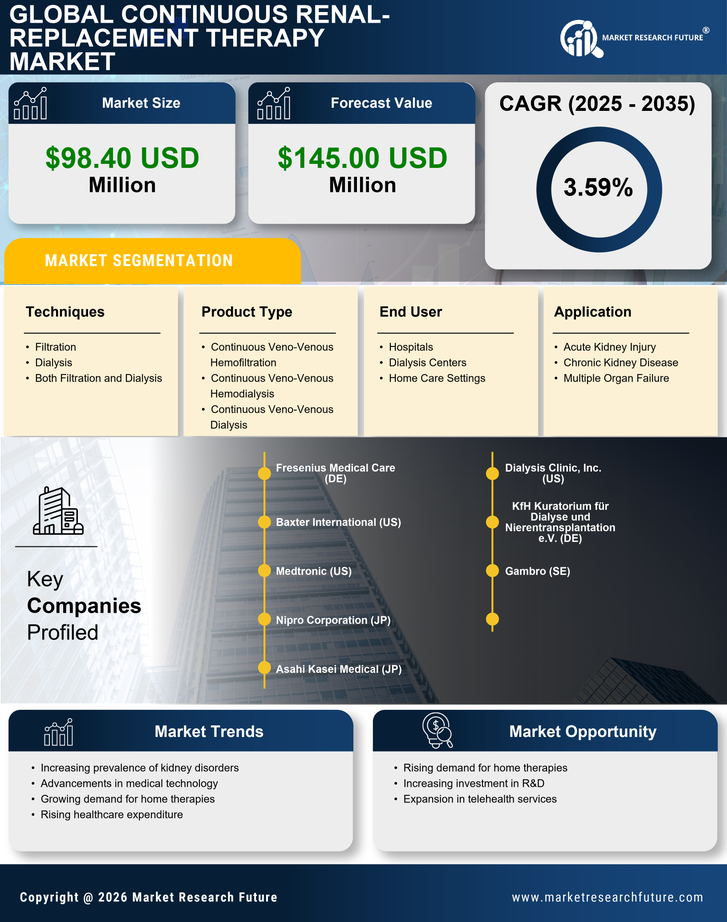
- Continuous Veno-Venous Hemofiltration
- Continuous Veno-Venous Hemodialysis
- Continuous Veno-Venous Dialysis
France Continuous Renal Replacement Therapy Market By End User (USD Million, 2025-2035)
- Hospitals
- Dialysis Centers
- Home Care Settings
France Continuous Renal Replacement Therapy Market By Techniques (USD Million, 2025-2035)
- Filtration
- Dialysis
- Both Filtration and Dialysis
France Continuous Renal Replacement Therapy Market By Application (USD Million, 2025-2035)
- Acute Kidney Injury
- Chronic Kidney Disease
- Multiple Organ Failure