Request Free Sample ×

Kindly complete the form below to receive a free sample of this Report

* Please use a valid business email

Leading companies partner with us for data-driven Insights

clients tt-cursor
Hero Background

France Auto Parts Market

ID: MRFR/AT/45406-HCR
128 Pages
Shubham Munde
Last Updated: April 06, 2026

France Auto Parts Market Research Report By End-User (OEM, Aftermarket) and By Distribution Channel (Offline, Online) - Growth & Industry Forecast 2025 To 2035

Share:
Download PDF ×

We do not share your information with anyone. However, we may send you emails based on your report interest from time to time. You may contact us at any time to opt-out.

France Auto Parts Market Infographic
Purchase Options
  1. 1 SECTION I: EXECUTIVE SUMMARY AND KEY HIGHLIGHTS
  2.   1.1 EXECUTIVE SUMMARY
  3.     1.1.1 Market Overview
  4.     1.1.2 Key Findings
  5.     1.1.3 Market Segmentation
  6.     1.1.4 Competitive Landscape
  7.     1.1.5 Challenges and Opportunities
  8.     1.1.6 Future Outlook
  9. 2 SECTION II: SCOPING, METHODOLOGY AND MARKET STRUCTURE
  10.   2.1 MARKET INTRODUCTION
  11.     2.1.1 Definition
  12.     2.1.2 Scope of the study
  13.       2.1.2.1 Research Objective
  14.       2.1.2.2 Assumption
  15.       2.1.2.3 Limitations
  16.   2.2 RESEARCH METHODOLOGY
  17.     2.2.1 Overview
  18.     2.2.2 Data Mining
  19.     2.2.3 Secondary Research
  20.     2.2.4 Primary Research
  21.       2.2.4.1 Primary Interviews and Information Gathering Process
  22.       2.2.4.2 Breakdown of Primary Respondents
  23.     2.2.5 Forecasting Model
  24.     2.2.6 Market Size Estimation
  25.       2.2.6.1 Bottom-Up Approach
  26.       2.2.6.2 Top-Down Approach
  27.     2.2.7 Data Triangulation
  28.     2.2.8 Validation
  29. 3 SECTION III: QUALITATIVE ANALYSIS
  30.   3.1 MARKET DYNAMICS
  31.     3.1.1 Overview
  32.     3.1.2 Drivers
  33.     3.1.3 Restraints
  34.     3.1.4 Opportunities
  35.   3.2 MARKET FACTOR ANALYSIS
  36.     3.2.1 Value chain Analysis
  37.     3.2.2 Porter's Five Forces Analysis
  38.       3.2.2.1 Bargaining Power of Suppliers
  39.       3.2.2.2 Bargaining Power of Buyers
  40.       3.2.2.3 Threat of New Entrants
  41.       3.2.2.4 Threat of Substitutes
  42.       3.2.2.5 Intensity of Rivalry
  43.     3.2.3 COVID-19 Impact Analysis
  44.       3.2.3.1 Market Impact Analysis
  45.       3.2.3.2 Regional Impact
  46.       3.2.3.3 Opportunity and Threat Analysis
  47. 4 SECTION IV: QUANTITATIVE ANALYSIS
  48.   4.1 Automobile, BY Type (USD Billion)
  49.     4.1.1 Engine Components
  50.     4.1.2 Transmission Components
  51.     4.1.3 Electrical Parts
  52.     4.1.4 Braking Systems
  53.     4.1.5 Body Parts
  54.   4.2 Automobile, BY Sales Channel (USD Billion)
  55.     4.2.1 Original Equipment Manufacturer
  56.     4.2.2 Aftermarket
  57.     4.2.3 Retail
  58.     4.2.4 Wholesale
  59.   4.3 Automobile, BY Material (USD Billion)
  60.     4.3.1 Metal
  61.     4.3.2 Plastic
  62.     4.3.3 Rubber
  63.     4.3.4 Composites
  64.     4.3.5 Glass
  65.   4.4 Automobile, BY Vehicle Type (USD Billion)
  66.     4.4.1 Passenger Cars
  67.     4.4.2 Commercial Vehicles
  68.     4.4.3 Two Wheelers
  69.     4.4.4 Electric Vehicles
  70. 5 SECTION V: COMPETITIVE ANALYSIS
  71.   5.1 Competitive Landscape
  72.     5.1.1 Overview
  73.     5.1.2 Competitive Analysis
  74.     5.1.3 Market share Analysis
  75.     5.1.4 Major Growth Strategy in the Automobile
  76.     5.1.5 Competitive Benchmarking
  77.     5.1.6 Leading Players in Terms of Number of Developments in the Automobile
  78.     5.1.7 Key developments and growth strategies
  79.       5.1.7.1 New Product Launch/Service Deployment
  80.       5.1.7.2 Merger & Acquisitions
  81.       5.1.7.3 Joint Ventures
  82.     5.1.8 Major Players Financial Matrix
  83.       5.1.8.1 Sales and Operating Income
  84.       5.1.8.2 Major Players R&D Expenditure. 2023
  85.   5.2 Company Profiles
  86.     5.2.1 Robert Bosch GmbH (DE)
  87.       5.2.1.1 Financial Overview
  88.       5.2.1.2 Products Offered
  89.       5.2.1.3 Key Developments
  90.       5.2.1.4 SWOT Analysis
  91.       5.2.1.5 Key Strategies
  92.     5.2.2 Denso Corporation (JP)
  93.       5.2.2.1 Financial Overview
  94.       5.2.2.2 Products Offered
  95.       5.2.2.3 Key Developments
  96.       5.2.2.4 SWOT Analysis
  97.       5.2.2.5 Key Strategies
  98.     5.2.3 Magna International Inc. (CA)
  99.       5.2.3.1 Financial Overview
  100.       5.2.3.2 Products Offered
  101.       5.2.3.3 Key Developments
  102.       5.2.3.4 SWOT Analysis
  103.       5.2.3.5 Key Strategies
  104.     5.2.4 Continental AG (DE)
  105.       5.2.4.1 Financial Overview
  106.       5.2.4.2 Products Offered
  107.       5.2.4.3 Key Developments
  108.       5.2.4.4 SWOT Analysis
  109.       5.2.4.5 Key Strategies
  110.     5.2.5 Aisin Seiki Co., Ltd. (JP)
  111.       5.2.5.1 Financial Overview
  112.       5.2.5.2 Products Offered
  113.       5.2.5.3 Key Developments
  114.       5.2.5.4 SWOT Analysis
  115.       5.2.5.5 Key Strategies
  116.     5.2.6 ZF Friedrichshafen AG (DE)
  117.       5.2.6.1 Financial Overview
  118.       5.2.6.2 Products Offered
  119.       5.2.6.3 Key Developments
  120.       5.2.6.4 SWOT Analysis
  121.       5.2.6.5 Key Strategies
  122.     5.2.7 Valeo SA (FR)
  123.       5.2.7.1 Financial Overview
  124.       5.2.7.2 Products Offered
  125.       5.2.7.3 Key Developments
  126.       5.2.7.4 SWOT Analysis
  127.       5.2.7.5 Key Strategies
  128.     5.2.8 Lear Corporation (US)
  129.       5.2.8.1 Financial Overview
  130.       5.2.8.2 Products Offered
  131.       5.2.8.3 Key Developments
  132.       5.2.8.4 SWOT Analysis
  133.       5.2.8.5 Key Strategies
  134.     5.2.9 Tenneco Inc. (US)
  135.       5.2.9.1 Financial Overview
  136.       5.2.9.2 Products Offered
  137.       5.2.9.3 Key Developments
  138.       5.2.9.4 SWOT Analysis
  139.       5.2.9.5 Key Strategies
  140.     5.2.10 BorgWarner Inc. (US)
  141.       5.2.10.1 Financial Overview
  142.       5.2.10.2 Products Offered
  143.       5.2.10.3 Key Developments
  144.       5.2.10.4 SWOT Analysis
  145.       5.2.10.5 Key Strategies
  146.   5.3 Appendix
  147.     5.3.1 References
  148.     5.3.2 Related Reports
  149. 6 LIST OF FIGURES
  150.   6.1 MARKET SYNOPSIS
  151.   6.2 FRANCE MARKET ANALYSIS BY TYPE
  152.   6.3 FRANCE MARKET ANALYSIS BY SALES CHANNEL
  153.   6.4 FRANCE MARKET ANALYSIS BY MATERIAL
  154.   6.5 FRANCE MARKET ANALYSIS BY VEHICLE TYPE
  155.   6.6 KEY BUYING CRITERIA OF AUTOMOBILE
  156.   6.7 RESEARCH PROCESS OF MRFR
  157.   6.8 DRO ANALYSIS OF AUTOMOBILE
  158.   6.9 DRIVERS IMPACT ANALYSIS: AUTOMOBILE
  159.   6.10 RESTRAINTS IMPACT ANALYSIS: AUTOMOBILE
  160.   6.11 SUPPLY / VALUE CHAIN: AUTOMOBILE
  161.   6.12 AUTOMOBILE, BY TYPE, 2024 (% SHARE)
  162.   6.13 AUTOMOBILE, BY TYPE, 2024 TO 2035 (USD Billion)
  163.   6.14 AUTOMOBILE, BY SALES CHANNEL, 2024 (% SHARE)
  164.   6.15 AUTOMOBILE, BY SALES CHANNEL, 2024 TO 2035 (USD Billion)
  165.   6.16 AUTOMOBILE, BY MATERIAL, 2024 (% SHARE)
  166.   6.17 AUTOMOBILE, BY MATERIAL, 2024 TO 2035 (USD Billion)
  167.   6.18 AUTOMOBILE, BY VEHICLE TYPE, 2024 (% SHARE)
  168.   6.19 AUTOMOBILE, BY VEHICLE TYPE, 2024 TO 2035 (USD Billion)
  169.   6.20 BENCHMARKING OF MAJOR COMPETITORS
  170. 7 LIST OF TABLES
  171.   7.1 LIST OF ASSUMPTIONS
  172.     7.1.1
  173.   7.2 France MARKET SIZE ESTIMATES; FORECAST
  174.     7.2.1 BY TYPE, 2025-2035 (USD Billion)
  175.     7.2.2 BY SALES CHANNEL, 2025-2035 (USD Billion)
  176.     7.2.3 BY MATERIAL, 2025-2035 (USD Billion)
  177.     7.2.4 BY VEHICLE TYPE, 2025-2035 (USD Billion)
  178.   7.3 PRODUCT LAUNCH/PRODUCT DEVELOPMENT/APPROVAL
  179.     7.3.1
  180.   7.4 ACQUISITION/PARTNERSHIP
  181.     7.4.1

France Automobile Market Segmentation

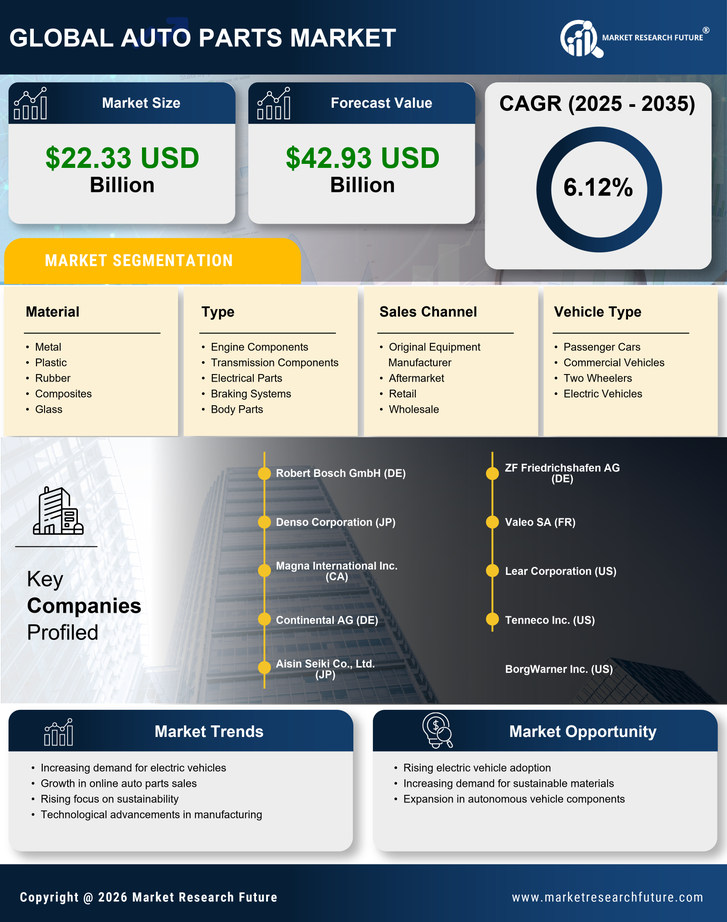
Automobile By Type (USD Billion, 2025-2035)

  • Engine Components
  • Transmission Components
  • Electrical Parts
  • Braking Systems
  • Body Parts

Automobile By Sales Channel (USD Billion, 2025-2035)

  • Original Equipment Manufacturer
  • Aftermarket
  • Retail
  • Wholesale

Automobile By Material (USD Billion, 2025-2035)

  • Metal
  • Plastic
  • Rubber
  • Composites
  • Glass

Automobile By Vehicle Type (USD Billion, 2025-2035)

  • Passenger Cars
  • Commercial Vehicles
  • Two Wheelers
  • Electric Vehicles

Compare Licence

×
Features License Type
Single User Multiuser License Enterprise User
Price $4,950 $5,950 $7,250
Maximum User Access Limit 1 User Upto 10 Users Unrestricted Access Throughout the Organization
Free Customization
Direct Access to Analyst
Deliverable Format
Platform Access
Discount on Next Purchase 10% 15% 15%
Printable Versions