• Cat-intel
  • MedIntelliX
  • Resources
  • About Us
  • Hero Background
    English
    Chinese
    French
    Japanese
    Korean
    German
    Spanish

    Fracking Chemicals Market Share

    ID: MRFR/CnM/4613-HCR
    100 Pages
    Chitranshi Jaiswal
    October 2025

    Global Fracking Chemicals Market Research Report  By Type (Gelling Agent, Friction Reducer, Corrosion Inhibitor, Biocide, Surfactant, Scale Inhibitor, Clay Stabilizer, Cross-Linkers, Ph Adjusting Agent, Iron Control Agent, and Others), Fluid Type (Water-Based, Oil-Based, and Foam-Based), And Region (Asia-Pacific, North America, Europe, Latin America, and the Middle East and Africa)—Forecas...

    Share:
    Download PDF ×

    We do not share your information with anyone. However, we may send you emails based on your report interest from time to time. You may contact us at any time to opt-out.

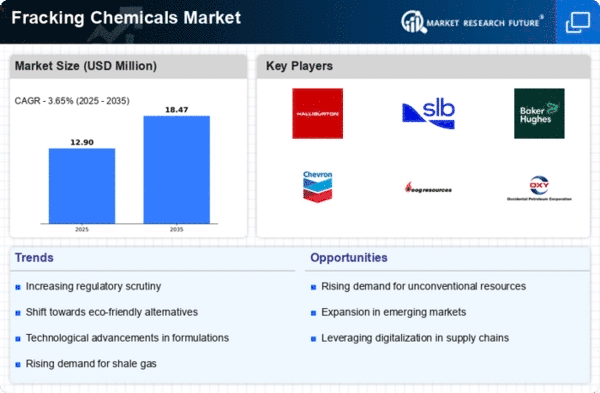
    Fracking Chemicals Market Infographic
    $ 4,950.0
    $ 5,950.0
    $ 7,250.0

    Market Share

    Fracking Chemicals Market Share Analysis

    The Fracking Chemicals Market, a critical segment within the oil and gas industry, employs various market share positioning strategies to gain a competitive edge. One primary approach is differentiation, where companies focus on developing unique and innovative fracking chemicals. This involves investing in research and development to create formulations that enhance extraction efficiency, reduce environmental impact, or comply with stringent regulations. By offering differentiated products, companies can carve out a niche for themselves and attract customers seeking advanced solutions.

    Another key strategy is cost leadership. Some players in the fracking chemicals market aim to capture a significant market share by optimizing production processes and achieving economies of scale. This allows them to offer products at lower prices without compromising quality. Cost-effective solutions become especially appealing to price-sensitive customers, enabling companies to broaden their customer base and establish a strong market presence.

    Collaboration and strategic partnerships constitute yet another vital market positioning strategy. Companies in the fracking chemicals industry often collaborate with oil and gas producers, equipment manufacturers, and other stakeholders to create integrated solutions. By aligning their products with the broader value chain, these companies enhance their market visibility and strengthen relationships with key industry players. This collaborative approach can lead to exclusive contracts and long-term partnerships, securing a stable market share.

    Geographical positioning is a crucial aspect of market share strategies in the fracking chemicals sector. The global nature of the industry demands a strategic presence in key regions with high fracking activities. Companies strategically locate their manufacturing facilities, distribution centers, and research hubs to optimize logistics and respond promptly to market demands. By aligning their operations with the geographical dynamics of the industry, companies can ensure a more efficient supply chain, better customer service, and a competitive advantage in local markets.

    Innovation and sustainability are increasingly becoming pivotal factors in market share positioning. As environmental concerns grow, companies in the fracking chemicals market are adopting sustainable practices and developing eco-friendly formulations. Those at the forefront of innovation, creating chemicals that minimize environmental impact or improve overall sustainability, can attract environmentally conscious customers and gain a favorable market position. Sustainability is not only a moral imperative but also a strategic advantage in the evolving landscape of the fracking industry.

    Furthermore, a customer-centric approach is paramount for sustained market share growth. Understanding the unique needs and challenges faced by customers allows companies to tailor their products and services accordingly. Offering customized solutions, responsive customer support, and value-added services contribute to customer loyalty and retention. Satisfied customers become advocates, promoting the company's products and enhancing its reputation in the market.

    Market Summary

    As per Market Research Future Analysis, the fracking chemicals market is projected to grow at a CAGR of 6.54% from 2024 to 2032. Fracking chemicals, essential for enhancing hydrocarbon extraction efficiency, vary in composition based on local regulations and water availability. They facilitate the extraction of oil and natural gas from low permeability reservoirs through hydraulic fracturing. The market is driven by rising global oil and gas demand, the shift towards horizontal drilling, and the development of unconventional oil and gas sources. However, concerns over the toxicity of some fracking chemicals may hinder growth. Companies are investing in R&D for eco-friendly alternatives, such as bio-based drill muds and non-toxic drilling fluids, which present growth opportunities.

    Key Market Trends & Highlights

    The fracking chemicals market is witnessing significant trends driven by technological advancements and regulatory changes.

    • Market growth driven by rising global oil & gas demand due to population expansion.
    • North America held the largest market share in 2018, fueled by the shale gas revolution.
    • Asia-Pacific expected to register the highest CAGR during the forecast period.
    • Investment in eco-friendly fracking chemicals is increasing due to regulatory pressures.

    Market Size & Forecast

    Market Size Forecast Growth CAGR of 6.54% from 2024 to 2032
    Largest Regional Market Share in 2018 North America

    Major Players

    Key players include AkzoNobel N.V., Ashland Inc., Baker Hughes, Halliburton, Schlumberger, BASF SE, Chevron Phillips Chemical, Clariant International AG, DowDuPont, Albemarle Corporation, FTS International, Calfrac Well Services, and EOG Resources.

    Market Trends

    The increasing demand for energy resources is likely to drive the utilization of fracking chemicals, as regulatory frameworks evolve to accommodate the growing need for efficient extraction methods.

    U.S. Energy Information Administration

    Fracking Chemicals Market Market Drivers

    Rising Energy Prices

    The Global Fracking Chemicals Market Industry is also influenced by the fluctuations in energy prices. As oil and gas prices rise, the economic viability of fracking becomes more attractive, prompting increased exploration and production activities. Higher energy prices incentivize operators to invest in fracking technologies and the associated chemicals necessary for extraction. This dynamic is particularly evident in regions where conventional oil production is declining, making fracking a more appealing option. Consequently, as energy prices continue to fluctuate, the demand for fracking chemicals is likely to experience corresponding increases, further propelling market growth.

    Market Growth Projections

    The Global Fracking Chemicals Market Industry is projected to witness substantial growth over the next decade. With a market value of 30.5 USD Billion in 2024 and an anticipated increase to 50.2 USD Billion by 2035, the industry is poised for a robust expansion. This growth is underpinned by a CAGR of 4.63% from 2025 to 2035, reflecting the increasing reliance on fracking as a method of oil and gas extraction. The market dynamics are influenced by various factors, including technological advancements, regulatory support, and the ongoing demand for energy. These projections suggest a promising future for the fracking chemicals sector.

    Regulatory Support for Fracking

    Regulatory frameworks are evolving to support the Global Fracking Chemicals Market Industry, as governments recognize the economic benefits of domestic energy production. In many regions, policies are being implemented to streamline the permitting process for fracking operations, thereby encouraging investment. This regulatory support is crucial in regions like the United States, where fracking has significantly boosted local economies and job creation. As regulatory environments become more favorable, the demand for fracking chemicals is expected to rise, facilitating the growth of the market. This trend indicates a potential for increased production and consumption of fracking chemicals in the coming years.

    Increasing Demand for Natural Gas

    The Global Fracking Chemicals Market Industry is experiencing a surge in demand for natural gas, driven by its role as a cleaner alternative to coal and oil. As countries strive to reduce carbon emissions, natural gas is increasingly viewed as a transitional fuel. In 2024, the market is projected to reach 30.5 USD Billion, reflecting this growing preference. The shift towards natural gas is particularly evident in regions such as North America and Europe, where regulatory frameworks are evolving to support its use. This trend is likely to bolster the fracking chemicals market, as enhanced extraction techniques require specialized chemical formulations.

    Global Energy Transition Initiatives

    The Global Fracking Chemicals Market Industry is being shaped by global energy transition initiatives aimed at reducing reliance on fossil fuels. While there is a push towards renewable energy sources, natural gas remains a key component of the energy mix during this transition. Governments and organizations are recognizing the role of fracking in providing a stable energy supply while renewable technologies are being developed. This dual approach is likely to sustain the demand for fracking chemicals as countries balance their energy portfolios. The market is expected to adapt to these changes, ensuring that fracking remains a viable option in the evolving energy landscape.

    Technological Advancements in Fracking

    Technological innovations are significantly influencing the Global Fracking Chemicals Market Industry. Enhanced oil recovery techniques and advanced fracking methods, such as horizontal drilling and multi-stage fracturing, are improving extraction efficiency. These advancements not only increase production rates but also reduce environmental impacts, making fracking more sustainable. As a result, the market is expected to grow at a CAGR of 4.63% from 2025 to 2035, reaching an estimated 50.2 USD Billion by 2035. Companies are investing in research and development to create more effective and environmentally friendly fracking chemicals, which is likely to further drive market growth.

    Market Segment Insights

    Regional Insights

    Key Companies in the Fracking Chemicals Market market include

    Industry Developments

    October 2021

    - Liberty Oilfield Services Inc., a Denver-based company, has announced the completion of acquiring a prominent supplier of proppant delivery equipment, software, and logistics solutions, PropX. The company reported a 12% in third-quarter revenue this year. Liberty becomes the send-largest provider of natural gas & oil producers with fracking and well-completion services, with this deal worth USD90 million. The deal comprised of USD5 million in cash and the other 5.8 million shares of Liberty’s common stock having net valued of over USD76.5 million based on a 30-day average closing share price of USD13.08.

    PropX, established in 2016, is a prominent supplier of last-mile proppant delivery solutions, including logistics software and proppant handling equipment across the North American region. The company offers advanced eco-friendly technology coupled with benefits such as canceling out emissions, reducing noise, driving logistics efficiency, wellsite proppant handling equipment, and better dry and wet sand containers.

    April 2021

    - California is set to ban new oil fracking by 2024 under an executive order that Gov. Gavin Newsom, announced that with small fanfare following months of confusing mixed messages.The order came as a shock to the oil firms in the state but a narrow victory for environmentalists, who have been forcing Newsom to do more to combat fossil fuels, pollutions, and climate change pollution in disadvantaged communities.

    Intended Audience
      • Fracking chemicals manufacturers
      • Traders and distributors of fracking chemicals
      • Research and development institutes
      • Potential investors
      • Raw material suppliers
      • Nationalized laboratory

    Future Outlook

    Fracking Chemicals Market Future Outlook

    The Fracking Chemicals Market is projected to grow at a 4.63% CAGR from 2024 to 2035, driven by increasing energy demands, technological advancements, and regulatory support.

    New opportunities lie in:

    • Invest in eco-friendly fracking chemicals to meet regulatory standards and consumer preferences.
    • Develop advanced data analytics tools for optimizing chemical usage and reducing costs.
    • Explore partnerships with renewable energy firms to diversify product offerings and enhance sustainability.

    By 2035, the Fracking Chemicals Market is expected to achieve substantial growth, reflecting evolving industry dynamics and increased environmental considerations.

    Market Segmentation

    Report Scope

    Report Attribute/Metric Details
      Market Size   2030 : Significant Value
      CAGR   6.54% 2030
      Base Year   2023
      Forecast Period   2024-2032
      Historical Data   2019 & 2020
      Forecast Units   Value (USD Million)
      Report Coverage   Revenue Forecast, Competitive Landscape, Growth Factors, and Trends
      Segments Covered   Type, Fluid Type
      Geographies Covered   North America, Europe, Asia-Pacific, and Rest of the World (RoW)
      Key Vendors   AkzoNobel N.V. (The Netherlands), Ashland Inc. (US), Baker Hughes Incorporated (US), Halliburton. (US), Schlumberger Limited (US), BASF SE (Germany), Chevron Phillips Chemical Company (US), Clariant International AG (Switzerland), DowDuPont (US), Albemarle Corporation. (US), FTS International Inc. (US), Calfrac Well Services Ltd. (Canada), and EOG Resources, Inc. (US)
      Key Market Opportunities   New product launches and R&D Amongst major key Players
      Key Market Drivers   Rising demand for oil & gas across the globe

    Market Highlights

    Author

    Chitranshi Jaiswal
    Research Analyst Level I

    She holds an experience of about 6+ years in market research and business consulting, working under the spectrum of information communication technology, telecommunications and semiconductor domains. aarti conceptualizes and implements a scalable business strategy and provides strategic leadership to the clients. her expertise lies in market estimation, competitive intelligence, pipeline analysis, customer assessment, etc.

    Leave a Comment

    Latest Comments

    John Doe
    john@example.com

    This is a great article! Really helped me understand the topic better.

    Posted on July 23, 2025, 10:15 AM
    Jane Smith
    jane@domain.com

    Thanks for sharing this. I’ve bookmarked it for later reference.

    Posted on July 22, 2025, 7:45 PM

    FAQs

    What are fracking chemicals?

    Fracking chemicals are a wide range of chemicals used in oil and gas drilling operations to make the extraction of hydrocarbons an easier process.

    What is the CAGR of the market?

    The market is expected to exhibit a strong 6.54% CAGR over the forecast period from 2025-2035.

    What is the major driver for the market?

    The growing demand for fracking is the major driver for the fracking chemicals market.

    Which is the leading regional market?

    North America is the major regional market for fracking chemicals due to the growing preference for fracking in the region.

    What are the leading market players?

    Leading players in the fracking chemicals market include AkzoNobel, BASF, and Ashland, among others.

    1. Executive Summary
    2. Scope of the Report
      1. 2.1
      2. Market Definition
      3. Scope of the
      4. Study
      5. Markets Structure
    3. Market Research Methodology
      1. Research Process
      2. 3.2
      3. Secondary Research
      4. Primary Research
      5. Forecast Model
      6. 3.5
      7. List of Assumptions
    4. Market Landscape
      1. Supply Chain Analysis
        1. Manufacturers/Producers
        2. Distributors/Retailers/Wholesalers/E-Commerce
        3. End Users
        4. Bargaining
        5. Bargaining Power
        6. Threat of Substitutes
        7. Intensity of Rivalry
      2. 4.1.1
      3. Raw Material Suppliers
      4. 4.2
      5. Porter’s Five Forces Analysis
      6. 4.2.1
      7. Threat of New Entrants
      8. Power of Buyers
      9. of Suppliers
    5. Market
      1. Dynamics of the Global Fracking Chemicals Market
      2. 5.1
      3. Introduction
      4. Drivers
      5. Restraints
      6. 5.4
      7. Opportunities
      8. Challenges
      9. 5.6
      10. Trends/Technology
    6. Global Fracking
    7. Chemicals Market, by Type
      1. Introduction
        1. Market
      2. 6.2
      3. Gelling Agent
      4. 6.2.1
      5. Market Estimates & Forecast, 2020–2027
      6. Estimates & Forecast by Region, 2020–2027
      7. Friction
        1. Market
        2. Market Estimates &
      8. Reducer
      9. Estimates & Forecast, 2020–2027
      10. Forecast by Region, 2020–2027
      11. Corrosion Inhibitor
        1. Market Estimates
        2. Market Estimates & Forecast
        3. Market Estimates & Forecast, 2020–2027
        4. Market Estimates & Forecast by Region, 2020–2027
      12. & Forecast, 2020–2027
      13. by Region, 2020–2027
      14. 6.5
      15. Biocide
      16. Surfactant
        1. Market
      17. 6.6.1
      18. Market Estimates & Forecast, 2020–2027
      19. Estimates & Forecast by Region, 2020–2027
      20. Scale Inhibitor
        1. Market
        2. Market Estimates &
      21. Estimates & Forecast, 2020–2027
      22. Forecast by Region, 2020–2027
      23. Clay Stabilizer
        1. Market Estimates &
        2. Market Estimates & Forecast by Region,
        3. Market Estimates & Forecast, 2020–2027
        4. Market Estimates & Forecast by Region, 2020–2027
      24. Forecast, 2020–2027
      25. 6.9
      26. pH Adjusting Agent
      27. Cross Linker
        1. Market Estimates & Forecast, 2020–2027
      28. 6.10.2
      29. Market Estimates & Forecast by Region, 2020–2027
      30. Iron Control Agent
        1. Market
      31. 6.11.1
      32. Market Estimates & Forecast, 2020–2027
      33. Estimates & Forecast by Region, 2020–2027
      34. Others
        1. Market Estimates
        2. Market Estimates & Forecast
      35. & Forecast, 2020–2027
      36. by Region, 2020–2027
    8. Global Fracking Chemicals Market,
      1. by FluidType
      2. Introduction
      3. Water-Based
        1. Market Estimates & Forecast, 2020–2027
        2. Market Estimates & Forecast, 2020–2027
        3. Market Estimates & Forecast by Region, 2020–2027
        4. Market Estimates & Forecast, 2020–2027
        5. Market Estimates & Forecast by Region, 2020–2027
      4. 7.2.2
      5. Market Estimates & Forecast by Region, 2020–2027
      6. 7.3
      7. Oil-Based
      8. 7.4
      9. Foam-Based
      10. 8.
    9. Global Fracking Chemicals Market, by Region
      1. Introduction
      2. North America
        1. Market Estimates &
        2. Market Estimates & Forecast
        3. Market Estimates & Forecast
        4. US
        5. Canada
        6. Market Estimates & Forecast, 2020–2027
        7. Market Estimates & Forecast by Type, 2020–2027
        8. UK
        9. Russia
        10. Poland
        11. Rest
        12. Market Estimates & Forecast,
        13. Market Estimates & Forecast by Type,
        14. Market Estimates & Forecast by Fluid
        15. China
        16. India
        17. Japan
        18. Australia
        19. Rest of Asia-Pacific
        20. Market Estimates &
        21. Market Estimates & Forecast
        22. Market Estimates & Forecast
        23. Turkey
        24. Israel
        25. North Africa
        26. GCC
        27. Rest of Middle East & Africa
      3. Forecast, 2020–2027
      4. by Type, 2020–2027
      5. by Fluid Type, 2020–2027
      6. & Forecast by Type, 2020–2027
      7. 8.2.5.1
      8. Market Estimates & Forecast, 2020–2027
      9. 8.2.5.3
      10. Market Estimates & Forecast by Fluid Type, 2020–2027
      11. 8.3
      12. Europe
      13. 8.3.3
      14. Market Estimates & Forecast by Fluid Type, 2020–2027
      15. 8.3.4
      16. Germany
      17. 8.3.4.1
      18. Market Estimates & Forecast, 2020–2027
      19. 8.3.4.3
      20. Market Estimates & Forecast by Fluid Type, 2020–2027
      21. 8.3.5
      22. France
      23. 8.3.5.1
      24. Market Estimates & Forecast, 2020–2027
      25. 8.3.5.3
      26. Market Estimates & Forecast by Fluid Type, 2020–2027
      27. 8.3.6
      28. Italy
      29. 8.3.6.1
      30. Market Estimates & Forecast, 2020–2027
      31. 8.3.6.3
      32. Market Estimates & Forecast by Fluid Type, 2020–2027
      33. 8.3.7
      34. Spain
      35. 8.3.7.1
      36. Market Estimates & Forecast, 2020–2027
      37. & Forecast by Fluid Type, 2020–2027
      38. & Forecast, 2020–2027
      39. Forecast by Fluid Type, 2020–2027
      40. & Forecast, 2020–2027
      41. Forecast by Fluid Type, 2020–2027
      42. Forecast, 2020–2027
      43. Forecast by Fluid Type, 2020–2027
      44. of Europe
      45. 8.3.11.1
      46. Market Estimates & Forecast, 2020–2027
      47. 8.3.11.3
      48. Market Estimates & Forecast by Fluid Type, 2020–2027
      49. 8.4
      50. Asia-Pacific
      51. Type, 2020–2027
      52. 8.4.4.2
      53. Market Estimates & Forecast by Type, 2020–2027
      54. by Fluid Type, 2020–2027
      55. & Forecast, 2020–2027
      56. & Forecast by Fluid Type, 2020–2027
      57. & Forecast, 2020–2027
      58. & Forecast by Fluid Type, 2020–2027
      59. & New Zealand
      60. 8.4.7.1
      61. Market Estimates & Forecast, 2020–2027
      62. by Type, 2020–2027
      63. 8.4.7.3
      64. Market Estimates & Forecast by Fluid Type, 2020–2027
      65. & Forecast by Type, 2020–2027
      66. 8.5
      67. Middle East & Africa
      68. Forecast, 2020–2027
      69. by Type, 2020–2027
      70. by Fluid Type, 2020–2027
      71. 8.5.4.2
      72. Market Estimates & Forecast by Type, 2020–2027
      73. Type, 2020–2027
      74. & Forecast by Type, 2020–2027
      75. & Forecast by Type, 2020–2027
      76. by Type, 2020–2027
      77. 8.5.7.3
      78. Market Estimates & Forecast by Fluid Type, 2020–2027
      79. & Forecast by Type, 2020–2027
      80. Latin America
        1. Market Estimates &
        2. Market Estimates & Forecast
        3. Market Estimates & Forecast
        4. Brazil
        5. Argentina
        6. Mexico
        7. Rest
      81. Forecast, 2020–2027
      82. by Type, 2020–2027
      83. by Fluid Type, 2020–2027
      84. Forecast, 2020–2027
      85. Forecast by Fluid Type, 2020–2027
      86. & Forecast, 2020–2027
      87. Forecast by Fluid Type, 2020–2027
      88. & Forecast, 2020–2027
      89. Forecast by Fluid Type, 2020–2027
      90. of Latin America
      91. 8.6.7.1
      92. Market Estimates & Forecast, 2020–2027
      93. 8.6.7.3
      94. Market Estimates & Forecast by Fluid Type, 2020–2027
      95. 9.
      96. Company Landscape
      97. Introduction
      98. Market Strategies
      99. 9.3
      100. Key Development Analysis (Expansion/Merger & Acquisitions/Joint Venture/New
      101. Product Development/Agreement/Investment)
    10. Company
      1. Profiles
      2. AkzoNobel N.V.
        1. Company
        2. Financial Updates
        3. Product/Business Segment Overview
        4. Key Developments
        5. SWOT Analysis
      3. Overview
      4. 10.1.4
      5. Key Strategies
      6. Ashland
        1. Company Overview
        2. Key
        3. Key Developments
      7. Inc.
      8. 10.2.2
      9. Financial Updates
      10. 10.2.3
      11. Product/Business Segment Overview
      12. Strategies
      13. 10.2.6
      14. SWOT Analysis
      15. Baker Hughes Incorporated
        1. Financial Updates
        2. Product/Business Segment Overview
        3. Key Strategies
        4. SWOT Analysis
      16. 10.3.1
      17. Company Overview
      18. 10.3.5
      19. Key Developments
      20. Halliburton
        1. Company Overview
        2. Key
        3. Key Developments
      21. 10.4.2
      22. Financial Updates
      23. 10.4.3
      24. Product/Business Segment Overview
      25. Strategies
      26. 10.4.6
      27. SWOT Analysis
      28. Schlumberger Limited
        1. Financial Updates
        2. Product/Business Segment Overview
        3. Key Strategies
        4. SWOT Analysis
      29. 10.5.1
      30. Company Overview
      31. 10.5.5
      32. Key Developments
      33. BASF SE
        1. Company Overview
        2. Key
        3. Key Developments
      34. 10.6.2
      35. Financial Updates
      36. 10.6.3
      37. Product/Business Segment Overview
      38. Strategies
      39. 10.6.6
      40. SWOT Analysis
      41. Chevron Phillips Chemical
        1. Company Overview
        2. Key
        3. Key Developments
      42. 10.7.2
      43. Financial Updates
      44. 10.7.3
      45. Product/Business Segment Overview
      46. Strategies
      47. 10.7.6
      48. SWOT Analysis
      49. Clariant International AG
        1. Company Overview
        2. Product/Business
        3. Key Strategies
        4. Key Developments
      50. 10.8.2
      51. Financial Updates
      52. Segment Overview
      53. 10.8.6
      54. SWOT Analysis
      55. DowDuPont
        1. Financial Updates
        2. Product/Business Segment Overview
        3. Key Strategies
        4. SWOT Analysis
      56. 10.9.1
      57. Company Overview
      58. 10.9.5
      59. Key Developments
      60. Albemarle Corporation
        1. Company Overview
        2. Financial Updates
        3. Key Developments
        4. SWOT Analysis
      61. 10.10.3
      62. Product/Business Segment Overview
      63. 10.10.4
      64. Key Strategies
      65. FTS International Inc.
        1. Financial
        2. Product/Business Segment
        3. Key Strategies
        4. SWOT Analysis
      66. 10.11.1
      67. Company Overview
      68. Updates
      69. Overview
      70. 10.11.5
      71. Key Developments
      72. Calfrac Well Services Ltd.
        1. Company Overview
        2. Product/Business
        3. Key Strategies
        4. Key Developments
      73. 10.12.2
      74. Financial Updates
      75. Segment Overview
      76. 10.12.6
      77. SWOT Analysis
      78. EOG Resources, Inc.
        1. Company
        2. Financial Updates
        3. Product/Business Segment Overview
        4. Key Developments
        5. SWOT Analysis
      79. Overview
      80. 10.13.4
      81. Key Strategies
    11. Conclusion
    12. LIST OF TABLES
    13. Global
      1. Fracking Chemicals Market: By Region, 2020–2027
      2. Table 2
      3. North America Fracking Chemicals Market: By Country, 2020–2027
    14. Europe Fracking Chemicals Market: By Country, 2020–2027
    15. Asia-Pacific Fracking Chemicals Market: By
      1. Country, 2020–2027
    16. Middle East &
      1. Africa Fracking Chemicals Market: By Country, 2020–2027
      2. Table
    17. Latin America Fracking Chemicals Market: By Country, 2020–2027
    18. Global Fracking Chemicals Type Market: By
      1. Regions, 2020–2027
    19. North America Fracking
      1. Chemicals Type Market: By Country, 2020–2027
      2. Table 9
      3. Europe Fracking Chemicals Type Market: By Country, 2020–2027
      4. Table10 Asia-Pacific Fracking Chemicals Type Market: By Country,
      5. Table11 Middle East & Africa Fracking
      6. Chemicals Type Market: By Country, 2020–2027
      7. Table12
      8. Latin America Fracking Chemicals Type Market: By Country, 2020–2027
    20. Global Fracking Chemicals Fluid Type Market:
      1. By Regions, 2020–2027
      2. Table14 North America
      3. Fracking Chemicals Fluid Type Market: By Country, 2020–2027
      4. Table15
      5. Europe Fracking Chemicals Fluid Type Market: By Country, 2020–2027
      6. Table16 Asia-Pacific Fracking Chemicals Fluid Type Market: By
      7. Country, 2020–2027
      8. Table17 Middle East &
      9. Africa Fracking Chemicals Fluid Type Market: By Country, 2020–2027
      10. Table18 Latin America Fracking Chemicals by Fluid Type Market:
      11. By Country, 2020–2027
      12. Table19 Global Type Market:
      13. By Region, 2020–2027
      14. Table20 Global Fluid Type
      15. Market: By Region, 2020–2027
      16. Table21 North America
    21. Fracking Chemicals Market, by Country
      1. Table22 North
    22. America Fracking Chemicals Market, by Type
      1. Table23 North
    23. America Fracking Chemicals Market, by Fluid Type
      1. Table24
    24. Europe: Fracking Chemicals Market, by Country
      1. Table25
    25. Europe: Fracking Chemicals Market, by Type
      1. Table26
    26. Europe: Fracking Chemicals Market, by Fluid Type
      1. Table27
    27. Asia-Pacific: Fracking Chemicals Market, by Country
      1. Table28
    28. Asia-Pacific: Fracking Chemicals Market, by Type
      1. Table29
    29. Asia-Pacific: Fracking Chemicals Market, by Fluid Type
      1. Table30
    30. Middle East & Africa: Fracking Chemicals Market, by Country
      1. Table31 Middle East & Africa Fracking Chemicals Market,
      2. by Type
      3. Table32 Middle East & Africa: Fracking
    31. Chemicals Market, by Fluid Type
      1. Table33 Latin America:
    32. Fracking Chemicals Market, by Country
      1. Table34 Latin
    33. America Fracking Chemicals Market, by Type
      1. Table35 Latin
    34. America: Fracking Chemicals Market, by Fluid Type
    35. LIST OF FIGURES
    36. Global Fracking Chemicals Market Segmentation
    37. Forecast Research Methodology
      1. FIGURE 3
      2. Five Forces Analysis of the Global Fracking Chemicals Market
      3. FIGURE 4
      4. Value Chain of the Global Fracking Chemicals Market
      5. FIGURE 5
    38. Share of the Global Fracking Chemicals Market in 2020, by Country
    39. Global Fracking Chemicals Market, 2020–2027,
      1. FIGURE
    40. Global Fracking Chemicals Market Size, by Type, 2020
      1. FIGURE
    41. Share of the Global Fracking Chemicals Market, by Type, 2020–2027
    42. Global Fracking Chemicals Market Size, by Fluid Type, 2020
    43. FIGURE10 Share of the Global Fracking Chemicals Market, by Fluid Type,

    Fracking Chemicals Market Segmentation

    Market Segmentation Overview

    • Detailed segmentation data will be available in the full report
    • Comprehensive analysis by multiple parameters
    • Regional and country-level breakdowns
    • Market size forecasts by segment
    Infographic

    Free Sample Request

    Kindly complete the form below to receive a free sample of this Report

    Get Free Sample

    Customer Strories

    “I am very pleased with how market segments have been defined in a relevant way for my purposes (such as "Portable Freezers & refrigerators" and "last-mile"). In general the report is well structured. Thanks very much for your efforts.”

    Victoria Milne

    Founder
    Case Study
    Chemicals and Materials