Fortified Breakfast Spreads Market
ID: MRFR/FnB/2587-HCR
128 Pages
Snehal Singh
Last Updated: May 15, 2026
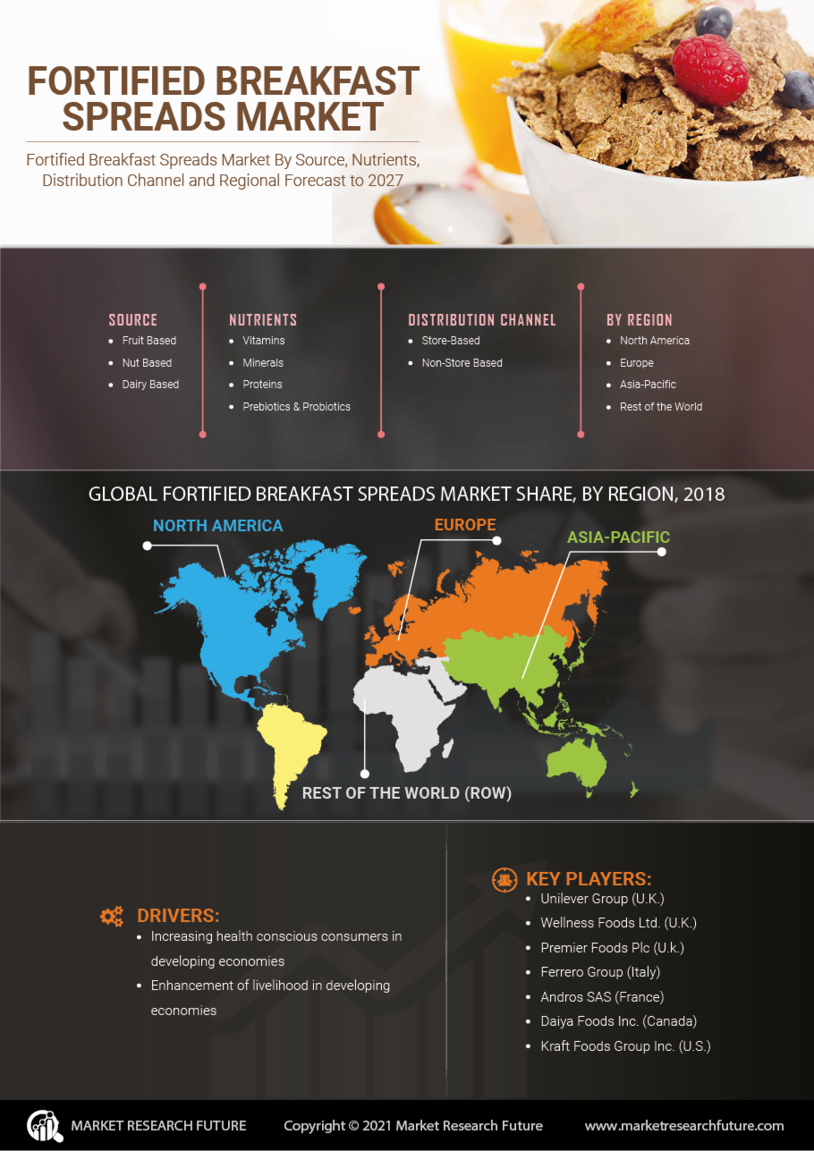
Fortified Breakfast Spreads Market Size, Share, Industry Trend & Analysis Research Report By Product Type (Nut Butters, Fruit Spreads, Chocolate Spreads, Hummus, Cream Cheeses), By Nutritional Fortification Type (Vitamins, Minerals, Protein, Fiber, Omega Fatty Acids), By Distribution Channel (Supermarkets, Health Food Stores, Online Retail, Convenience Stores, Specialty Stores), By Consumer Type (Adults, Children, Athletes, Health-Conscious Individuals) andBy Regional (North America, Europe, South America, Asia Pacific, Middle East and Africa)- Forecast to 2035