1 Executive Summary
2 Market Introduction
2.1 Definition 12
2.2 Scope of the Study 12
2.3 List of Assumptions 13
2.4 Market Structure 13
3 Research Methodology
3.1 Research Process 14
3.2 Primary Research 15
3.3 Secondary Research 16
3.4 Market Size Estimation 17
3.5 Forecast Model 17
3.6 Secondary Sources 18
4 Market Insights
5 Market Dynamics
5.1 Introduction 23
5.2 Drivers 24
5.2.1 Increasing Investments by Flying Car Companies 24
5.2.2 Rising Traffic Congestion 24
5.2.3 Drivers Impact Analysis 26
5.3 Restraints 26
5.3.1 Limited Endurance and Safety and High Costs 26
5.3.2 Restraints Impact Analysis 27
5.4 Opportunity 27
5.4.1 Rising Awareness Regarding the Pollution 27
6 Market Factor Analysis
6.1 Value Chain Analysis 28
6.1.1 Inbound Logistics 29
6.1.2 Operations 29
6.1.3 Outbound Logistics 29
6.1.4 Marketing and Sales 29
6.1.5 Services 30
6.1.6 Support Activities 30
6.2 Porter's Five Forces Analysis 30
6.2.1 Threat of New Entrants 31
6.2.2 Bargaining Power of Suppliers 31
6.2.3 Bargaining Power of Buyers 31
6.2.4 Threat of Substitutes 31
6.2.5 Rivalry 31
6.3 Technology Trends 32
6.3.1 Development of reliable flying cars 32
7 Global Flying Cars Market, by Product
7.1 Overview 33
7.2 Flying Cars 33
7.3 Passenger Drones 33
8 Global Flying Cars Market, by Capacity
8.1 Overview 35
8.2 2-Person Sitter 35
8.3 3 and 4-Person Sitter 35
8.4 5-Person Sitter 35
9 Global Flying Cars Market, by Region
9.1 Introduction 37
9.2 North America 38
9.2.1 US 40
9.2.2 Canada 41
9.3 Europe 42
9.3.1 Germany 44
9.3.2 France 45
9.3.3 UK 46
9.3.4 Slovakia 47
9.4 Asia-Pacific 48
9.4.1 China 50
9.4.2 Japan 51
9.4.3 South Korea 52
9.5 Rest of the World (RoW) 53
9.5.1 Israel 55
9.5.2 UAE 56
10 Competitive Landscape
10.1 Competitive Overview 57
10.2 Competitive Benchmarking 58
10.3 Key Developments and Growth Strategies 59
11 Company Profiles
11.1 AeroMobil 60
11.1.1 Company Overview 60
11.1.2 Financial Overview 60
11.1.3 Products Offered 60
11.1.4 Key Developments 60
11.1.5 SWOT Analysis 61
11.1.6 Key Strategies 61
11.2 Boeing 62
11.2.1 Company Overview 62
11.2.2 Financial Overview 62
11.2.3 Products Offered 63
11.2.4 Key Developments 63
11.2.5 SWOT Analysis 63
11.2.6 Key Strategies 63
11.3 Cartivator 64
11.3.1 Company Overview 64
11.3.2 Financial Overview 64
11.3.3 Products Offered 64
11.3.4 Key Developments 64
11.3.5 SWOT Analysis 65
11.3.6 Key Strategies 65
11.4 EHANG 66
11.4.1 Company Overview 66
11.4.2 Financial Overview 66
11.4.3 Products Offered 66
11.4.4 Key Developments 66
11.4.5 SWOT Analysis 67
11.4.6 Key Strategies 67
11.5 TERRAFUGIA 68
11.5.1 Company Overview 68
11.5.2 Financial Overview 68
11.5.3 Products Offered 68
11.5.4 Key Developments 68
11.5.5 SWOT Analysis 69
11.5.6 Key Strategies 69
11.6 Joby Aviation 70
11.6.1 Company Overview 70
11.6.2 Financial Overview 70
11.6.3 Products Offered 70
11.6.4 Key Developments 70
11.7 Lilium 71
11.7.1 Company Overview 71
11.7.2 Financial Overview 71
11.7.3 Products Offered 71
11.7.4 Key Developments 71
11.8 Uber Technologies, Inc. 72
11.8.1 Company Overview 72
11.8.2 Financial Overview 72
11.8.3 Products Offered 72
11.8.4 Key Developments 73
11.9 Volocopter GmbH 74
11.9.1 Company Overview 74
11.9.2 Financial Overview 74
11.9.3 Products Offered 74
11.9.4 Key Developments 74
11.10 A³ by Airbus 75
11.10.1 Company Overview 75
11.10.2 Financial Overview 75
11.10.3 Products Offered 75
11.10.4 Key Developments 76
12 List of Tables
TABLE 1 LIST OF ASSUMPTIONS 13
TABLE 2 GLOBAL FLYING CARS MARKET, BY PRODUCT, 2022–2035 (USD MILLION) 34
TABLE 3 GLOBAL FLYING CARS MARKET, BY CAPACITY, 2022–2035 (USD MILLION) 36
TABLE 4 GLOBAL FLYING CARS MARKET, BY REGION, 2022–2035 (USD MILLION) 37
TABLE 5 NORTH AMERICA: FLYING CARS MARKET, BY COUNTRY, 2022–2035 (USD MILLION) 38
TABLE 6 NORTH AMERICA: FLYING CARS MARKET, BY PRODUCT, 2022–2035 (USD MILLION) 39
TABLE 7 NORTH AMERICA: FLYING CARS MARKET, BY CAPACITY, 2022–2035 (USD MILLION) 39
TABLE 8 US: FLYING CARS MARKET, BY PRODUCT, 2022–2035 (USD MILLION) 40
TABLE 9 US: FLYING CARS MARKET, BY CAPACITY, 2022–2035 (USD MILLION) 40
TABLE 10 CANADA: FLYING CARS MARKET, BY PRODUCT, 2022–2035 (USD MILLION) 41
TABLE 11 CANADA: FLYING CARS MARKET, BY CAPACITY, 2022–2035 (USD MILLION) 41
TABLE 12 EUROPE: FLYING CARS MARKET, BY COUNTRY, 2022–2035 (USD MILLION) 42
TABLE 13 EUROPE: FLYING CARS MARKET, BY PRODUCT, 2022–2035 (USD MILLION) 43
TABLE 14 EUROPE: FLYING CARS MARKET, BY CAPACITY, 2022–2035 (USD MILLION) 43
TABLE 15 GERMANY: FLYING CARS MARKET, BY PRODUCT, 2022–2035 (USD MILLION) 44
TABLE 16 GERMANY: FLYING CARS MARKET, BY CAPACITY, 2022–2035 (USD MILLION) 44
TABLE 17 FRANCE: FLYING CARS MARKET, BY PRODUCT, 2022–2035 (USD MILLION) 45
TABLE 18 FRANCE: FLYING CARS MARKET, BY CAPACITY, 2022–2035 (USD MILLION) 45
TABLE 19 UK: FLYING CARS MARKET, BY PRODUCT, 2022–2035 (USD MILLION) 46
TABLE 20 UK: FLYING CARS MARKET, BY CAPACITY, 2022–2035 (USD MILLION) 46
TABLE 21 SLOVAKIA: FLYING CARS MARKET, BY PRODUCT, 2022–2035 (USD MILLION) 47
TABLE 22 SLOVAKIA: FLYING CARS MARKET, BY CAPACITY, 2022–2035 (USD MILLION) 47
TABLE 23 ASIA-PACIFIC: FLYING CARS MARKET, BY COUNTRY, 2022–2035 (USD MILLION) 49
TABLE 24 ASIA-PACIFIC: FLYING CARS MARKET, BY PRODUCT, 2022–2035 (USD MILLION) 49
TABLE 25 ASIA-PACIFIC: FLYING CARS MARKET, BY CAPACITY, 2022–2035 (USD MILLION) 49
TABLE 26 CHINA: FLYING CARS MARKET, BY PRODUCT, 2022–2035 (USD MILLION) 50
TABLE 27 CHINA: FLYING CARS MARKET, BY CAPACITY, 2022–2035 (USD MILLION) 50
TABLE 28 JAPAN: FLYING CARS MARKET, BY PRODUCT, 2022–2035 (USD MILLION) 51
TABLE 29 JAPAN: FLYING CARS MARKET, BY CAPACITY, 2022–2035 (USD MILLION) 51
TABLE 30 SOUTH KOREA: FLYING CARS MARKET, BY PRODUCT, 2022–2035 (USD MILLION) 52
TABLE 31 SOUTH KOREA: FLYING CARS MARKET, BY CAPACITY, 2022–2035 (USD MILLION) 52
TABLE 32 ROW: FLYING CARS MARKET, BY COUNTRY, 2022–2035 (USD MILLION) 53
TABLE 33 ROW: FLYING CARS MARKET, BY PRODUCT, 2022–2035 (USD MILLION) 54
TABLE 34 ROW: FLYING CARS MARKET, BY CAPACITY, 2022–2035 (USD MILLION) 54
TABLE 35 ISRAEL: FLYING CARS MARKET, BY PRODUCT, 2022–2035 (USD MILLION) 55
TABLE 36 ISRAEL: FLYING CARS MARKET, BY CAPACITY, 2022–2035 (USD MILLION) 55
TABLE 37 UAE: FLYING CARS MARKET, BY PRODUCT, 2022–2035 (USD MILLION) 56
TABLE 38 SOUTH AMERICA: FLYING CARS MARKET, BY CAPACITY, 2022–2035 (USD MILLION) 56
TABLE 39 AEROMOBIL: PRODUCTS OFFERED 60
TABLE 40 AEROMOBIL: KEY DEVELOPMENTS 60
TABLE 41 BOEING: PRODUCTS OFFERED 63
TABLE 42 BOEING: KEY DEVELOPMENTS 63
TABLE 43 CARTIVATOR: PRODUCTS OFFERED 64
TABLE 44 CARTIVATOR: KEY DEVELOPMENTS 64
TABLE 45 EHANG: PRODUCTS OFFERED 66
TABLE 46 EHANG: KEY DEVELOPMENTS 66
TABLE 47 TERRAFUGIA: PRODUCTS OFFERED 68
TABLE 48 TERRAFUGIA: KEY DEVELOPMENTS 68
TABLE 49 JOBY AVIATION: PRODUCTS OFFERED 70
TABLE 50 JOBY AVIATION: KEY DEVELOPMENTS 70
TABLE 51 LILIUM: PRODUCTS OFFERED 71
TABLE 52 LILIUM: KEY DEVELOPMENTS 71
TABLE 53 UBER TECHNOLOGIES, INC.: PRODUCTS OFFERED 72
TABLE 54 UBER TECHNOLOGIES, INC.: KEY DEVELOPMENTS 73
TABLE 55 VOLOCOPTER GMBH: PRODUCTS OFFERED 74
TABLE 56 VOLOCOPTER GMBH: KEY DEVELOPMENTS 74
TABLE 57 A³ BY AIRBUS: PRODUCTS OFFERED 75
TABLE 58 A³ BY AIRBUS: KEY DEVELOPMENTS 76
13 List of Figures
FIGURE 1 MARKET SYNOPSIS 11
FIGURE 2 GLOBAL FLYING CARS MARKET: MARKET STRUCTURE 13
FIGURE 3 RESEARCH PROCESS OF MRFR 14
FIGURE 4 TOP-DOWN & BOTTOM-UP APPROACHES 17
FIGURE 5 ASIA-PACIFIC: FLYING CARS MARKET SIZE & MARKET SHARE BY COUNTRY, BY VALUE (2022 VS 2035) 19
FIGURE 6 EUROPE: FLYING CARS MARKET SIZE & MARKET SHARE BY COUNTRY, BY VALUE (2022 VS 2035) 20
FIGURE 7 NORTH AMERICA: FLYING CARS MARKET SIZE & MARKET SHARE BY COUNTRY, BY VALUE (2022 VS 2035) 21
FIGURE 8 REST OF THE WORLD: FLYING CARS MARKET SIZE & MARKET SHARE BY COUNTRY, BY VALUE (2022 VS 2035) 22
FIGURE 9 DRO ANALYSIS: GLOBAL FLYING CARS MARKET 23
FIGURE 10 GLOBAL URBAN POPULATION GROWTH, 2014–2018 24
FIGURE 11 DRIVERS IMPACT ANALYSIS: GLOBAL FLYING CARS MARKET 26
FIGURE 12 RESTRAINTS IMPACT ANALYSIS: FLYING CARS MARKET 27
FIGURE 13 GLOBAL FLYING CARS MARKET: VALUE CHAIN ANALYSIS 28
FIGURE 14 GLOBAL FLYING CARS MARKET: PORTER'S FIVE FORCES ANALYSIS 30
FIGURE 15 GLOBAL FLYING CARS MARKET, BY PRODUCT, 2022 (% SHARE) 33
FIGURE 16 GLOBAL FLYING CARS MARKET, BY CAPACITY, 2022 (% SHARE) 36
FIGURE 17 GLOBAL FLYING CARS MARKET, BY REGION, 2022 (% SHARE) 37
FIGURE 18 NORTH AMERICA: FLYING CARS MARKET, BY COUNTRY, 2022 (% SHARE) 38
FIGURE 19 EUROPE: FLYING CARS MARKET, BY COUNTRY, 2022 (% SHARE) 42
FIGURE 20 ASIA-PACIFIC: FLYING CARS MARKET, BY COUNTRY, 2022 (% SHARE) 48
FIGURE 21 ROW: FLYING CARS MARKET, BY COUNTRY, 2022 (% SHARE) 53
FIGURE 22 BENCHMARKING OF MAJOR COMPETITORS 58
FIGURE 23 KEY DEVELOPMENTS AND GROWTH STRATEGIES 59
FIGURE 24 AEROMOBIL: SWOT ANALYSIS 61
FIGURE 25 BOEING: FINANCIAL SNAPSHOT, 2016–2018 (USD MILLION) 62
FIGURE 26 BOEING: SWOT ANALYSIS 63
FIGURE 27 CARTIVATOR: SWOT ANALYSIS 65
FIGURE 28 EHANG: SWOT ANALYSIS 67
FIGURE 29 TERRAFUGIA.: SWOT ANALYSIS 69
$30 Billion
40%
North America
2020-2035
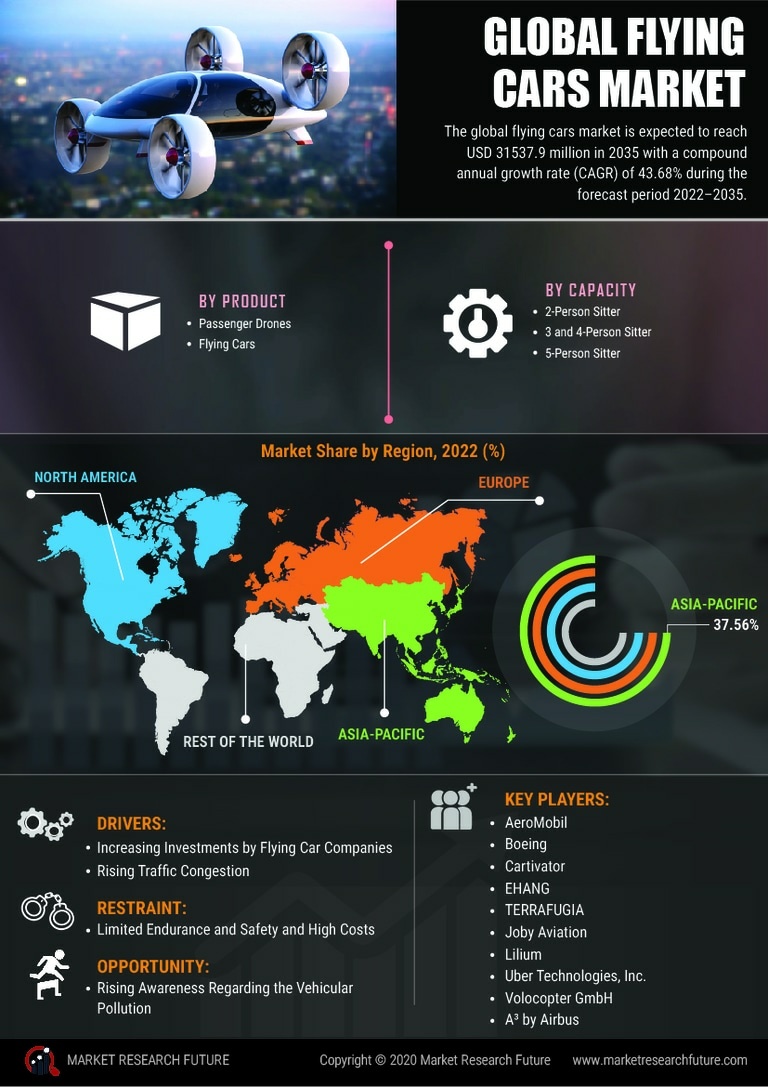
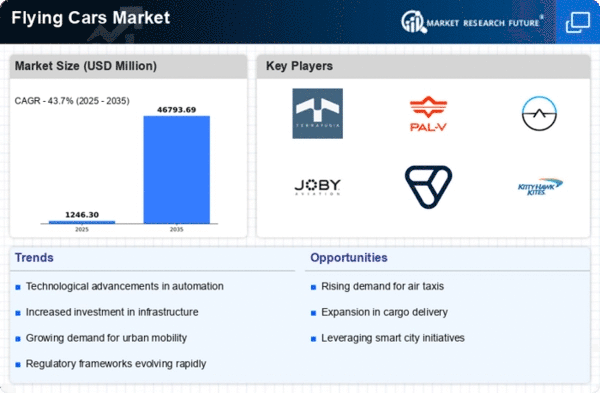
Flying car market value or Flying Cars Market Size is estimated in terms of 40% CAGR during the forecast period of 2035. The global flying market is witnessing rapid growth. This is used for personal transportation that includes the automobile sector. The market research report estimates the hike for the global forecast period of 2018-2023. The Asia Pacific countries are going to dominate the market. This region is expected to grow and also relies upon many countries such as China, Japan, and South Korea. China dominates the flying car market due to the large workforce.
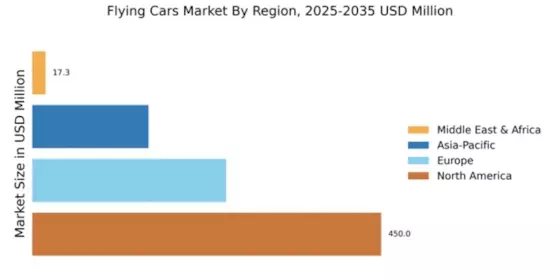
It has many established countries that increase the chances the growth. Various factors affect the global flying car market that includes increasing population, transportation, and rising disposable income. According to the market report, in the year 2022, Europe holds the second largest market share. It comprises countries like the UK, China, Germany, and France. These countries also expected growth in the global market in the upcoming periods. The UK is one of the most well-placed countries for the development of the global flying car market. In 2020, the regional market was valued at USD 89.5 million, which is expected to reach the flying cars market share of USD 30 Billion by 2035.
Covid-19 Analysis:
The automotive sector has been facing issues because of the spread of Covid-19. There is a huge change in consumer preference and requirements that affect the global market value. It affects the market revenue over the forecast period. The lockdown that is being imposed in different countries has affected the market value. Because of this pandemic, multiple borders are sealed and follow strict regulatory actions. There is a high possibility that the pandemic affects consumer preferences.
Because of the remote working process and social distancing, multiple organizations are going to a halt. Because of the strict restrictions on public gathering and ban in traveling the global market, flying cars projected the time frame. Now people are more concerned about personal hygiene that affects the global flying car market's future demand. The key players of the market and the government organizations adapted the various strategical ways that positively impacted the market. By this, the market seems to become stable in terms of sales and opportunity in the global range.
Market dynamics:
Drivers:
Multiple extensive factors raise the flying cars market growth. The market is expected to grow because of the improving infrastructure. The other factors that affect the market revenue are changing lifestyle, increasing urban development, and people's disposable income. The growing competition of global flying car service providers and solutions provides a concern. The concern arises for the safety of vehicles and drivers. The growing demand for environmental-friendly vehicles drives the market growth over the forecast period.
Restraints:
A few market restraints in the pandemic affected the global flying car market sale and demand for the year 2020. These market restraints are the lack of standard protocols and the high initial cost. These factors slow down the flying cars market trends, market growth, and therefore, the market key players propose new measures to implement on the market. As a result, the global flying car market's revenue will increase for the next 5 to 10 years.
Competitive Landscape:
The global flying car market report analyzes the Flying Cars Industry that provides the insight value of the market that emphasizes the global market. It includes some of the prominent players that are Volocopter GmbH (Germany) ,A³ by Airbus (US), AeroMobil (Slovakia), Boeing (US), Cartivator (Japan), EHANG (China), TERRAFUGIA (US), Joby Aviation (US), Lilium (Germany) and Uber Technologies, Inc. (US).. The market analysis suggests product benchmarking through the SWOT analysis and Porter's five force model. The competitive landscape includes the key development strategies that rank the market in the top number. All the key players are imposing on strategic initiatives to promote the expansion of the Industry.
Segment Overview:
The global flying cars market outlook is segmented into various terms. This is segmented on the basis of production capacity. The segmentation of the market depends upon various aspects, which also includes regional segmentation. The segmentation has been carried out with the market size analysis and growth analysis based on the region.
The market segmentation based on the product:
The market is segmented on the basis of product, and it is subcategorized into passenger drones and flying cars. The passenger drone is segmented by expecting the accelerating evolution in drone technology. The rising popularity of eco-friendly drones improves the market revenue day by day.
Market segmentation based on the capacity:
The market is segmented into the capacity type that is sub-categorized into the 2,4,5-person sitter. The two-person sitters flying cars are compactable and require less expensive as compared to 4 and 5-sitter cars.
Regional Analysis:
The global flying car market is also segmented on the basis of regions that include Asia Pacific, North America, Europe, and the rest of the world. According to the global market report, North America is expected to witnesses substantial growth in the market. The market is spread over into the other regions that include the US, Canada, and Mexico, according to the flying cars market analysis. The region has proven its prominence in refined technology. The countries Canada and Mexico are getting ready to adapt to this technology soon for increasing the flying cars market value. The Us is getting ranked in the top position for the development of flying cars. The department of transportation and planning approved the conventional carriers. The companies that operated the major flying car technology are Samson Motors, Inc. (SSN) and Uber Technologies Inc. (UBER).
The key developments of the flying car market
The key objective of this study:
Reasons to check the Flying Cars Market research report:
Industry Updates
Hyundai is all set to develop an airport without a runway in the UK. This will be the first of its kind that has been specially designed for autonomous delivery drones and flying cars.
The global market overview:
Report Attribute/Metric | Details |
---|---|
Market Size | 2035: USD 530 Billion |
CAGR | 40% CAGR (2020-2035) |
Base Year | 2019 |
Forecast Period | 2020-2035 |
Historical Data | 2018 |
Forecast Units | Value (USD Million) |
Report Coverage | Revenue Forecast, Competitive Landscape, Growth Factors, and Trends |
Segments Covered | By Technology, By Application, By Vehicle type, By EndMarket |
Geographies Covered | North America, Europe, Asia-Pacific, and Rest of the World (RoW) |
Key Vendors | Volocopter GmbH (Germany) ,A³ by Airbus (US), AeroMobil (Slovakia), Boeing (US), Cartivator (Japan), EHANG (China), TERRAFUGIA (US), Joby Aviation (US), Lilium (Germany) and Uber Technologies, Inc. (US) |
Key Market Opportunities | New product launches and R&D Amongst major key Players |
Key Market Drivers |
|
Frequently Asked Questions (FAQ) :
This market's expected growth rate is expected to grow up to 43.68% during the forecast period.
The market value can surge considerably in the near future, is projected to be worth USD 550.7 Billion by 2035.
The significant vendors of the global market are Volocopter GmbH (Germany), Inc. (US), Uber Technologies, Joby Aviation (US), AeroMobil (Slovakia), A³ by Airbus (US), TERRAFUGIA (US), Cartivator (Japan), Lilium (Germany), EHANG (China) and Boeing (US)
In the year 2022, Europe is expected to gain the second largest portion of the market.
The market value of Europe by 2035 can be USD 7,116.7 Million.
The flying car market is expected to segment into capacity and products. It is further sub-segmented on the basis of these two factors.
2-person sitter flying car is more compact and need lower investment as compared to its counterparts, bringing down the risk of failure.