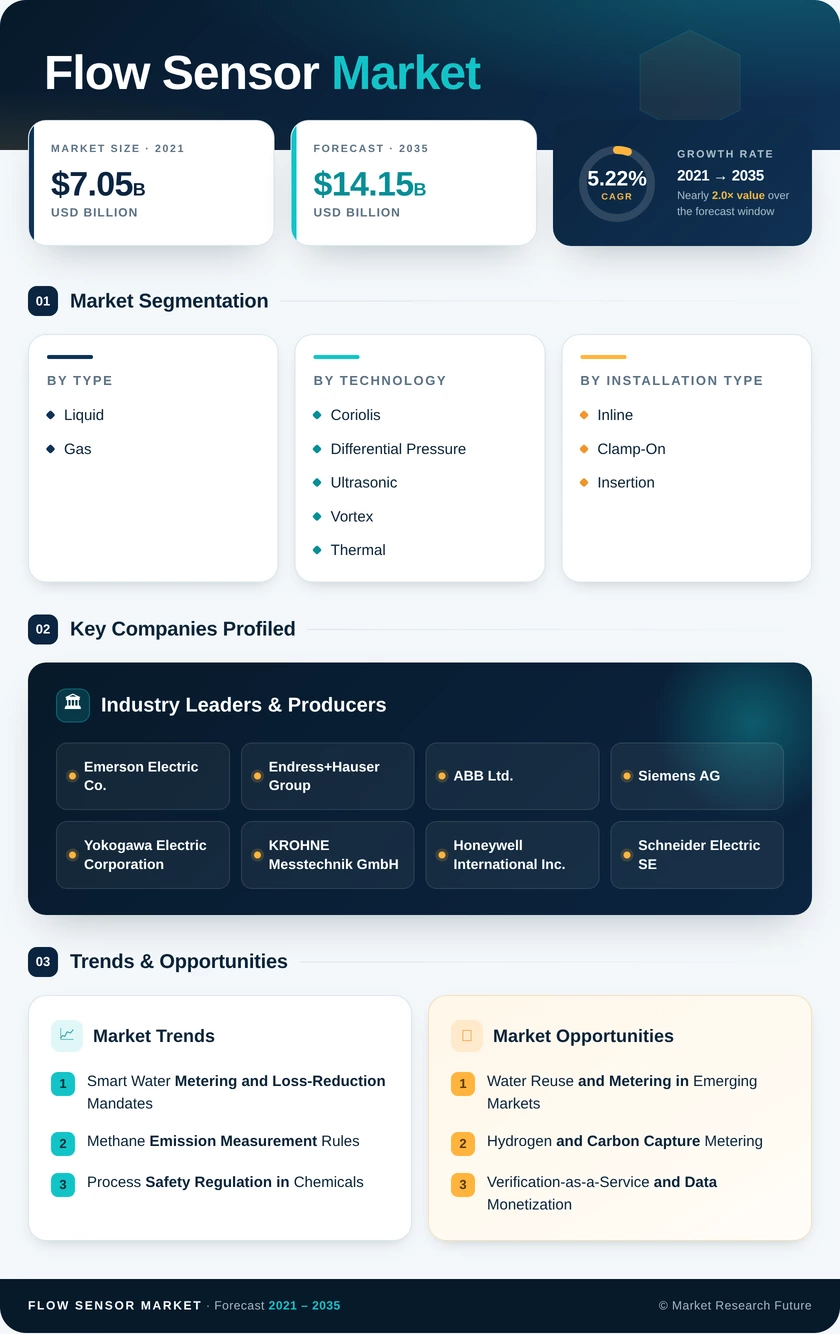
Flow Sensor Market (2026 – 2035)

ID: MRFR/SEM/32369-HCR 128 Pages Aarti Dhapte Last Updated: October 17, 2026
Flow Sensor Market Size, Share and Research Report By Type (Liquid, Gas), By Technology (Coriolis, Differential Pressure, Ultrasonic, Vortex, Thermal, Magnetic), By Installation Type (Inline, Clamp-On, Insertion), By End-User Industry (Oil and Gas, Water and Wastewater, Chemical and Petrochemical, Food and Beverage, Power Generation, Pulp and Paper, Pharmaceuticals, Other Industries) and By Regional (North America, Europe, Asia-Pacific, South America, Middle East & Africa) - Industry Forecast to 2035.
Flow Sensor Market
Market Size
Forecast Period2026-2035
CAGR (2026-2035)5.22%
2025 Market SizeUSD 8.51 Billion
2035 Market SizeUSD 14.15 Billion
Key Players
Emerson Electric Co.
Endress+Hauser Group
ABB Ltd.
Siemens AG
Yokogawa Electric Corporation
KROHNE Messtechnik GmbH
Opportunities
  • Water Reuse and Metering in Emerging Markets
  • Hydrogen and Carbon Capture Metering
  • Verification-as-a-Service and Data Monetization
  1. 1 Market Summary | |
  2. 2 Key Report Takeaways | |
    1. 2.1 By Type | |
    2. 2.2 By Technology | |
    3. 2.3 By Installation Type | |
    4. 2.4 By End-user Industry | |
    5. 2.5 By Region | |
  3. 3 Market Size and Forecast (2021–2035) | |
  4. 4 Driver Impact Analysis | |
    1. 4.1 Smart Water Metering and Loss-Reduction Mandates | |
    2. 4.2 Methane Emission Measurement Rules | |
    3. 4.3 Process Safety Regulation in Chemicals | |
    4. 4.4 Clamp-On Ultrasonic Retrofits in Brownfield Plants | |
    5. 4.5 Digital Diagnostics and Connected Instruments | |
    6. 4.6 Asia Pacific Industrial and Water Build-Out | |
    7. 4.7 Semiconductor and Life Sciences Capacity | |
  5. 5 Restraints Impact Analysis | |
    1. 5.1 High Upfront Cost of Premium Technologies | |
    2. 5.2 Long Replacement Cycles of Installed Meters | |
    3. 5.3 Calibration Burden in Harsh Media | |
    4. 5.4 Cybersecurity Risk in Connected Devices | |
    5. 5.5 Component and Specialty Alloy Supply Constraints | |
  6. 6 Opportunities | |
    1. 6.1 Water Reuse and Metering in Emerging Markets | |
    2. 6.2 Hydrogen and Carbon Capture Metering | |
    3. 6.3 Verification-as-a-Service and Data Monetization | |
    4. 6.4 Single-Use Bioprocessing Sensors | |
    5. 6.5 Measurement-Based Methane Inventories | |
  7. 7 Regional Market Share and Country-Level Analysis | |
    1. 7.1 North America | | |
      1. 7.1.1 United States | | |
      2. 7.1.2 Canada | | |
      3. 7.1.3 Mexico | |
    2. 7.2 Europe | | |
      1. 7.2.1 Germany | | |
      2. 7.2.2 United Kingdom | | |
      3. 7.2.3 France | | |
      4. 7.2.4 Italy | | |
      5. 7.2.5 Rest of Europe | |
    3. 7.3 Asia Pacific | | |
      1. 7.3.1 China | | |
      2. 7.3.2 Japan | | |
      3. 7.3.3 India | | |
      4. 7.3.4 South Korea | | |
      5. 7.3.5 Rest of Asia Pacific | |
    4. 7.4 South America | | |
      1. 7.4.1 Brazil | | |
      2. 7.4.2 Argentina | | |
      3. 7.4.3 Rest of South America | |
    5. 7.5 Middle East and Africa | | |
      1. 7.5.1 Saudi Arabia | | |
      2. 7.5.2 United Arab Emirates | | |
      3. 7.5.3 South Africa | | |
      4. 7.5.4 Rest of Middle East and Africa | |
  8. 8 Future Outlook (2026–2035) | |
    1. 8.1 AI-Driven Diagnostics and Autonomous Operations | |
    2. 8.2 Hydrogen, CCUS, and New Energy Fluids | |
    3. 8.3 Water Scarcity and Reuse | |
    4. 8.4 Sustainability Reporting and Audit-Grade Data | |
  9. 9 Segmentation Analysis | |
    1. 9.1 By Type | | |
      1. 9.1.1 Liquid | | |
      2. 9.1.2 Gas | |
    2. 9.2 By Technology | | |
      1. 9.2.1 Coriolis | | |
      2. 9.2.2 Differential Pressure | | |
      3. 9.2.3 Ultrasonic | | |
      4. 9.2.4 Vortex | | |
      5. 9.2.5 Thermal | | |
      6. 9.2.6 Magnetic | |
    3. 9.3 By Installation Type | | |
      1. 9.3.1 Inline | | |
      2. 9.3.2 Clamp-On | | |
      3. 9.3.3 Insertion | |
    4. 9.4 By End-user Industry | | |
      1. 9.4.1 Oil and Gas | | |
      2. 9.4.2 Water and Wastewater | | |
      3. 9.4.3 Chemical and Petrochemical | | |
      4. 9.4.4 Food and Beverage | | |
      5. 9.4.5 Power Generation | | |
      6. 9.4.6 Pulp and Paper | | |
      7. 9.4.7 Pharmaceuticals | | |
      8. 9.4.8 Other Industries | |
  10. 10 Competitive Landscape | |
    1. 10.1 Market Concentration Analysis | |
    2. 10.2 Competitive Benchmarking Matrix | |
  11. 11 Recent News & Developments | |
  12. 12 Report Scope and Methodology | |
  13. 13 Detailed Sources and Citations | |
  14. 14 Frequently Asked Questions (FAQs) | | LIST OF TABLES | |
  15. TABLE 1 Report Summary — Key Metrics, 2025–2035 | |
  16. TABLE 2 Global Market Size & Forecast, by Revenue (USD Billion), 2021–2035 | |
  17. TABLE 3 Driver Impact Analysis on CAGR, 2026–2035 | |
  18. TABLE 4 Restraints Impact Analysis on CAGR, 2026–2035 | |
  19. TABLE 5 Regional Summary, by Region, 2025–2035 | |
  20. TABLE 6 North America Market, by Country, 2025–2035 | |
  21. TABLE 7 Europe Market, by Country, 2025–2035 | |
  22. TABLE 8 Asia Pacific Market, by Country, 2025–2035 | |
  23. TABLE 9 South America Market, by Country, 2025–2035 | |
  24. TABLE 10 Middle East and Africa Market, by Country, 2025–2035 | |
  25. TABLE 11 Global Market, by Type, 2025–2035 | |
  26. TABLE 12 Global Market, by Technology, 2025–2035 | |
  27. TABLE 13 Global Market, by Installation Type, 2025–2035 | |
  28. TABLE 14 Global Market, by End-user Industry, 2025–2035 | |
  29. TABLE 15 Competitive Benchmarking Matrix, 2025 | |
  30. TABLE 16 Report Scope and Methodology | |
  31. TABLE 17 Detailed Sources and Citations | | LIST OF FIGURES | |
  32. FIGURE 1 Market Dynamics Overview — Drivers, Restraints, Opportunities | |
  33. FIGURE 2 Industry Value Chain Analysis | |
  34. FIGURE 3 Porter's Five Forces Analysis | |
  35. FIGURE 4 Global Market Size Trend, 2021–2035 (USD Billion) | |
  36. FIGURE 5 Market Share by Type, 2025 | |
  37. FIGURE 6 Market Share by Technology, 2025 | |
  38. FIGURE 7 Market Share by Installation Type, 2025 | |
  39. FIGURE 8 Market Share by End-user Industry, 2025 | |
  40. FIGURE 9 Regional Market Share, 2025 | |
  41. FIGURE 10 Regional CAGR Comparison, 2026–2035 | |
  42. FIGURE 11 Competitive Positioning Matrix, 2025 | |
  43. FIGURE 12 Estimated Revenue Share Ranges of Key Players, 2025

Segmentation Quick Reference

DimensionSub-SegmentsDominant SegmentFastest Growing Segment
By TypeLiquid, GasLiquid (61.5% share)Liquid (61.5% share)
By TechnologyCoriolis, Differential Pressure, Ultrasonic, Vortex, Thermal, MagneticDifferential Pressure (28.5% share)Ultrasonic (6.55% CAGR)
By Installation TypeInline, Clamp-On, InsertionInline (44.6% share)Clamp-On (6.66% CAGR)
By End-user IndustryOil and Gas, Water and Wastewater, Chemical and Petrochemical, Food and Beverage, Power Generation, Pulp and Paper, Pharmaceuticals, Other IndustriesChemical and Petrochemical (27.8% share)Water and Wastewater (6.64% CAGR)
By RegionNorth America, Europe, Asia Pacific, South America, Middle East and AfricaNorth America (34.6% share)Asia Pacific (6.41% CAGR)


Market Segmentation Overview

By Type

Sub-SegmentKey Trend
LiquidSmart water programs and chemical dosing expand electromagnetic and ultrasonic installs
GasMethane rules and combustion control sustain thermal and ultrasonic demand


Liquid leads with a 61.5% share and also grows faster than Gas, because utility loss-reduction programs and chemical plants buy meters in volume. Electromagnetic designs handle conductive liquids, while ultrasonic units cover slurries and low-conductivity media. Gas grows at a steadier pace, tied to flare, vent, and pipeline measurement under methane regulation.

By Technology

Sub-SegmentKey Trend
CoriolisPremium choice for custody transfer and density measurement
Differential PressureLarge installed base with slow replacement cycles
UltrasonicClamp-on and multipath designs drive retrofit adoption
VortexSteady demand in steam and utility services
ThermalLow-flow gas and flare monitoring applications
MagneticWater utility and pulp slurry workhorse


Differential Pressure dominates with a 28.5% share thanks to decades of installed base and familiar maintenance routines. Ultrasonic grows fastest at a 6.55% CAGR because non-intrusive mounting avoids shutdowns and multipath processing has closed much of the accuracy gap. Coriolis and Magnetic hold strong positions in custody transfer and water service respectively.

By Installation Type

Sub-SegmentKey Trend
InlineEmbedded during greenfield construction for highest accuracy
Clamp-OnNon-intrusive retrofits avoid production outages
InsertionEconomical option for very large pipe diameters


Inline holds the largest share at 44.6%, since new plants specify full-bore meters during construction. Clamp-On grows fastest at a 6.66% CAGR as brownfield operators avoid hot-tapping and secure quicker regulatory approval. Insertion probes keep a cost-driven niche on large municipal and district energy pipes.

By End-user Industry

Sub-SegmentKey Trend
Oil and GasMethane compliance and fiscal metering
Water and WastewaterLoss reduction, AMI rollouts, and reuse mandates
Chemical and PetrochemicalProcess safety rules require continuous verification
Food and BeverageSanitary, CIP-ready meter designs
Power GenerationTurbine efficiency and cooling water control
Pulp and PaperStock and slurry measurement
PharmaceuticalsSingle-use, sterilization-compatible sensors
Other IndustriesSemiconductor ultra-pure water, mining, HVAC


Chemical and Petrochemical leads with a 27.8% share because safety regulations demand continuous flow verification of hazardous media. Water and Wastewater grows fastest at a 6.64% CAGR, driven by non-revenue water targets and reuse obligations. Oil and Gas remains a major revenue pool through methane compliance, while Pharmaceuticals adds high-margin single-use demand.


Download PDF ×

We do not share your information with anyone. However, we may send you emails based on your report interest from time to time. You may contact us at any time to opt-out.