Flexible Packaging Market (2026 - 2035)

ID: MRFR/PCM/0645-CR 150 Pages Sakshi Gupta Last Updated: October 17, 2026
Flexible Packaging Market Research Report Information By Material Type (Plastic, Polyethylene (PE), Biaxially Oriented Polypropylene (BOPP), Cast Polypropylene (CPP), Polyvinyl Chloride (PVC), Ethylene-Vinyl Alcohol (EVOH), Other Flexible Plastic, Paper, Aluminum Foil, and Biodegradable and Compostable Materials), By Product Type (Pouches, Bags and Sacks, Films and Wraps, and Other Product Types), By End-use Industry (Food, Frozen Food, Dairy-Based Products, Meat and Seafood, Baked Snacks and Confectionery, Fresh Produce, Other Food Products, Beverage, Juice and Nectare, Dairy-Based Drinks, Other Beverages, Pharmaceutical, Cosmetics and Personal Care, Industrial, and Other End-Use Industry), and By Distribution Channels (Direct Sales Channel and Indirect Sales Channel) – Forecast Till 2035
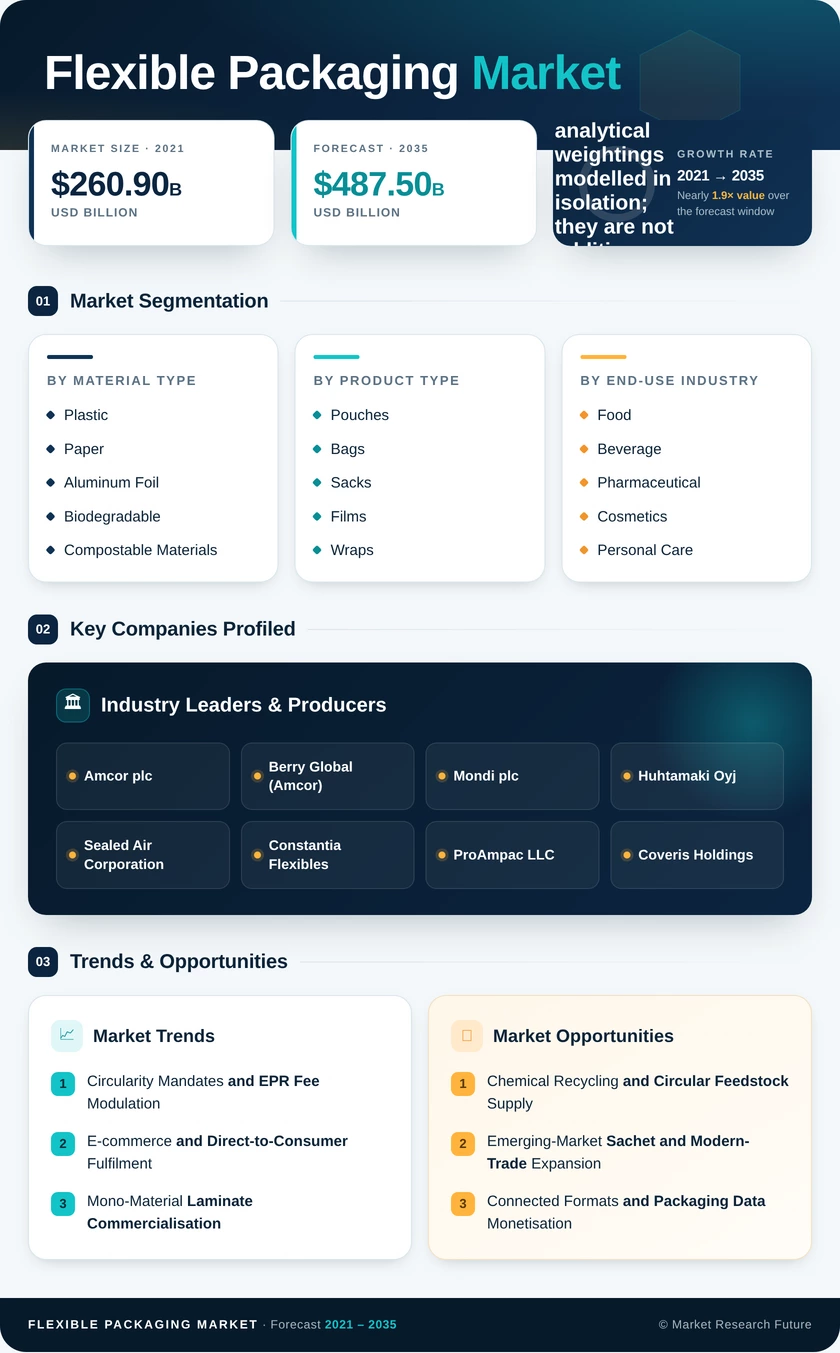
Flexible Packaging Market
Market Size
Forecast Period2026-2035
CAGR (2026-2035)4.5%
2025 Market SizeUSD 313.9 Billion
2035 Market SizeUSD 487.5 Billion
Key Players
Amcor plc
Berry Global
Mondi plc
Huhtamaki Oyj
Sealed Air Corporation
Constantia Flexibles
Opportunities
  • Chemical Recycling and Circular Feedstock Supply
  • Emerging-Market Sachet and Modern-Trade Expansion
  • Connected Formats and Packaging Data Monetisation
  1. 1 Market Summary | |
    1. 1.1 Study Assumptions & Market Definition | |
    2. 1.2 Scope of the Study | |
    3. 1.3 Research Methodology | |
  2. 2 Key Report Takeaways | |
    1. 2.1 By Material Type | |
    2. 2.2 By Product Type | |
    3. 2.3 By End-use Industry | |
    4. 2.4 By Distribution Channels | |
    5. 2.5 By Region | |
  3. 3 Market Size and Forecast (2021–2035) | |
    1. 3.1 Historical Market Size (2021–2025) | |
    2. 3.2 Current & Forecast Market Size (2026–2035) | |
    3. 3.3 Year-over-Year Growth Analysis | |
  4. 4 Driver Impact Analysis | |
    1. 4.1 Circularity Mandates and EPR Fee Modulation | |
    2. 4.2 E-commerce and Direct-to-Consumer Fulfilment | |
    3. 4.3 Mono-Material Laminate Commercialisation | |
    4. 4.4 Digital Printing and Short-Run SKU Proliferation | |
    5. 4.5 Pharmaceutical Cold-Chain Barrier Demand | |
    6. 4.6 Lightweighting and Freight Decarbonisation Economics | |
    7. 4.7 Modern Retail Formalisation in Emerging Economies | |
  5. 5 Restraints Impact Analysis | |
    1. 5.1 Polyolefin Feedstock Price Volatility | |
    2. 5.2 Single-Use Plastic Bans and Consumption Taxes | |
    3. 5.3 Sorting and Recovery Infrastructure Gaps | |
    4. 5.4 Capital Intensity of Converting Line Retooling | |
    5. 5.5 Paperboard and Rigid Substitution in Select Categories | |
  6. 6 Opportunities | |
    1. 6.1 Chemical Recycling and Circular Feedstock Supply | |
    2. 6.2 Emerging-Market Sachet and Modern-Trade Expansion | |
    3. 6.3 Connected Formats and Packaging Data Monetisation | |
    4. 6.4 Pharmaceutical and Cold-Chain Premium Formats | |
    5. 6.5 Compostable Structures for Organics-Diverting Municipalities | |
  7. 7 Regional Market Share and Country-Level Analysis | |
    1. 7.1 North America | | |
      1. 7.1.1 United States | | |
      2. 7.1.2 Canada | | |
      3. 7.1.3 Mexico | |
    2. 7.2 Europe | | |
      1. 7.2.1 United Kingdom | | |
      2. 7.2.2 Germany | | |
      3. 7.2.3 France | | |
      4. 7.2.4 Italy | | |
      5. 7.2.5 Spain | | |
      6. 7.2.6 Nordics | |
    3. 7.3 Asia Pacific | | |
      1. 7.3.1 China | | |
      2. 7.3.2 Japan | | |
      3. 7.3.3 India | | |
      4. 7.3.4 ASEAN | | |
      5. 7.3.5 South Korea | | |
      6. 7.3.6 Australia | | |
      7. 7.3.7 New Zealand | |
    4. 7.4 South America | | |
      1. 7.4.1 Brazil | | |
      2. 7.4.2 Argentina | | |
      3. 7.4.3 Chile | |
    5. 7.5 Middle East and Africa | | |
      1. 7.5.1 Middle East | | |
      2. 7.5.2 United Arab Emirates | | |
      3. 7.5.3 Saudi Arabia | | |
      4. 7.5.4 Turkey | | |
      5. 7.5.5 Rest of Middle East | | |
      6. 7.5.6 Africa | | |
      7. 7.5.7 South Africa | | |
      8. 7.5.8 Kenya | | |
      9. 7.5.9 Rest of Africa | |
  8. 8 Future Outlook (2026–2035) | |
    1. 8.1 Machine Vision and Autonomous Converting Operations | |
    2. 8.2 Circular Material Platforms as a Supply Chain | |
    3. 8.3 Scope 3 Disclosure and Packaging Carbon Accounting | |
    4. 8.4 Regionalisation and Supply Chain Redundancy | |
  9. 9 Segmentation Analysis | |
    1. 9.1 By Material Type | | |
      1. 9.1.1 Plastic | | |
      2. 9.1.2 Paper | | |
      3. 9.1.3 Aluminum Foil | | |
      4. 9.1.4 Biodegradable and Compostable Materials | |
    2. 9.2 By Product Type | | |
      1. 9.2.1 Pouches | | |
      2. 9.2.2 Bags and Sacks | | |
      3. 9.2.3 Films and Wraps | | |
      4. 9.2.4 Other Product Types | |
    3. 9.3 By End-use Industry | | |
      1. 9.3.1 Food | | |
      2. 9.3.2 Beverage | | |
      3. 9.3.3 Pharmaceutical | | |
      4. 9.3.4 Cosmetics and Personal Care | | |
      5. 9.3.5 Industrial | | |
      6. 9.3.6 Other End -Use Industry | |
    4. 9.4 By Distribution Channels | | |
      1. 9.4.1 Direct Sales Channel | | |
      2. 9.4.2 Indirect Sales Channel | |
  10. 10 Competitive Landscape | |
    1. 10.1 Market Concentration Analysis (2026) | |
    2. 10.2 Competitive Benchmarking Matrix | |
    3. 10.3 Company Profiles | |
  11. 11 Recent News & Developments | |
  12. 12 Report Scope and Methodology | |
    1. 12.1 Study Period & Base Year | |
    2. 12.2 Data Sources & Citations | |
    3. 12.3 Abbreviations | |
  13. 13 Detailed Sources and Citations | |
  14. 14 Frequently Asked Questions (FAQs) | | LIST OF TABLES | |
  15. TABLE 1 Global Flexible Packaging Market Size & Forecast, by Revenue (USD Billion), 2021–2035 | |
  16. TABLE 2 Global Flexible Packaging Market — Year-over-Year Growth Analysis, 2021–2035 | |
  17. TABLE 3 Driver Impact Analysis Matrix, 2026–2035 | |
  18. TABLE 4 Restraint Impact Analysis Matrix, 2026–2035 | |
  19. TABLE 5 Global Market Size, by Material Type, 2021–2035 (USD Billion) | |
  20. TABLE 6 Global Market Size, by Product Type, 2021–2035 (USD Billion) | |
  21. TABLE 7 Global Market Size, by End-use Industry, 2021–2035 (USD Billion) | |
  22. TABLE 8 Global Market Size, by Distribution Channels, 2021–2035 (USD Billion) | |
  23. TABLE 9 Global Market Size, by Region, 2021–2035 (USD Billion) | |
  24. TABLE 10 North America Market Size, by Country, 2021–2035 (USD Billion) | |
  25. TABLE 11 Europe Market Size, by Country, 2021–2035 (USD Billion) | |
  26. TABLE 12 Asia Pacific Market Size, by Country, 2021–2035 (USD Billion) | |
  27. TABLE 13 South America Market Size, by Country, 2021–2035 (USD Billion) | |
  28. TABLE 14 Middle East and Africa Market Size, by Country, 2021–2035 (USD Billion) | |
  29. TABLE 15 North America Market Size, by Material Type and Product Type, 2021–2035 (USD Billion) | |
  30. TABLE 16 Europe Market Size, by Material Type and Product Type, 2021–2035 (USD Billion) | |
  31. TABLE 17 Asia Pacific Market Size, by End-use Industry, 2021–2035 (USD Billion) | |
  32. TABLE 18 Middle East and Africa Market Size, by End-use Industry, 2021–2035 (USD Billion) | |
  33. TABLE 19 Competitive Benchmarking Matrix, 2026 | |
  34. TABLE 20 Company Profiles — Key Players | |
  35. TABLE 21 Recent Developments & Strategic Announcements, 2023–2025 | |
  36. TABLE 22 Report Scope & Methodology Summary | |
  37. TABLE 23 Detailed Sources and Citations Index | | LIST OF FIGURES | |
  38. FIGURE 1 Market Dynamics — Drivers, Restraints and Opportunities Overview | |
  39. FIGURE 2 Industry Value Chain Analysis | |
  40. FIGURE 3 Porter's Five Forces Analysis | |
  41. FIGURE 4 Global Market Size Trend and Forecast, 2021–2035 (USD Billion) | |
  42. FIGURE 5 Year-over-Year Growth Trajectory, 2022–2035 (%) | |
  43. FIGURE 6 Market Share by Material Type, 2025 vs 2035 (%) | |
  44. FIGURE 7 Market Share by Product Type, 2025 (%) | |
  45. FIGURE 8 Market Share by End-use Industry, 2025 (%) | |
  46. FIGURE 9 Market Share by Distribution Channels, 2025 (%) | |
  47. FIGURE 10 Regional Revenue Share Distribution, 2025 (%) | |
  48. FIGURE 11 Regional CAGR Comparison, 2026–2035 (%) | |
  49. FIGURE 12 Country-Level Growth Heat Map, 2026–2035 | |
  50. FIGURE 13 Competitive Landscape Positioning Matrix, 2026 | |
  51. FIGURE 14 Top Player Revenue Share Ranges, 2025 (%) | |
  52. FIGURE 15 Fastest-Growing Segment Comparison, 2026–2035

Segmentation Quick Reference

DimensionSub-SegmentsDominant SegmentFastest Growing Segment
By Material TypePlastic; Paper; Aluminum Foil; Biodegradable and Compostable MaterialsPlastic (71.2% share, 2025)Biodegradable and Compostable Materials (7.1% CAGR)
By Product TypePouches; Bags and Sacks; Films and Wraps; Other Product TypesPouches (42.9% share, 2025)Films and Wraps (5.2% CAGR)
By End-use IndustryFood; Beverage; Pharmaceutical; Cosmetics and Personal Care; Industrial; Other End -Use IndustryFood (47.3% share, 2025)Pharmaceutical (6.0% CAGR)
By Distribution ChannelsDirect Sales Channel; Indirect Sales ChannelDirect Sales Channel (60.6% share, 2025)Indirect Sales Channel (5.4% CAGR)


Market Segmentation Overview

By Material Type

Sub-SegmentKey Trend
PlasticMachine-direction-oriented PE and CPP structures replacing PET-PE hybrids to meet design-for-recycling grades
PaperFunctional coatings extend fibre laminates into moderate-moisture categories previously closed to them.
Aluminum FoilRetreating to aseptic and pharmaceutical duties where oxygen transmission must approach zero
Biodegradable and Compostable MaterialsPLA and PHA coextrusions scaling alongside municipal organic waste collection expansion


Plastic holds the leading position because Polyethylene and Cast Polypropylene deliver seal integrity and moisture barrier at costs no substitute currently matches, and mono-material redesign has let those resins retain applications that recyclability rules threatened. Biodegradable and Compostable Materials grow fastest, at 7.1% annually, because certified structures are the only option that performs correctly where kerbside organics collection exists. Aluminum Foil and Paper occupy complementary technical niches rather than contesting the same specifications.

By Product Type

Sub-SegmentKey Trend
PouchesStand-up, spouted and retort variants continue displacing glass jars, cans and rigid tubs.
Bags and SacksSteady industrial, agricultural and pet-nutrition demand largely insulated from consumer trend cycles.
Films and WrapsSilicon-oxide and nanoclay coatings substitute aluminium layers while gauges thin further
Other Product TypesSachets and stick packs penetrating single-serve nutraceuticals and instant beverage categories


Pouches lead this dimension at 42.9% of 2025 revenue because their weight advantage over rigid alternatives converts directly into freight and emissions savings that brand owners now report under Scope 3 rules. Films and Wraps expand fastest at 5.2% annually as coated barrier technology lets converters strip out aluminium tie layers, improving near-infrared sortability without losing puncture resistance. Bags and Sacks remain a stable volume anchor rather than a growth driver.

By End-use Industry

Sub-SegmentKey Trend
FoodResealable closures and antifog structures aligned to portion control and waste reduction
BeverageAseptic and spouted formats expanding ambient shelf life for juices and dairy drinks
PharmaceuticalUnit-dose blisters and cryogenic-rated laminates serving biologics distribution
Cosmetics and Personal CareRefill formats and dielectric embossing delivering tactile finishes without lamination
IndustrialChemically resistant liners and hazard-certified transport structures
Other End -Use IndustryAgricultural inputs, tobacco and consumer durables absorbing residual demand


Food dominates at 47.3% of revenue, sustained by bakery, dairy and protein volumes where shelf-life extension has measurable waste-reduction value. Pharmaceutical grows fastest at 6.0% annually because biologics and personalised medicines demand barrier performance an order of magnitude tighter than grocery, and because 18–30 month qualification cycles lock in suppliers once approved. Cosmetics and Personal Care follows as the secondary growth vertical through refill formats, while Industrial contributes steady certified-liner demand.

By Distribution Channels

Sub-SegmentKey Trend
Direct Sales ChannelMulti-year co-development contracts covering structure design, machine trials and regulatory documentation
Indirect Sales ChannelDistributors and stock-structure platforms serving SMEs, contract manufacturers and e-commerce sellers


Direct Sales Channel commands 60.6% of 2025 revenue because qualifying a barrier structure requires sustained technical collaboration — trial runs on the customer's filling line, migration testing, and regulatory file preparation — that a distributor cannot provide. Indirect Sales Channel nonetheless grows faster at 5.4% annually, since digital printing has eliminated the plate-cost minimums that once made small orders uneconomic, opening a viable route for regional processors and online sellers.




Download PDF ×

We do not share your information with anyone. However, we may send you emails based on your report interest from time to time. You may contact us at any time to opt-out.