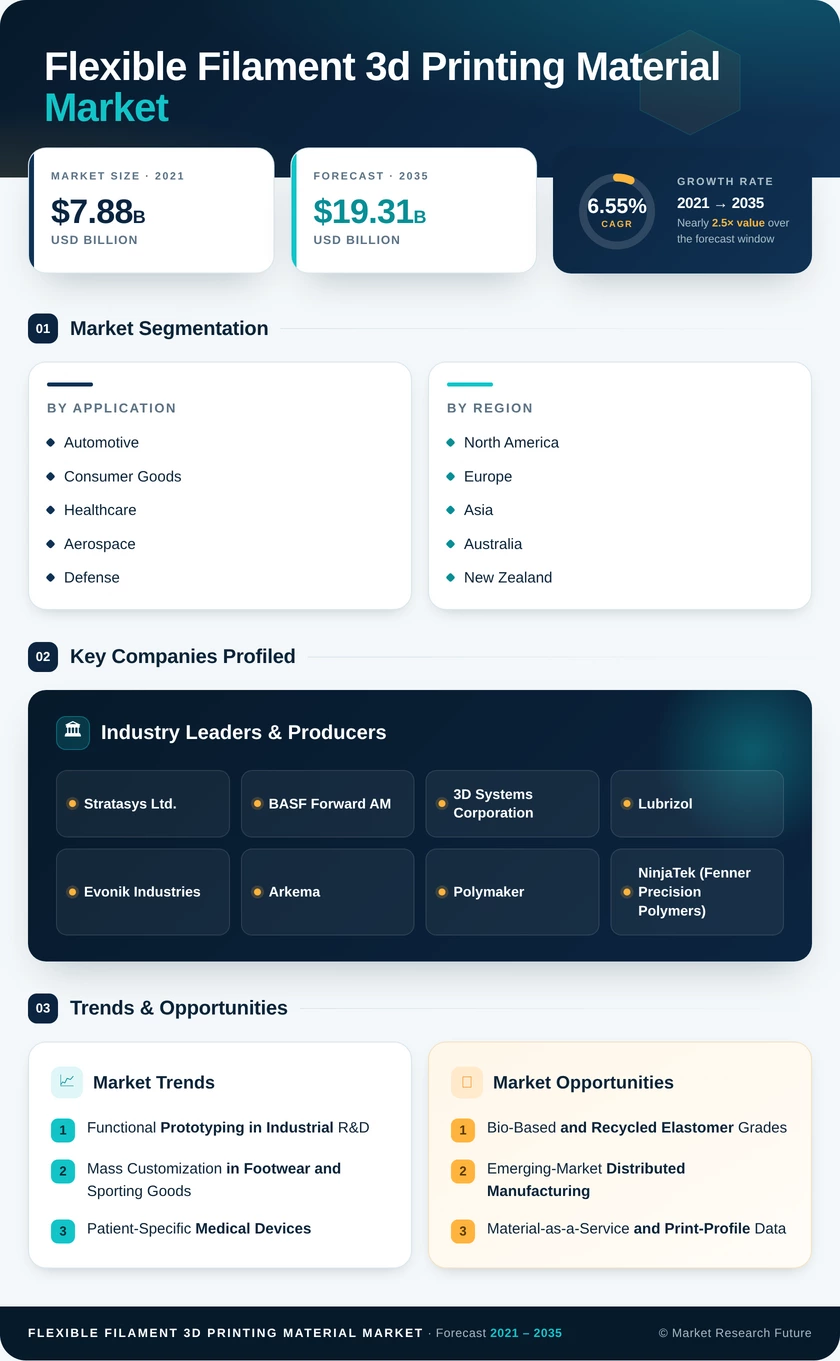
Flexible Filament 3D Printing Material Market (2026 – 2035)

ID: MRFR/SEM/40835-HCR 111 Pages Aarti Dhapte Last Updated: October 05, 2026
Flexible Filament 3D Printing Material Market Size, Share and Research Report By Application (Automotive, Consumer Goods, Healthcare, Aerospace and Defense, and Others) And By Region (North America, Europe, Asia-Pacific, And Rest Of The World) – Industry Forecast Till 2035
Flexible Filament 3D Printing Material Market
Market Size
Forecast Period2026-2035
CAGR (2026-2035)6.55%
2025 Market SizeUSD 10.24 Billion
2035 Market SizeUSD 19.31 Billion
Key Players
Stratasys Ltd.
BASF Forward AM
3D Systems Corporation
Lubrizol
Evonik Industries
Arkema
Opportunities
  • Bio-Based and Recycled Elastomer Grades
  • Emerging-Market Distributed Manufacturing
  • Material-as-a-Service and Print-Profile Data
  1. 1 Market Summary | |
  2. 2 Key Report Takeaways | |
    1. 2.1 By Application | |
    2. 2.2 By Region | |
  3. 3 Market Size and Forecast (2021–2035) | |
  4. 4 Driver Impact Analysis | |
    1. 4.1 Functional Prototyping in Industrial R&D | |
    2. 4.2 Mass Customization in Footwear and Sporting Goods | |
    3. 4.3 Patient-Specific Medical Devices | |
    4. 4.4 Automotive Lightweighting, Tooling, and Spares | |
    5. 4.5 Direct-Drive Desktop Printer Installed Base | |
    6. 4.6 National Additive Manufacturing Policies | |
  5. 5 Restraints Impact Analysis | |
    1. 5.1 Process Sensitivity of Low-Shore Grades | |
    2. 5.2 Polyurethane Feedstock Price Volatility | |
    3. 5.3 Limited Material Standards for Regulated Sectors | |
    4. 5.4 Competition from Resin and Powder Elastomers | |
    5. 5.5 End-of-Life and Recycling Constraints | |
  6. 6 Opportunities | |
    1. 6.1 Bio-Based and Recycled Elastomer Grades | |
    2. 6.2 Emerging-Market Distributed Manufacturing | |
    3. 6.3 Material-as-a-Service and Print-Profile Data | |
    4. 6.4 Point-of-Care Orthotics and Wearables | |
    5. 6.5 Multi-Material Rigid-Flexible Parts | |
  7. 7 Regional Market Share and Country-Level Analysis | |
    1. 7.1 North America | | |
      1. 7.1.1 US | | |
      2. 7.1.2 Canada | | |
      3. 7.1.3 Mexico | |
    2. 7.2 Europe | | |
      1. 7.2.1 Germany | | |
      2. 7.2.2 UK | | |
      3. 7.2.3 France | | |
      4. 7.2.4 Italy | | |
      5. 7.2.5 Spain | | |
      6. 7.2.6 Nordic Countries | | |
      7. 7.2.7 Russia | | |
      8. 7.2.8 Rest of Europe | |
    3. 7.3 Asia | | |
      1. 7.3.1 China | | |
      2. 7.3.2 India | | |
      3. 7.3.3 Japan | | |
      4. 7.3.4 South Korea | | |
      5. 7.3.5 ASEAN | | |
      6. 7.3.6 Rest of Asia | |
    4. 7.4 Australia and New Zealand | | |
      1. 7.4.1 Australia | | |
      2. 7.4.2 New Zealand | |
    5. 7.5 Latin America | | |
      1. 7.5.1 Brazil | | |
      2. 7.5.2 Argentina | | |
      3. 7.5.3 Rest of Latin America | |
    6. 7.6 Middle East and Africa | | |
      1. 7.6.1 Saudi Arabia | | |
      2. 7.6.2 UAE | | |
      3. 7.6.3 South Africa | | |
      4. 7.6.4 Egypt | | |
      5. 7.6.5 Rest of Middle East and Africa | |
  8. 8 Future Outlook (2026–2035) | |
    1. 8.1 AI-Assisted Print Parameter Optimization | |
    2. 8.2 Circular Materials and Sustainability Reporting | |
    3. 8.3 Vehicle Electrification | |
    4. 8.4 Regionalized Supply Chains | |
  9. 9 Segmentation Analysis | |
    1. 9.1 By Application | | |
      1. 9.1.1 Automotive | | |
      2. 9.1.2 Consumer Goods | | |
      3. 9.1.3 Healthcare | | |
      4. 9.1.4 Aerospace and Defense | | |
      5. 9.1.5 Others | |
  10. 10 Competitive Landscape | |
  11. 11 Recent News & Developments | |
  12. 12 Report Scope and Methodology | |
  13. 13 Detailed Sources and Citations | |
  14. 14 Frequently Asked Questions (FAQs) | | LIST OF TABLES | |
  15. TABLE 1 Report Snapshot — Key Market Metrics, 2025–2035 | |
  16. TABLE 2 Global Market Size & Forecast, by Revenue (USD Billion), 2021–2035 | |
  17. TABLE 3 Driver Impact Analysis, 2026–2035 | |
  18. TABLE 4 Restraints Impact Analysis, 2026–2035 | |
  19. TABLE 5 Regional Summary, by Region, 2025–2035 (USD Billion) | |
  20. TABLE 6 North America Market, by Country, 2025–2035 (USD Billion) | |
  21. TABLE 7 Europe Market, by Country, 2025–2035 (USD Billion) | |
  22. TABLE 8 Asia Market, by Country, 2025–2035 (USD Billion) | |
  23. TABLE 9 Australia and New Zealand Market, by Country, 2025–2035 (USD Billion) | |
  24. TABLE 10 Latin America Market, by Country, 2025–2035 (USD Billion) | |
  25. TABLE 11 Middle East and Africa Market, by Country, 2025–2035 (USD Billion) | |
  26. TABLE 12 Global Market, by Application, 2025–2035 (USD Billion) | |
  27. TABLE 13 Competitive Benchmarking Matrix, 2025 | |
  28. TABLE 14 Report Scope and Methodology | |
  29. TABLE 15 Detailed Sources and Citations | |
  30. TABLE 16 Segmentation Quick Reference | | LIST OF FIGURES | |
  31. FIGURE 1 Market Dynamics — Drivers, Restraints, and Opportunities | |
  32. FIGURE 2 Industry Value Chain Analysis | |
  33. FIGURE 3 Porter's Five Forces Analysis | |
  34. FIGURE 4 Global Market Size Trend, 2021–2035 (USD Billion) | |
  35. FIGURE 5 Year-over-Year Growth Rate, 2021–2035 | |
  36. FIGURE 6 Market Share, by Application, 2025 | |
  37. FIGURE 7 Market Share, by Region, 2025 | |
  38. FIGURE 8 Regional CAGR Comparison, 2026–2035 | |
  39. FIGURE 9 Competitive Landscape — Estimated Revenue Share Ranges, 2025

Segmentation Quick Reference

DimensionSub-SegmentsDominant SegmentFastest Growing Segment
By ApplicationAutomotive, Consumer Goods, Healthcare, Aerospace and Defense, OthersAutomotive (29.5% share)Healthcare (7.9% CAGR)
By RegionNorth America, Europe, Asia, Australia and New Zealand, Latin America, Middle East and AfricaAsia (41.0% share)Asia (41.0% share; highest regional CAGR)


Market Segmentation Overview

By Application

Sub-SegmentKey Trend
AutomotiveEV platform prototyping and in-plant soft tooling
Consumer GoodsPrinted footwear midsoles and customized wearables
HealthcarePoint-of-care orthotics and prosthetic liners
Aerospace and DefenseCertified seals and sustainment spares for aging fleets
OthersEducation, robotics, and maintenance consumables


Automotive leads at 29.5% because EV programs and plant tooling generate steady, repeat demand for printed seals, grommets, and fixture covers. Healthcare grows fastest at a 7.9% CAGR, as orthotics labs and hospitals adopt biocompatibility-documented grades under clearer regulatory pathways. Consumer Goods sits between the two, with footwear customization keeping the Flexible Filament 3D Printing Material Market closely tied to sportswear product cycles.


 

Download PDF ×

We do not share your information with anyone. However, we may send you emails based on your report interest from time to time. You may contact us at any time to opt-out.