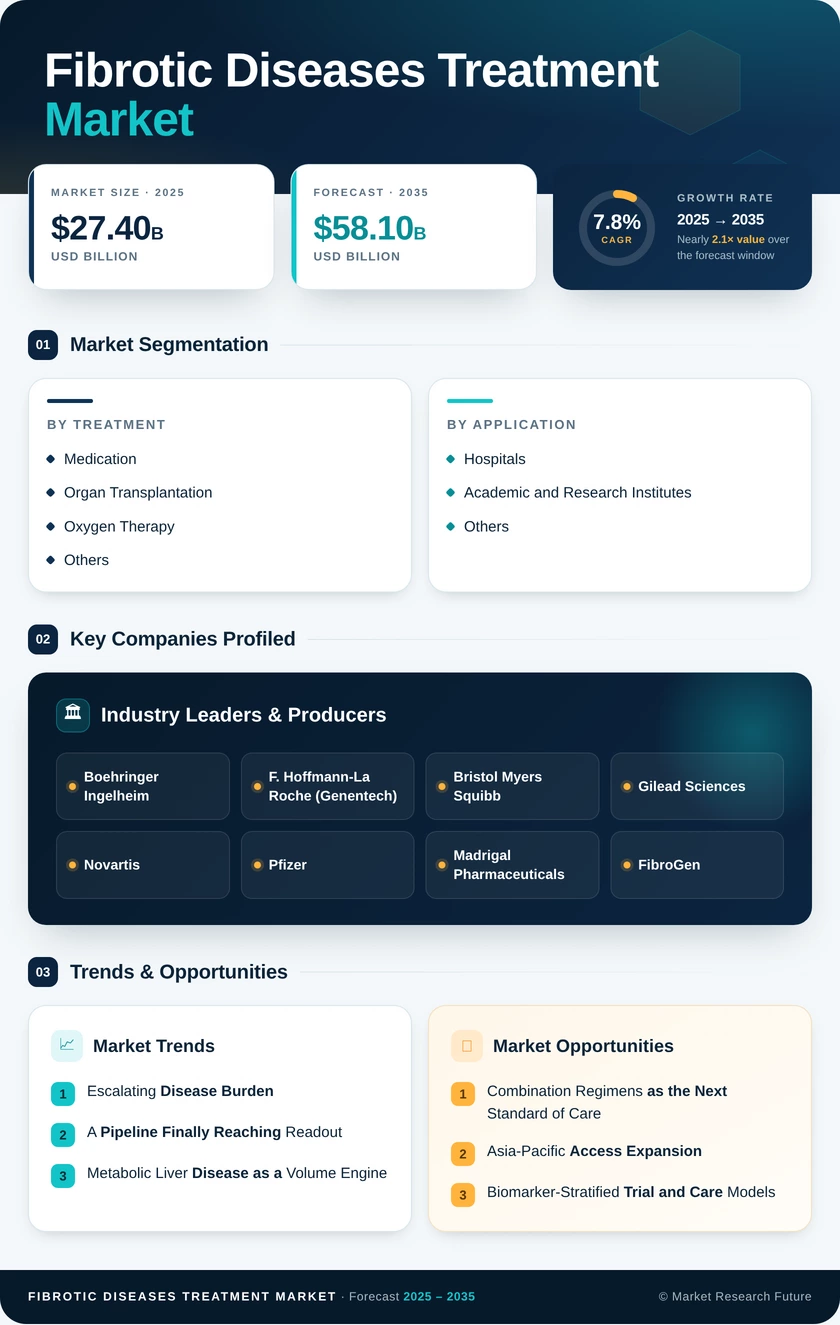
Fibrotic Diseases Treatment Market (2026 - 2035)

ID: MRFR/HC/35100-HCR 100 Pages Satyendra Maurya Last Updated: September 17, 2026
Fibrotic Diseases Treatment Market Research Report By Disease Type (Pulmonary Fibrosis, Liver Fibrosis, Cardiac Fibrosis, Renal Fibrosis), By Treatment Type (Antifibrotic Agents, Immunomodulators, Corticosteroids, Enzyme Replacement Therapy), By Route of Administration (Oral, Injectable, Intravenous), By End User (Hospitals, Specialized Clinics, Homecare Settings) and By Regional (North America, Europe, South America, Asia Pacific, Middle East and Africa) - Forecast to 2035
Fibrotic Diseases Treatment Market
Market Size
Forecast Period2026-2035
CAGR (2026-2035)7.8%
2025 Market SizeUSD 27.4 Billion
2035 Market SizeUSD 58.1 Billion
Key Players
Boehringer Ingelheim
F. Hoffmann-La Roche
Bristol Myers Squibb
Gilead Sciences
Novartis
Pfizer
Opportunities
  • Combination Regimens as the Next Standard of Care
  • Asia-Pacific Access Expansion
  • Biomarker-Stratified Trial and Care Models
  1. 1 Market Summary |
    1. 1.1 Study Assumptions & Market Definition |
    2. 1.2 Scope of the Study |
    3. 1.3 Research Methodology
  2. 2 Key Report Takeaways |
    1. 2.1 By Treatment |
    2. 2.2 By Application |
    3. 2.3 By Geography
  3. 3 Market Size & Forecast (2021–2035) |
    1. 3.1 Historical Market Size (2021–2024) |
    2. 3.2 Base Year Assessment (2025) |
    3. 3.3 Forecast Market Size (2026–2035) |
    4. 3.4 Year-over-Year Growth Analysis
  4. 4 Driver Impact Analysis |
    1. 4.1 Escalating Disease Burden |
    2. 4.2 A Pipeline Finally Reaching Readout |
    3. 4.3 Metabolic Liver Disease as a Volume Engine |
    4. 4.4 Diagnostics Pulling Demand Forward
  5. 5 Restraints Impact Analysis |
    1. 5.1 Cost and Reimbursement Friction |
    2. 5.2 Attrition in Late-Stage Development |
    3. 5.3 Tolerability and Real-World Persistence
  6. 6 Opportunities |
    1. 6.1 Combination Regimens as the Next Standard of Care |
    2. 6.2 Asia-Pacific Access Expansion |
    3. 6.3 Biomarker-Stratified Trial and Care Models |
    4. 6.4 Real-World Data and Registry Monetization |
    5. 6.5 Underserved Fibrosis Indications
  7. 7 Regional Market Share & Country-Level Analysis |
    1. 7.1 North America | |
      1. 7.1.1 US | |
      2. 7.1.2 Canada | |
      3. 7.1.3 Mexico |
    2. 7.2 Europe | |
      1. 7.2.1 Germany | |
      2. 7.2.2 UK | |
      3. 7.2.3 France | |
      4. 7.2.4 Italy | |
      5. 7.2.5 Spain | |
      6. 7.2.6 Nordic Countries | |
      7. 7.2.7 Russia | |
      8. 7.2.8 Rest of Europe |
    3. 7.3 Asia-Pacific | |
      1. 7.3.1 China | |
      2. 7.3.2 India | |
      3. 7.3.3 Japan | |
      4. 7.3.4 South Korea | |
      5. 7.3.5 ASEAN | |
      6. 7.3.6 Rest of Asia-Pacific |
    4. 7.4 South America | |
      1. 7.4.1 Brazil | |
      2. 7.4.2 Argentina | |
      3. 7.4.3 Rest of South America |
    5. 7.5 Middle East & Africa | |
      1. 7.5.1 Saudi Arabia | |
      2. 7.5.2 UAE | |
      3. 7.5.3 South Africa | |
      4. 7.5.4 Egypt | |
      5. 7.5.5 Rest of Middle East & Africa
  8. 8 Future Outlook (2026–2035) |
    1. 8.1 Machine Learning in Fibrosis Staging |
    2. 8.2 Outcomes-Linked Contracting |
    3. 8.3 Precision Medicine Displacing One-Size-Fits-All |
    4. 8.4 Regenerative and Reversal Approaches
  9. 9 Market Segmentation Analysis |
    1. 9.1 By Treatment | |
      1. 9.1.1 Medication | |
      2. 9.1.2 Organ Transplantation | |
      3. 9.1.3 Oxygen Therapy | |
      4. 9.1.4 Others |
    2. 9.2 By Application | |
      1. 9.2.1 Idiopathic Pulmonary Fibrosis | |
      2. 9.2.2 Hepatic Cirrhosis | |
      3. 9.2.3 Renal Fibrosis | |
      4. 9.2.4 Cutaneous Fibrosis | |
      5. 9.2.5 Others |
    3. 9.3 By End User | |
      1. 9.3.1 Hospitals | |
      2. 9.3.2 Academic and Research Institutes | |
      3. 9.3.3 Others
  10. 10 Competitive Landscape |
    1. 10.1 Market Concentration Analysis (2026) |
    2. 10.2 Competitive Benchmarking Matrix |
    3. 10.3 Company Profiles | |
      1. 10.3.1 Boehringer Ingelheim | |
      2. 10.3.2 F. Hoffmann-La Roche | |
      3. 10.3.3 Bristol Myers Squibb | |
      4. 10.3.4 Gilead Sciences | |
      5. 10.3.5 Novartis | |
      6. 10.3.6 Pfizer | |
      7. 10.3.7 Madrigal Pharmaceuticals | |
      8. 10.3.8 FibroGen | |
      9. 10.3.9 Galapagos NV | |
      10. 10.3.10 Sanofi | |
      11. 10.3.11 Merck KGaA | |
      12. 10.3.12 United Therapeutics
  11. 11 Recent News & Developments
  12. 12 Report Scope & Methodology |
    1. 12.1 Study Period & Base Year |
    2. 12.2 Data Sources & Triangulation |
    3. 12.3 Abbreviations
  13. 13 Detailed Sources & Citations
  14. 14 Frequently Asked Questions
  15. 15 LIST OF TABLES |
  16. TABLE 1 Global Fibrotic Diseases Treatment Market Size & Forecast, by Revenue (USD Billion), 2021–2035 |
  17. TABLE 2 Global Fibrotic Diseases Treatment Market – Year-over-Year Growth Analysis, 2021–2035 |
  18. TABLE 3 Driver Impact Analysis Matrix, 2026–2035 |
  19. TABLE 4 Restraint Impact Analysis Matrix, 2026–2035 |
  20. TABLE 5 Global Market Size, by Treatment, 2021–2035 (USD Billion) |
  21. TABLE 6 Global Market Size, by Application, 2021–2035 (USD Billion) |
  22. TABLE 7 Global Market Size, by End User, 2021–2035 (USD Billion) |
  23. TABLE 8 Global Market Size, by Region, 2021–2035 (USD Billion) |
  24. TABLE 9 North America Market Size, by Country, 2021–2035 (USD Billion) |
  25. TABLE 10 Europe Market Size, by Country, 2021–2035 (USD Billion) |
  26. TABLE 11 Asia-Pacific Market Size, by Country, 2021–2035 (USD Billion) |
  27. TABLE 12 South America Market Size, by Country, 2021–2035 (USD Billion) |
  28. TABLE 13 Middle East & Africa Market Size, by Country, 2021–2035 (USD Billion) |
  29. TABLE 14 North America Market Size, by Treatment, 2021–2035 (USD Billion) |
  30. TABLE 15 North America Market Size, by Application, 2021–2035 (USD Billion) |
  31. TABLE 16 North America Market Size, by End User, 2021–2035 (USD Billion) |
  32. TABLE 17 Europe Market Size, by Treatment, 2021–2035 (USD Billion) |
  33. TABLE 18 Europe Market Size, by Application, 2021–2035 (USD Billion) |
  34. TABLE 19 Europe Market Size, by End User, 2021–2035 (USD Billion) |
  35. TABLE 20 Asia-Pacific Market Size, by Treatment, 2021–2035 (USD Billion) |
  36. TABLE 21 Asia-Pacific Market Size, by Application, 2021–2035 (USD Billion) |
  37. TABLE 22 Asia-Pacific Market Size, by End User, 2021–2035 (USD Billion) |
  38. TABLE 23 South America Market Size, by Treatment, 2021–2035 (USD Billion) |
  39. TABLE 24 South America Market Size, by Application, 2021–2035 (USD Billion) |
  40. TABLE 25 South America Market Size, by End User, 2021–2035 (USD Billion) |
  41. TABLE 26 Middle East & Africa Market Size, by Treatment, 2021–2035 (USD Billion) |
  42. TABLE 27 Middle East & Africa Market Size, by Application, 2021–2035 (USD Billion) |
  43. TABLE 28 Middle East & Africa Market Size, by End User, 2021–2035 (USD Billion) |
  44. TABLE 29 US Market Size, by Application, 2021–2035 (USD Billion) |
  45. TABLE 30 Germany Market Size, by Application, 2021–2035 (USD Billion) |
  46. TABLE 31 China Market Size, by Application, 2021–2035 (USD Billion) |
  47. TABLE 32 Japan Market Size, by Application, 2021–2035 (USD Billion) |
  48. TABLE 33 Brazil Market Size, by Application, 2021–2035 (USD Billion) |
  49. TABLE 34 Saudi Arabia Market Size, by Application, 2021–2035 (USD Billion) |
  50. TABLE 35 Competitive Benchmarking Matrix, 2026 |
  51. TABLE 36 Company Profiles – Key Players |
  52. TABLE 37 Recent Developments & Strategic Announcements, 2023–2025 |
  53. TABLE 38 Report Scope & Methodology Summary |
  54. TABLE 39 Detailed Sources & Citations Index
  55. 16 LIST OF FIGURES |
  56. FIGURE 1 Global Market Dynamics – Drivers, Restraints & Opportunities Snapshot |
  57. FIGURE 2 Industry Value Chain Analysis – Discovery to Patient Delivery |
  58. FIGURE 3 Porter's Five Forces Analysis |
  59. FIGURE 4 Global Market Size Trend, 2021–2035 (USD Billion) |
  60. FIGURE 5 Year-over-Year Growth Trajectory, 2022–2035 (%) |
  61. FIGURE 6 Market Share by Treatment, 2025 vs 2035 (%) |
  62. FIGURE 7 Market Share by Application, 2025 vs 2035 (%) |
  63. FIGURE 8 Market Share by End User, 2025 vs 2035 (%) |
  64. FIGURE 9 Regional Market Share Distribution, 2025 (%) |
  65. FIGURE 10 Regional CAGR Comparison, 2026–2035 (%) |
  66. FIGURE 11 North America Country-Level Share, 2025 (%) |
  67. FIGURE 12 Europe Country-Level Share, 2025 (%) |
  68. FIGURE 13 Asia-Pacific Country-Level Share, 2025 (%) |
  69. FIGURE 14 Competitive Landscape – Estimated Revenue Share Bands, 2026 |
  70. FIGURE 15 Clinical Pipeline Distribution by Phase and Indication |
  71. FIGURE 16 Strategic Positioning Matrix – Scale vs Pipeline Depth

Segmentation Quick Reference

DimensionSub-SegmentsDominant SegmentFastest Growing Segment
By TreatmentMedication; Organ Transplantation; Oxygen Therapy; OthersMedicationMedication
By ApplicationIdiopathic Pulmonary Fibrosis; Hepatic Cirrhosis; Renal Fibrosis; Cutaneous Fibrosis; OthersIdiopathic Pulmonary FibrosisRenal Fibrosis
By End UserHospitals; Academic and Research Institutes; OthersHospitalsOthers
By GeographyNorth America; Europe; Asia-Pacific; South America; Middle East & AfricaNorth AmericaAsia-Pacific


Market Segmentation Overview

By Treatment

Sub-SegmentKey Trend
MedicationMechanism-targeted oral agents displacing broad immunosuppression; combination regimens entering Phase II
Organ TransplantationMachine perfusion and expanded donor criteria lifting usable organ yield despite persistent scarcity
Oxygen TherapyPortable concentrators shifting supportive care from institutional to home settings
OthersPulmonary rehabilitation and palliative protocols formalized into guideline pathways


Treatment economics tilt decisively toward pharmacology. Drug-based intervention captures the majority of spend and nearly all of the incremental growth, while transplantation grows on procedural cost rather than case volume and supportive modalities compete increasingly on convenience.

By Application

Sub-SegmentKey Trend
Idiopathic Pulmonary FibrosisTwo established standards of care; first new mechanism in a decade approaching approval
Hepatic CirrhosisMetabolic disease screening cascades creating a large newly treatable population
Renal FibrosisFastest-growing indication with minimal approved targeted therapy and high pipeline sensitivity
Cutaneous FibrosisSystemic sclerosis and keloid management benefiting from orphan designation pathways
OthersCardiac and retroperitoneal fibrosis emerging as early-stage research priorities


Application mix is rebalancing away from a single dominant indication. Pulmonary disease still leads on revenue, but hepatic screening infrastructure and renal pipeline activity are steadily widening the commercial base beyond respiratory medicine.

By End User

Sub-SegmentKey Trend
HospitalsMultidisciplinary review boards and specialist initiation protocols concentrating early treatment decisions
Academic and Research InstitutesDual role as tertiary referral centres and sponsor-funded trial sites
OthersSpecialty clinics and home-based monitoring expanding on remote spirometry and telehealth adoption


Care settings are decentralizing slowly. Hospitals retain control of diagnosis and initiation because staging requires specialist infrastructure, yet maintenance therapy is migrating outward as oral regimens mature and remote monitoring proves reliable.




Download PDF ×

We do not share your information with anyone. However, we may send you emails based on your report interest from time to time. You may contact us at any time to opt-out.