Fermented Drinks Market Segmentation
Fermented Drinks Market By Source (USD Billion, 2025-2035)
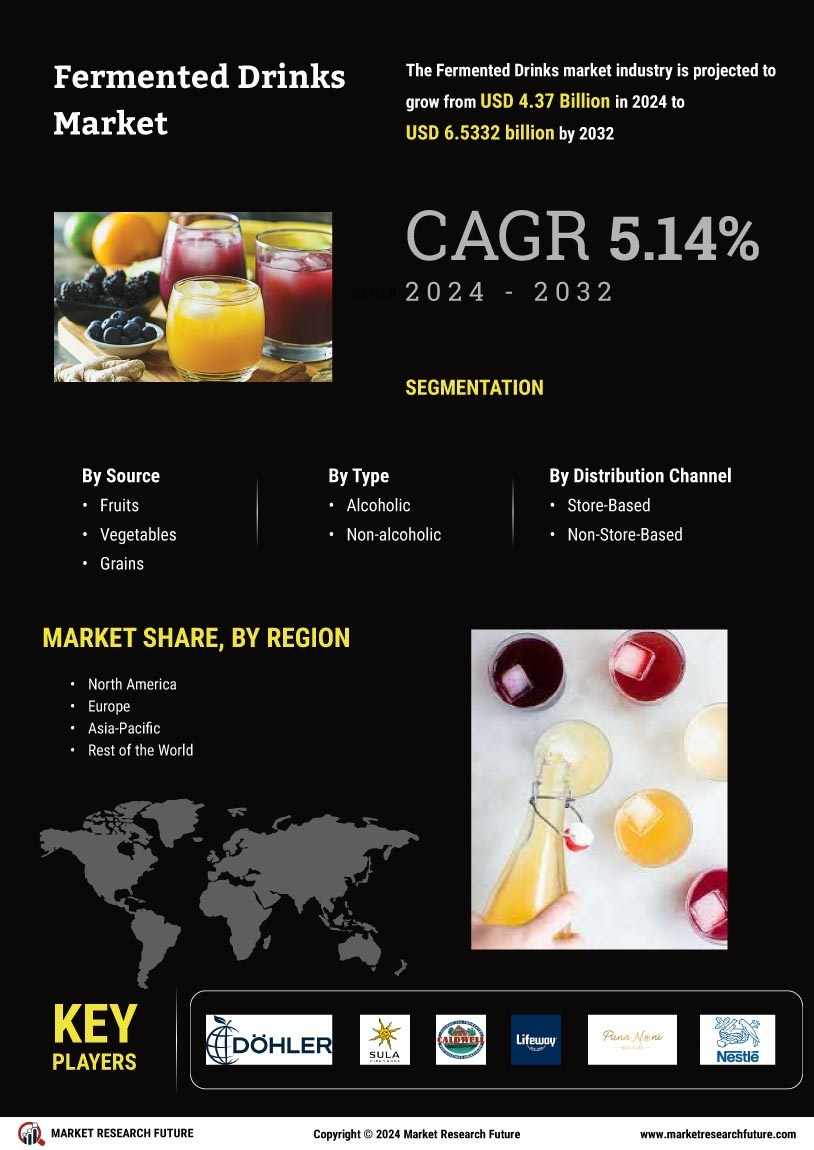
- Fruits
- Vegetables
- Grains
- Milk
- Others
Fermented Drinks Market By Type (USD Billion, 2025-2035)
- Alcoholic
- Non-alcoholic
Fermented Drinks Market By Distribution Channel (USD Billion, 2025-2035)
- Store-Based
- Non-Store-Based