Request Free Sample ×

Kindly complete the form below to receive a free sample of this Report

* Please use a valid business email

Leading companies partner with us for data-driven Insights

clients tt-cursor
Hero Background

Facility Management Services Market

ID: MRFR/ICT/4496-CR
200 Pages
Nirmit Biswas
Last Updated: April 24, 2026

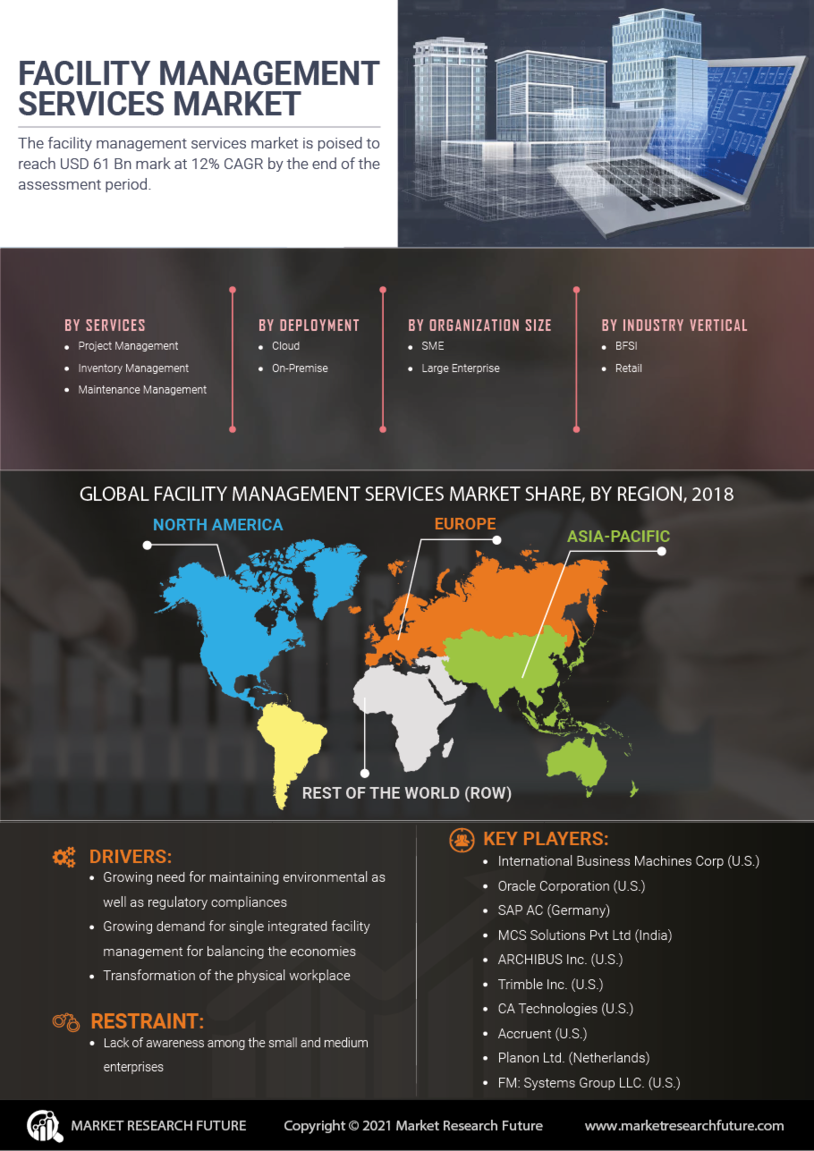
Facility Management Services Market Size, Share and Trends Analysis Report By Service Type (Cleaning Services, Security Services, Maintenance Services, Catering Services, Integrated Facility Management), By End User (Commercial, Residential, Industrial, Healthcare, Educational), By Solution Type (Hard Services, Soft Services, Technical Services), By Delivery Mode (In-House, Outsourced, Hybrid) and By Regional (North America, Europe, South America, Asia Pacific, Middle East and Africa) - Forecast to 2035

Share:
Download PDF ×

We do not share your information with anyone. However, we may send you emails based on your report interest from time to time. You may contact us at any time to opt-out.

Facility Management Services Market Infographic
Purchase Options
  1. SECTION I: EXECUTIVE SUMMARY AND KEY HIGHLIGHTS
    1. 1.1 EXECUTIVE SUMMARY
      1. 1.1.1 Market Overview
      2. 1.1.2 Key Findings
      3. 1.1.3 Market Segmentation
      4. 1.1.4 Competitive Landscape
      5. 1.1.5 Challenges and Opportunities
      6. 1.1.6 Future Outlook 2
  2. SECTION II: SCOPING, METHODOLOGY AND MARKET STRUCTURE
    1. 2.1 MARKET INTRODUCTION
      1. 2.1.1 Definition
      2. 2.1.2 Scope of the study
        1. 2.1.2.1 Research Objective
        2. 2.1.2.2 Assumption
        3. 2.1.2.3 Limitations
    2. 2.2 RESEARCH METHODOLOGY
      1. 2.2.1 Overview
      2. 2.2.2 Data Mining
      3. 2.2.3 Secondary Research
      4. 2.2.4 Primary Research
        1. 2.2.4.1 Primary Interviews and Information Gathering Process
        2. 2.2.4.2 Breakdown of Primary Respondents
      5. 2.2.5 Forecasting Model
      6. 2.2.6 Market Size Estimation
        1. 2.2.6.1 Bottom-Up Approach
        2. 2.2.6.2 Top-Down Approach
      7. 2.2.7 Data Triangulation
      8. 2.2.8 Validation 3
  3. SECTION III: QUALITATIVE ANALYSIS
    1. 3.1 MARKET DYNAMICS
      1. 3.1.1 Overview
      2. 3.1.2 Drivers
      3. 3.1.3 Restraints
      4. 3.1.4 Opportunities
    2. 3.2 MARKET FACTOR ANALYSIS
      1. 3.2.1 Value chain Analysis
      2. 3.2.2 Porter's Five Forces Analysis
        1. 3.2.2.1 Bargaining Power of Suppliers
        2. 3.2.2.2 Bargaining Power of Buyers
        3. 3.2.2.3 Threat of New Entrants
        4. 3.2.2.4 Threat of Substitutes
        5. 3.2.2.5 Intensity of Rivalry
      3. 3.2.3 COVID-19 Impact Analysis
        1. 3.2.3.1 Market Impact Analysis
        2. 3.2.3.2 Regional Impact
        3. 3.2.3.3 Opportunity and Threat Analysis 4
  4. SECTION IV: QUANTITATIVE ANALYSIS
    1. 4.1 Facility Management Services Market, BY Application (USD Billion)
      1. 4.1.1 Commercial
      2. 4.1.2 Residential
      3. 4.1.3 Industrial
      4. 4.1.4 Institutional
    2. 4.2 Facility Management Services Market, BY Service Type (USD Billion)
      1. 4.2.1 Cleaning Services
      2. 4.2.2 Security Services
      3. 4.2.3 Maintenance Services
      4. 4.2.4 Support Services
    3. 4.3 Facility Management Services Market, BY End Use (USD Billion)
      1. 4.3.1 Healthcare
      2. 4.3.2 Education
      3. 4.3.3 Retail
      4. 4.3.4 Hospitality
    4. 4.4 Facility Management Services Market, BY Facility Type (USD Billion)
      1. 4.4.1 Office Buildings
      2. 4.4.2 Manufacturing Facilities
      3. 4.4.3 Shopping Malls
      4. 4.4.4 Educational Institutions
    5. 4.5 Facility Management Services Market, BY Region (USD Billion)
      1. 4.5.1 North America
        1. 4.5.1.1 US
        2. 4.5.1.2 Canada
      2. 4.5.2 Europe
        1. 4.5.2.1 Germany
        2. 4.5.2.2 UK
        3. 4.5.2.3 France
        4. 4.5.2.4 Russia
        5. 4.5.2.5 Italy
        6. 4.5.2.6 Spain
        7. 4.5.2.7 Rest of Europe
      3. 4.5.3 APAC
        1. 4.5.3.1 China
        2. 4.5.3.2 India
        3. 4.5.3.3 Japan
        4. 4.5.3.4 South Korea
        5. 4.5.3.5 Malaysia
        6. 4.5.3.6 Thailand
        7. 4.5.3.7 Indonesia
        8. 4.5.3.8 Rest of APAC
      4. 4.5.4 South America
        1. 4.5.4.1 Brazil
        2. 4.5.4.2 Mexico
        3. 4.5.4.3 Argentina
        4. 4.5.4.4 Rest of South America
      5. 4.5.5 MEA
        1. 4.5.5.1 GCC Countries
        2. 4.5.5.2 South Africa
        3. 4.5.5.3 Rest of MEA 5
  5. SECTION V: COMPETITIVE ANALYSIS
    1. 5.1 Competitive Landscape
      1. 5.1.1 Overview
      2. 5.1.2 Competitive Analysis
      3. 5.1.3 Market share Analysis
      4. 5.1.4 Major Growth Strategy in the Information and Communications Technology
      5. 5.1.5 Competitive Benchmarking
      6. 5.1.6 Leading Players in Terms of Number of Developments in the Information and Communications Technology
      7. 5.1.7 Key developments and growth strategies
        1. 5.1.7.1 New Product Launch/Service Deployment
        2. 5.1.7.2 Merger & Acquisitions
        3. 5.1.7.3 Joint Ventures
      8. 5.1.8 Major Players Financial Matrix
        1. 5.1.8.1 Sales and Operating Income
        2. 5.1.8.2 Major Players R&D Expenditure. 2023
    2. 5.2 Company Profiles
      1. 5.2.1 ISS A/S (DK)
        1. 5.2.1.1 Financial Overview
        2. 5.2.1.2 Products Offered
        3. 5.2.1.3 Key Developments
        4. 5.2.1.4 SWOT Analysis
        5. 5.2.1.5 Key Strategies
      2. 5.2.2 Sodexo (FR)
        1. 5.2.2.1 Financial Overview
        2. 5.2.2.2 Products Offered
        3. 5.2.2.3 Key Developments
        4. 5.2.2.4 SWOT Analysis
        5. 5.2.2.5 Key Strategies
      3. 5.2.3 CBRE Group, Inc. (US)
        1. 5.2.3.1 Financial Overview
        2. 5.2.3.2 Products Offered
        3. 5.2.3.3 Key Developments
        4. 5.2.3.4 SWOT Analysis
        5. 5.2.3.5 Key Strategies
      4. 5.2.4 JLL (US)
        1. 5.2.4.1 Financial Overview
        2. 5.2.4.2 Products Offered
        3. 5.2.4.3 Key Developments
        4. 5.2.4.4 SWOT Analysis
        5. 5.2.4.5 Key Strategies
      5. 5.2.5 Cushman & Wakefield (US)
        1. 5.2.5.1 Financial Overview
        2. 5.2.5.2 Products Offered
        3. 5.2.5.3 Key Developments
        4. 5.2.5.4 SWOT Analysis
        5. 5.2.5.5 Key Strategies
      6. 5.2.6 Aramark (US)
        1. 5.2.6.1 Financial Overview
        2. 5.2.6.2 Products Offered
        3. 5.2.6.3 Key Developments
        4. 5.2.6.4 SWOT Analysis
        5. 5.2.6.5 Key Strategies
      7. 5.2.7 G4S plc (GB)
        1. 5.2.7.1 Financial Overview
        2. 5.2.7.2 Products Offered
        3. 5.2.7.3 Key Developments
        4. 5.2.7.4 SWOT Analysis
        5. 5.2.7.5 Key Strategies
      8. 5.2.8 Compass Group PLC (GB)
        1. 5.2.8.1 Financial Overview
        2. 5.2.8.2 Products Offered
        3. 5.2.8.3 Key Developments
        4. 5.2.8.4 SWOT Analysis
        5. 5.2.8.5 Key Strategies
      9. 5.2.9 Mitie Group PLC (GB)
        1. 5.2.9.1 Financial Overview
        2. 5.2.9.2 Products Offered
        3. 5.2.9.3 Key Developments
        4. 5.2.9.4 SWOT Analysis
        5. 5.2.9.5 Key Strategies
    3. 5.3 Appendix
      1. 5.3.1 References
      2. 5.3.2 Related Reports

Facility Management Services Market Segmentation

Facility Management Services Market By Application (USD Billion, 2025-2035)

  • Commercial
  • Residential
  • Industrial
  • Institutional

Facility Management Services Market By Service Type (USD Billion, 2025-2035)

  • Cleaning Services
  • Security Services
  • Maintenance Services
  • Support Services

Facility Management Services Market By End Use (USD Billion, 2025-2035)

  • Healthcare
  • Education
  • Retail
  • Hospitality

Facility Management Services Market By Facility Type (USD Billion, 2025-2035)

  • Office Buildings
  • Manufacturing Facilities
  • Shopping Malls
  • Educational Institutions

Compare Licence

×
Features License Type
Single User Multiuser License Enterprise User
Price $4,950 $5,950 $7,250
Maximum User Access Limit 1 User Upto 10 Users Unrestricted Access Throughout the Organization
Free Customization
Direct Access to Analyst
Deliverable Format
Platform Access
Discount on Next Purchase 10% 15% 15%
Printable Versions