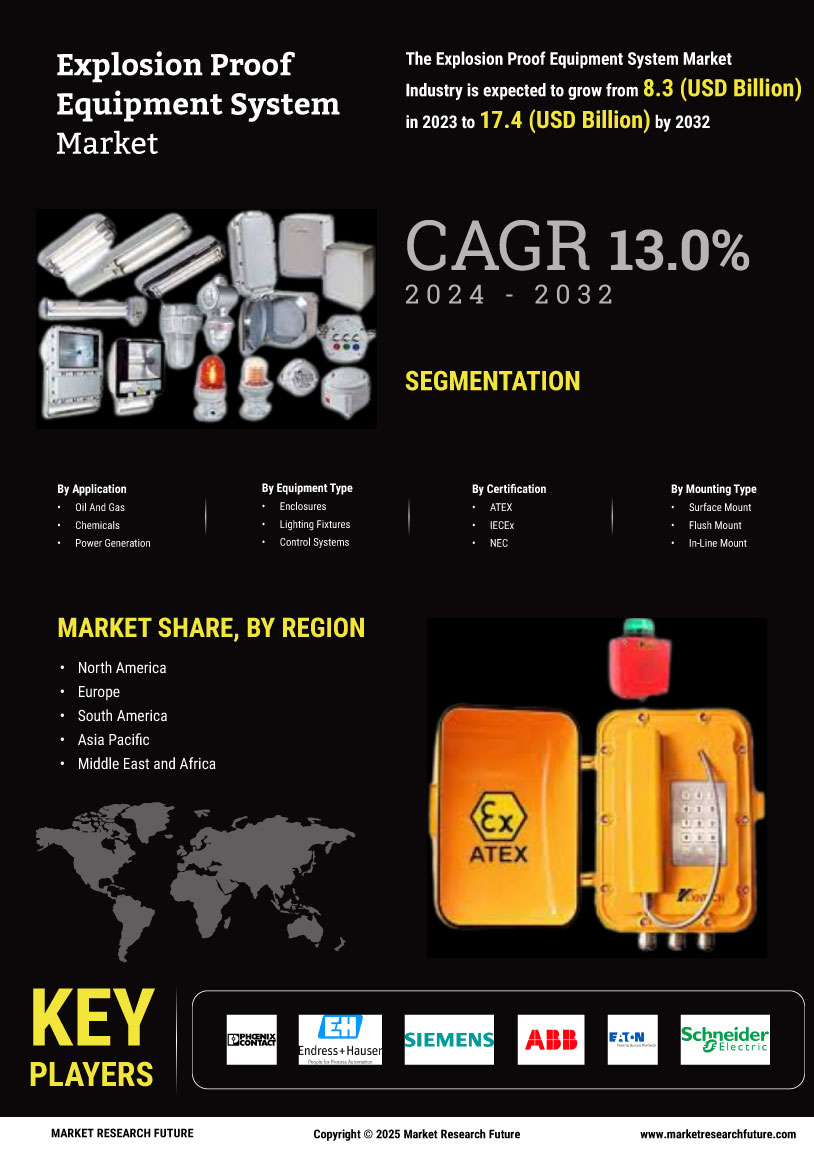
Explosion Proof Equipment System Market
ID: MRFR/SEM/22242-HCR
128 Pages
Aarti Dhapte
Last Updated: April 06, 2026
Explosion Proof Equipment System Market Size, Share and Research Report By Application (Oil And Gas, Chemicals, Power Generation, Mining, Food Processing, Pharmaceuticals, Transportation), By Equipment Type (Enclosures, Lighting Fixtures, Control Systems, Valves, Cables And Connectors, Motors, Generators), By Certification (ATEX, IECEx, NEC, CSA, GOST-R, SIL, DNV-GL), By Mounting Type (Surface Mount, Flush Mount, In-Line Mount, Pendant Mount, Wall Mount) and By Regional (North America, Europe, South America, Asia Pacific, Middle East and Africa) - Industry Forecast Till 2035