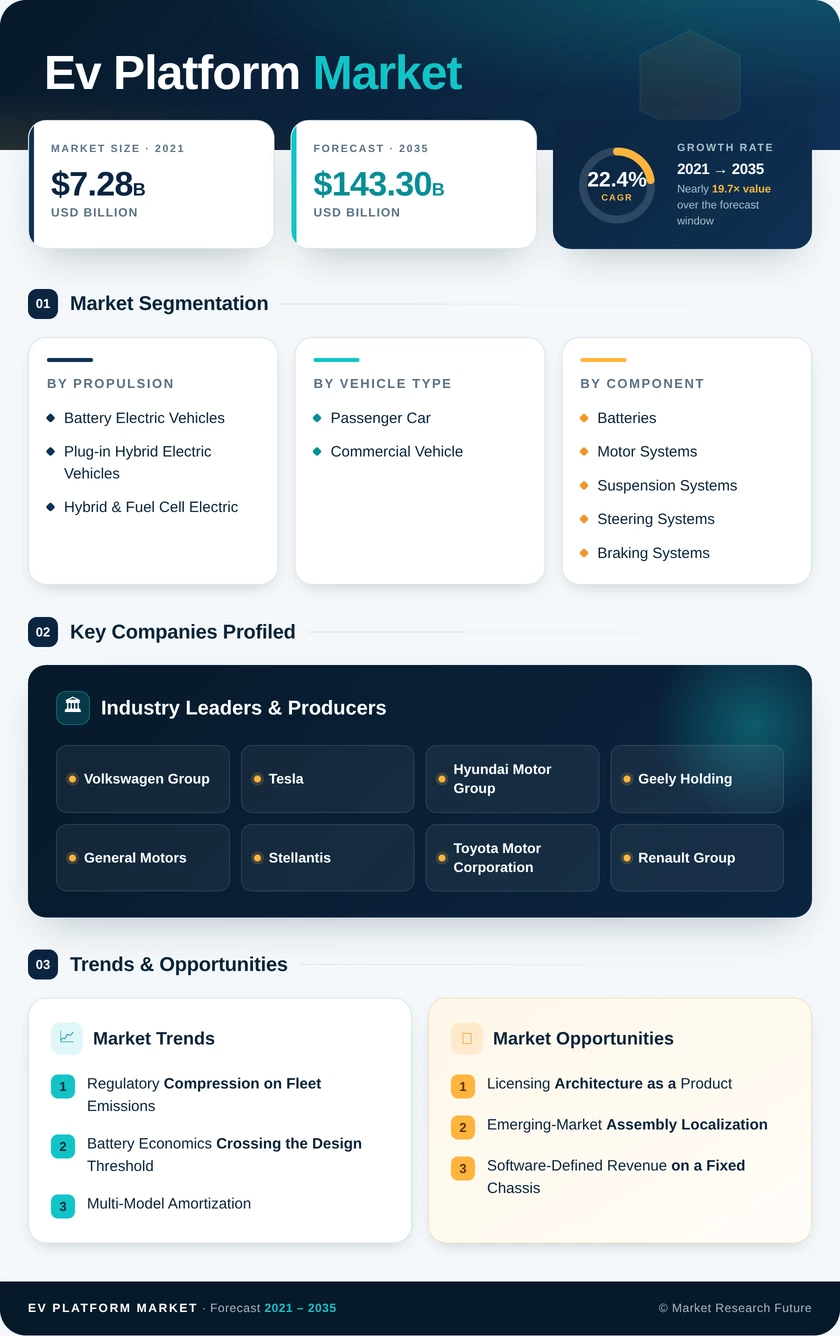
Ev Platform Market (2026 - 2035)

ID: MRFR/AT/31381-HCR 128 Pages Shubham Munde Last Updated: October 17, 2026
EV Platform Market Research Report By Propulsion (Battery Electric Vehicles, Plug-in Hybrid Electric Vehicles, Hybrid & Fuel Cell Electric, Electric Vehicles (HEVs)), By Vehicle Type (Passenger Car, Commercial Vehicle), By Component (Batteries, Motor Systems, Suspension Systems, Steering Systems, Braking Systems, Chassis, Frame & Other), By Operator (OEMs, Contract Manufacturers / Integrators, Fleet Operators & Retrofit Companies, Other Operators), By Platform Type (Dedicated EV Platform, Modular Platform, Modified ICE Platform) - Forecast to 2035
Ev Platform Market
Market Size
Forecast Period2026-2035
CAGR (2026-2035)22.4%
2025 Market SizeUSD 18.67 Billion
2035 Market SizeUSD 143.30 Billion
Key Players
Volkswagen Group
Tesla
Hyundai Motor Group
Geely Holding
General Motors
Stellantis
Opportunities
  • Licensing Architecture as a Product
  • Emerging-Market Assembly Localization
  • Software-Defined Revenue on a Fixed Chassis
  1. 1 Market Overview | |
    1. 1.1 Study Assumptions & Market Definition | |
    2. 1.2 Scope of the Study | |
    3. 1.3 Research Methodology | |
  2. 2 Market Summary & Key Report Takeaways | |
    1. 2.1 Takeaways by Technology | |
    2. 2.2 Takeaways by Sector | |
    3. 2.3 Takeaways by Region | |
  3. 3 Global Market Size & Forecast (2021–2035) | |
    1. 3.1 Historical Market Size (2021–2025) | |
    2. 3.2 Current & Forecast Market Size (2026–2035) | |
    3. 3.3 Market Size by Revenue (USD Billion) | |
    4. 3.4 Year-over-Year Growth Analysis | |
  4. 4 Market Dynamics — Drivers | |
    1. 4.1 Regulatory Compression on Fleet Emissions | |
    2. 4.2 Battery Economics Crossing the Design Threshold | |
    3. 4.3 Multi-Model Amortization | |
    4. 4.4 Commercial Fleet Total-Cost Crossover | |
  5. 5 Market Dynamics — Restraints | |
    1. 5.1 Capital Intensity of Dedicated Tooling | |
    2. 5.2 Critical Mineral Supply Concentration | |
    3. 5.3 Platform Obsolescence Against Chemistry Shifts | |
  6. 6 Market Opportunity Analysis | |
    1. 6.1 Licensing Architecture as a Product | |
    2. 6.2 Emerging-Market Assembly Localization | |
    3. 6.3 Software-Defined Revenue on a Fixed Chassis | |
    4. 6.4 Commercial Payload Specialization | |
    5. 6.5 Circularity and Second-Life Pack Design | |
    6. 6.6 Industry Value Chain Analysis | |
    7. 6.7 Porter's Five Forces Analysis | |
  7. 7 Regional Analysis | |
    1. 7.1 North America | | |
      1. 7.1.1 US | | |
      2. 7.1.2 Canada | | |
      3. 7.1.3 Mexico | |
    2. 7.2 Europe | | |
      1. 7.2.1 Germany | | |
      2. 7.2.2 UK | | |
      3. 7.2.3 France | | |
      4. 7.2.4 Italy | | |
      5. 7.2.5 Spain | | |
      6. 7.2.6 Nordic Countries | | |
      7. 7.2.7 Russia | | |
      8. 7.2.8 Rest of Europe | |
    3. 7.3 Asia-Pacific | | |
      1. 7.3.1 China | | |
      2. 7.3.2 India | | |
      3. 7.3.3 Japan | | |
      4. 7.3.4 South Korea | | |
      5. 7.3.5 ASEAN | | |
      6. 7.3.6 Rest of Asia-Pacific | |
    4. 7.4 South America | | |
      1. 7.4.1 Brazil | | |
      2. 7.4.2 Argentina | | |
      3. 7.4.3 Rest of South America | |
    5. 7.5 Middle East & Africa | | |
      1. 7.5.1 Saudi Arabia | | |
      2. 7.5.2 UAE | | |
      3. 7.5.3 South Africa | | |
      4. 7.5.4 Egypt | | |
      5. 7.5.5 Rest of Middle East & Africa | |
  8. 8 Future Outlook (2026–2035) | |
    1. 8.1 Autonomy-Ready Underbodies | |
    2. 8.2 Platform Economics and Break-Even Volume | |
    3. 8.3 The Electrification Supercycle | |
    4. 8.4 Sustainability Reporting as a Design Input | |
  9. 9 Segmentation Analysis | |
    1. 9.1 By Propulsion | | |
      1. 9.1.1 Battery Electric Vehicles | | |
      2. 9.1.2 Plug-in Hybrid Electric Vehicles | | |
      3. 9.1.3 Hybrid & Fuel Cell Electric | | |
      4. 9.1.4 Electric Vehicles (HEVs) | |
    2. 9.2 By Vehicle Type | | |
      1. 9.2.1 Passenger Car | | |
      2. 9.2.2 Commercial Vehicle | |
    3. 9.3 By Component | | |
      1. 9.3.1 Batteries | | |
      2. 9.3.2 Motor Systems | | |
      3. 9.3.3 Suspension Systems | | |
      4. 9.3.4 Steering Systems | | |
      5. 9.3.5 Braking Systems | | |
      6. 9.3.6 Chassis, Frame & Other | |
    4. 9.4 By Operator | | |
      1. 9.4.1 OEMs | | |
      2. 9.4.2 Contract Manufacturers / Integrators | | |
      3. 9.4.3 Fleet Operators & Retrofit Companies | | |
      4. 9.4.4 Other Operators | |
    5. 9.5 By Platform Type | | |
      1. 9.5.1 Dedicated EV Platform | | |
      2. 9.5.2 Modular Platform | | |
      3. 9.5.3 Modified ICE Platform | |
  10. 10 Competitive Landscape | |
    1. 10.1 Market Concentration Analysis (2026) | |
    2. 10.2 Competitive Benchmarking Matrix | |
    3. 10.3 Company Profiles | | |
      1. 10.3.1 Volkswagen Group | | |
      2. 10.3.2 BYD Company | | |
      3. 10.3.3 Tesla | | |
      4. 10.3.4 Hyundai Motor Group | | |
      5. 10.3.5 Geely Holding | | |
      6. 10.3.6 General Motors | | |
      7. 10.3.7 Stellantis | | |
      8. 10.3.8 Toyota Motor Corporation | | |
      9. 10.3.9 Renault Group | | |
      10. 10.3.10 Magna International | | |
      11. 10.3.11 REE Automotive | | |
      12. 10.3.12 Rivian Automotive | |
  11. 11 Recent Developments & News | |
  12. 12 Report Scope & Methodology | |
    1. 12.1 Study Period & Base Year | |
    2. 12.2 Data Sources & Citations | |
    3. 12.3 Abbreviations | |
  13. 13 Detailed Sources and Citations | |
  14. 14 Frequently Asked Questions (FAQs) | | LIST OF TABLES | |
  15. TABLE 1 Global EV Platform Market Size & Forecast, by Revenue (USD Billion), 2021–2035 | |
  16. TABLE 2 Global EV Platform Market — Year-over-Year Growth Analysis, 2021–2035 | |
  17. TABLE 3 Driver Impact Analysis — Estimated Contribution to CAGR, 2026–2035 | |
  18. TABLE 4 Restraint Impact Analysis — Estimated Drag on CAGR, 2026–2035 | |
  19. TABLE 5 Global EV Platform Market Size, by Region, 2021–2035 (USD Billion) | |
  20. TABLE 6 North America EV Platform Market Size, by Country, 2021–2035 (USD Billion) | |
  21. TABLE 7 Europe EV Platform Market Size, by Country, 2021–2035 (USD Billion) | |
  22. TABLE 8 Asia-Pacific EV Platform Market Size, by Country, 2021–2035 (USD Billion) | |
  23. TABLE 9 South America EV Platform Market Size, by Country, 2021–2035 (USD Billion) | |
  24. TABLE 10 Middle East & Africa EV Platform Market Size, by Country, 2021–2035 (USD Billion) | |
  25. TABLE 11 Global EV Platform Market Size, by Propulsion, 2021–2035 (USD Billion) | |
  26. TABLE 12 Global EV Platform Market Size, by Vehicle Type, 2021–2035 (USD Billion) | |
  27. TABLE 13 Global EV Platform Market Size, by Component, 2021–2035 (USD Billion) | |
  28. TABLE 14 Global EV Platform Market Size, by Operator, 2021–2035 (USD Billion) | |
  29. TABLE 15 Global EV Platform Market Size, by Platform Type, 2021–2035 (USD Billion) | |
  30. TABLE 16 North America EV Platform Market Size, by Propulsion, 2021–2035 (USD Billion) | |
  31. TABLE 17 North America EV Platform Market Size, by Vehicle Type, 2021–2035 (USD Billion) | |
  32. TABLE 18 North America EV Platform Market Size, by Component, 2021–2035 (USD Billion) | |
  33. TABLE 19 Europe EV Platform Market Size, by Propulsion, 2021–2035 (USD Billion) | |
  34. TABLE 20 Europe EV Platform Market Size, by Vehicle Type, 2021–2035 (USD Billion) | |
  35. TABLE 21 Europe EV Platform Market Size, by Platform Type, 2021–2035 (USD Billion) | |
  36. TABLE 22 Asia-Pacific EV Platform Market Size, by Propulsion, 2021–2035 (USD Billion) | |
  37. TABLE 23 Asia-Pacific EV Platform Market Size, by Component, 2021–2035 (USD Billion) | |
  38. TABLE 24 Asia-Pacific EV Platform Market Size, by Operator, 2021–2035 (USD Billion) | |
  39. TABLE 25 South America EV Platform Market Size, by Vehicle Type, 2021–2035 (USD Billion) | |
  40. TABLE 26 South America EV Platform Market Size, by Platform Type, 2021–2035 (USD Billion) | |
  41. TABLE 27 Middle East & Africa EV Platform Market Size, by Propulsion, 2021–2035 (USD Billion) | |
  42. TABLE 28 Middle East & Africa EV Platform Market Size, by Operator, 2021–2035 (USD Billion) | |
  43. TABLE 29 Competitive Benchmarking Matrix — Global EV Platform Market, 2026 | |
  44. TABLE 30 Company Profiles — Key Players, Global EV Platform Market | |
  45. TABLE 31 Recent Developments & Strategic Announcements, 2023–2025 | |
  46. TABLE 32 Report Scope & Methodology Summary | |
  47. TABLE 33 Detailed Sources and Citations Index | | LIST OF FIGURES | |
  48. FIGURE 1 Global EV Platform Market — Market Dynamics Snapshot (Drivers, Restraints, Opportunities) | |
  49. FIGURE 2 Industry Value Chain Analysis — From Cell Supply to Rolling Chassis | |
  50. FIGURE 3 Porter's Five Forces Analysis — Global EV Platform Market | |
  51. FIGURE 4 Global Market Size Trend & Forecast, 2021–2035 (USD Billion) | |
  52. FIGURE 5 Year-over-Year Growth Trajectory, 2022–2035 (%) | |
  53. FIGURE 6 Market Share by Propulsion, 2025 vs 2035 (%) | |
  54. FIGURE 7 Market Share by Vehicle Type, 2025 vs 2035 (%) | |
  55. FIGURE 8 Market Share by Component, 2025 (%) | |
  56. FIGURE 9 Market Share by Operator, 2025 vs 2035 (%) | |
  57. FIGURE 10 Market Share by Platform Type, 2025 vs 2035 (%) | |
  58. FIGURE 11 Regional Revenue Share Distribution, 2025 (%) | |
  59. FIGURE 12 Regional Revenue Share Distribution, 2035 (%) | |
  60. FIGURE 13 Regional CAGR Comparison, 2026–2035 (%) | |
  61. FIGURE 14 Country-Level Growth Heat Map, 2026–2035 | |
  62. FIGURE 15 Competitive Landscape — Estimated Revenue Share Bands, 2026 | |
  63. FIGURE 16 Competitive Positioning Matrix — Scale vs Architecture Openness | |
  64. FIGURE 17 Battery Pack Cost Curve vs Platform Integration Depth, 2021–2035 | |
  65. FIGURE 18 Platform Break-Even Volume Sensitivity Analysis

Segmentation Quick Reference

DimensionSub-SegmentsDominant SegmentFastest Growing Segment
By PropulsionBattery Electric Vehicles; Plug-in Hybrid Electric Vehicles; Hybrid & Fuel Cell ElectricBattery Electric VehiclesBattery Electric Vehicles
By Vehicle TypePassenger Car; Commercial VehiclePassenger CarCommercial Vehicle
By ComponentBatteries; Motor Systems; Suspension Systems; Steering Systems; Braking Systems; Chassis, Frame & OtherBatteriesMotor Systems
By OperatorOEMs; Contract Manufacturers / Integrators; Fleet Operators & Retrofit Companies; Other OperatorsOEMsFleet Operators & Retrofit Companies
By Platform TypeDedicated EV Platform; Modular Platform; Modified ICE PlatformDedicated EV PlatformModular Platform
By RegionNorth America; Europe; Asia-Pacific; South America; Middle East & AfricaAsia-PacificSouth America


Market Segmentation Overview

By Propulsion

Sub-SegmentKey Trend
Battery Electric VehiclesStructural pack integration turning the floor into a load-bearing member
Plug-in Hybrid Electric VehiclesTransitional demand in markets with thin fast-charging coverage
Hybrid & Fuel Cell ElectricConcentrated in heavy-duty and long-range duty cycles


Propulsion choice sets the architectural ceiling. Battery electric layouts free designers from tunnels and exhaust routing, which is why they attract the majority of new architecture spending, while hybrid variants carry packaging penalties that limit their long-term platform relevance.

By Vehicle Type

Sub-SegmentKey Trend
Passenger CarConsolidation onto fewer shared underbodies across C and D segments
Commercial VehicleHigh-payload chassis variants with configurable wheelbase and overhang


Passenger volume underwrites the investment case, but commercial demand is where growth compounds fastest. Fleet buyers order in blocks and specify against duty cycles, giving architecture teams unusually clear requirements to engineer against.

By Component

Sub-SegmentKey Trend
BatteriesCell-to-chassis integration replacing modular pack assemblies
Motor SystemsSealed e-axle units consolidating motor, inverter and reduction gear
Suspension SystemsRecalibration for higher sprung mass and altered weight distribution
Steering SystemsMigration toward steer-by-wire with redundant actuation paths
Braking SystemsRegenerative blending reducing friction-brake duty and wear
Chassis, Frame & OtherGiga-casting collapsing dozens of stampings into single parts


Component economics are being rewritten by integration. Each consolidation step removes fasteners, connectors, and assembly stations, which is why suppliers capable of delivering complete subsystems are gaining share against single-part specialists.

By Operator

Sub-SegmentKey Trend
OEMsRetaining architecture ownership while opening selective licensing
Contract Manufacturers / IntegratorsOffering capital-light routes to market for new entrants
Fleet Operators & Retrofit CompaniesMid-life conversion of high-utilization commercial assets
Other OperatorsSpecialty, defence and low-volume purpose-built applications


Operator structure is diversifying faster than most forecasts anticipated. Architecture ownership no longer maps cleanly onto vehicle branding, and licensing arrangements are creating hybrid commercial models that blur traditional supplier-customer boundaries.

By Platform Type

Sub-SegmentKey Trend
Dedicated EV PlatformPurpose-built flat-floor structures optimized for range and interior volume
Modular PlatformScalable wheelbase and track enabling multi-bodystyle coverage
Modified ICE PlatformDeclining as amortized combustion tooling reaches end of book life


A modular EV architecture platform spreads fixed cost across the widest possible nameplate set, which is why scalability now outranks outright optimization in most product planning decisions. Dedicated structures still deliver the best engineering outcome, and the two approaches are converging as modular families adopt dedicated-grade packaging.

By Region

Sub-SegmentKey Trend
North AmericaContent-rule-driven sourcing redesign under federal credit thresholds
EuropeCompliance economics forcing accelerated architecture consolidation
Asia-PacificIntegrated industrial clusters compressing development cycles
South AmericaTariff escalation converting import plans into assembly commitments
Middle East & AfricaSovereign capital entering architecture ownership directly


Region now determines architecture specification as much as consumer taste does. Content rules, tariff schedules and carbon declarations each impose design constraints that travel upstream into the underbody, making regional strategy inseparable from engineering strategy.




Download PDF ×

We do not share your information with anyone. However, we may send you emails based on your report interest from time to time. You may contact us at any time to opt-out.